

Abstract
Background
In maintenance hemodialysis (MHD) patients, a low serum transthyretin (prealbumin) is an indicator of protein-energy wasting. We hypothesized that baseline serum transthyretin correlates independently with health related quality of life (QoL) and death and that its change over time is a robust mortality predictor.
Methods
Associations and survival predictability of serum transthyretin at baseline and its changes over 6 months were examined in a 5-year (2001-06) cohort of 798 MHD patients.
Results
Patients with serum transthyretin ≥40 mg/dL had greater mid-arm muscle circumference but lower total body fat percentage. Both serum interleukin-6 and dietary protein intake correlated independently with serum transthyretin. Measures of QoL indicated better physical health, physical function and functionality in higher transthyretin levels. Although baseline transthyretin was not superior to albumin in predicting survival, in both all and normoalbuminemic (albumin≥3.5 g/dL, n=655) patients, transthyretin<20 mg/dL was associated with higher death risk in adjusted models, but further adjustments for inflammatory cytokines mitigated the associations. In 412 patients with baseline transthyretin between 20 and 40 mg/dl, whose serum transthyretin was remeasured after 6 months, a 10 mg/dL or greater fall resulted in death hazard ratio of 1.37 (95% confidence levels: 1.02, 1.85; p=0.03) after adjustment for baseline measures including inflammatory markers.
Conclusions
Even though baseline serum transthyretin may not be superior to albumin in predicting mortality in MHD patients, transthyretin levels below 20 mg/dL are associated with death risk even in normoalbuminemic patients, and a fall in serum transthyretin over 6 months is independently associated with increased death risk.
Keywords: Transthyretin (prealbumin), chronic kidney disease (CKD), inflammation, protein-energy wasting (PEW), health related quality of life (QoL)
Introduction
Protein-energy wasting (PEW) is common in individuals with advanced chronic kidney disease (CKD) including those undergoing maintenance dialysis treatment.(1–3) Since poor nutritional status is associated with increased death risk in dialysis patients,(4) measuring reliable markers of PEW may lead to timely interventions for individuals at risk. Hypoalbuminemia is currently the most commonly used surrogate of PEW in dialysis patients and has a strong association with increased mortality,(5, 6) even though a low serum albumin appears to be a strong marker of inflammation rather than nutritional status.(2) Several studies have advocated the use of serum prealbumin, also known as transthyretin, as a better surrogate of nutritional status in this patient population.(2, 7–9) The National Kidney Foundation Kidney Disease Quality Initiative (K/DOQI) guideline has recommended transthyretin as a useful measure of nutritional status.(1) However, similar to albumin, inflammation can lead to a reduction in serum transthyretin.(9, 10) To our knowledge, thus far published studies of the relationship between serum transthyretin and mortality in CKD patients have only studied the baseline measures ignoring its longitudinal changes over time. It is not known whether serum transthyretin or it changes over time are associated with mortality in normoalbuminemic patients or after controlling for other nutritional and inflammatory markers. The association between transthyretin and other relevant outcomes such as health related quality of life is not well studied. We hypothesized that serum transthyretin is a reliable and robust marker of nutrition, quality of life and survival in maintenance hemodialysis (MHD) patients including in normoalbuminemic patients and that its changes over time can predict mortality independent of baseline measures. To test the foregoing hypothesis, we examined a cohort of 798 MHD patients who were followed for up to 5 years with repeated nutritional and inflammatory measures.
Methods
Patient Population
We studied MHD patients who were participating in the Nutritional and Inflammatory Evaluation in Dialysis (NIED) Study.(11) The original cohort was derived from a pool of approximately 1,300 MHD outpatients in eight DaVita, Inc, chronic dialysis facilities in the South Bay Los Angeles area (see NIED Study website at www.NIEDStudy.org for more details). Inclusion criteria were outpatients who had been undergoing MHD for at least eight weeks, were 18 years or older and who signed a local Institutional Review Board approved consent form. Patients with an anticipated life expectancy of less than 6 months (for example, due to a metastatic malignancy or advanced HIV/AIDS disease) were excluded. From October 1, 2001, through December 31, 2006, 893 MHD patients from eight DaVita dialysis facilities in the Los Angeles South Bay area signed the written consent form, approved by the Institutional Review Committee of Harbor-UCLA campus, and underwent periodic evaluations of the NIED Study. For these analyses, data including baseline serum transthyretin were available in 798 MHD patients. In a subgroup of 156 randomly selected patients, the protein and energy intakes were estimated using a 3-day diet diary and the total T-score of bone mineral density was measured using dual energy X-ray absoptiometery (DXA).
The medical chart of each MHD patient was thoroughly reviewed by a collaborating physician, and data pertaining to underlying kidney disease, cardiovascular history and other comorbid conditions were extracted. A modified version of the Charlson comorbidity index, i.e., without the age and kidney disease components, was used to assess the severity of comorbidities.(12, 13) The 798 MHD patients were followed for up to 63 months, i.e., until December 31, 2006.
SF36 Health Related Quality of Life Score
The SF36, a short form health-related quality of life scoring system with 36 items, which includes eight independent scales, is a well-documented, self-administered questionnaire and has been widely used and validated in MHD patients.(14, 15) The eight scales of SF36 are summarized into two dimensions: “Physical Health” and “Mental Health”.(15)
Anthropometric Measures
Body weight assessment and anthropometric measurements were performed while patients were undergoing a hemodialysis treatment or within 5 to 20 minutes after termination of the treatment. Biceps skinfold (BSF) and triceps skinfold (TSF) thicknesses were measured with a conventional skinfold caliper using standard techniques as previously described. (16, 17)
Near Infra-Red Interactance
To measure the percentage of body fat and estimate fat-free body mass, near infra-red (NIR) interactance was measured at the same time as the anthropometric measurements. (18, 19). A commercial NIR sensor with a coefficient of variation of 0.5% for total body fat measurement (portable Futrex® 6100 sensor, Gaithersburg, Maryland, www.futrex.com) was used. NIR measurements were performed by placing the NIR sensor for several seconds on the upper arm in an area without a vascular access for dialysis treatment. NIR measurements of body fat appear to correlate significantly with other nutritional measures in MHD patients.(19)
Laboratory Tests
Pre-dialysis blood samples and post-dialysis serum urea nitrogen were obtained on a mid-week day and coincided chronologically with the drawing of quarterly blood tests in the DaVita facilities. The single-pool Kt/V was used to represent the weekly dialysis dose. All routine laboratory measurements were performed by DaVita® Laboratories (Deland, FL) using automated methods.
Serum high sensitivity C-reactive protein (CRP) was measured by a turbidometric immunoassay in which a serum sample is mixed with latex beads coated with anti-human CRP antibodies forming an insoluble aggregate (manufacturer: WPCI, Osaka, Japan, unit: mg/L, normal range: <3.0 mg/L). (20, 21) Interleukin 6 (IL-6) and tumor necrosis factor alpha (TNF-α) were measured with immunoassay kits based on a solid phase sandwich ELISA using recombinant human IL-6 and TNF-α (manufacturer: R&D Systems, Minneapolis, MN; units: pg/ml; normal range: IL-6: <9.9 pg/ml, TNF-α: <4.7 pg/ml) (22, 23). CRP and the cytokines were measured in the General Clinical Research Center Laboratories of Harbor-UCLA Medical Center. Plasma total homocysteine concentrations were determined by high-performance liquid chromatography in the Harbor-UCLA Clinical Laboratories. Serum transthyretin was measured using immunoprecipitin analysis in the Harbor-UCLA. (8)
Statistical Methods
Pearson´s correlation coefficient (r) was used for analyses of linear associations. Multivariate regression analyses were performed to obtain adjusted p-values controlled for case-mix and other covariates. To calculate the relative risks of death, hazard ratios (HR) were obtained using Cox proportional hazard models after controlling for the covariates. Kaplan-Meier analyses were utilized to assess the differences in surviving proportions between transthyretin categories. Case-mix and comorbidity covariates included gender, age, race and ethnicity (Hispanics, Blacks, Asians and others), diabetes mellitus, the modified Charlson comorbidity scale, and dialysis vintage. Laboratory measures of the “malnutrition-inflammation complex syndrome” (MICS) in fully adjusted Cox models included serum CRP, IL-6, and albumin concentrations. Non-linear associations as continuous mortality predictors were studied using restricted cubic splines to examine inappropriate linearity assumptions. (24) To mitigate the risk of regression to the mean, baseline serum transthyretin was included as covariate in all Cox and cubic spline models utilized to assess the death HRs of transthyretin change.
To compare the mortality predictability of serum albumin and transthyretin concentrations, receiver operating characteristic (ROC) curves were constructed in which death was the reference variable and the unadjusted or fully adjusted death hazard score of transthyretin or albumin were the predicting variables. The differences of the areas under ROC curves were examined and compared using the roccomp command in Stata. Sensitivity (y-axis) was plotted against one minus specificity (x-axis) for each possible cutoff value of hazard score of the Cox models including these two laboratory values and death as the dependent (reference) variable.(25) The area under the curve represents the discriminative power of the test. Values are expected to be between 0.5 (indicating no discriminative ability) and 1.0 (indicating highest detection accuracy).
Fiducial limits are given as mean±SD (standard deviation) or median and inter-quartile range; risk ratios include 95% confidence interval (CI) levels. A p-value <0.05 or a 95% CI that did not span 1.0 was considered to be statistically significant. Descriptive and multivariate statistics were carried out with the statistical software “Stata version 10.0” (Stata Corporation, College Station, Texas).
Results
The average (mean±SD) baseline serum transthyretin in the 798 MHD patients was 28.3±9.6 mg/dL (median: 28.0, minimum: 4.0, maximum: 59.0, inter-quartile range: 7–55 mg/dL). Four a priori categories of serum transthyretin levels with 10 mg/dL increments were selected based on the practical clinical utility of the cutoff levels: <20 mg/dL (n=147, 18%), 20 to <30 mg/dL (n=316, 40%), 30 to <40 mg/dL (n=248, 31%) and >=40 mg/dL (n=87, 11%). Table 1 shows the relevant demographic, clinical and laboratory measures in all 798 MHD patients as well as across the four categories of transthyretin. The proportion of female or diabetic patients was higher in the groups with lower transthyretin levels. The MHD patients with lower transthyretin had more comorbidities according to the modified Charlson score, smaller mid-arm muscle circumference, higher near infra-red measured total body fat percentage, lower nPNA (nPCR) as the surrogate of dietary protein intake, and incrementally higher mortality rates. Patients with serum transthyretin levels above 40 mg/dL also had higher mid-arm muscle circumference and the lowest body fat content compared to patients in the groups with lowest serum transthyretin. Among laboratory measures, serum albumin and homocysteine levels were lower and serum CRP and IL-6 were higher in the groups with lower serum transthyretin levels.
Table 1.
Baseline demographic, clinical, and laboratory values in total and according to the four a priori selected groups of serum transthyretin in 798 MHD patients1
| Variable | Transthyretin (mg/dL)
|
|||||
|---|---|---|---|---|---|---|
| Total (n=798) |
<20 (n=147) |
20 to <30 (n=316) |
30 to <40 (n=248) |
≥40 (n=87) |
P for trend | |
| Demographic | ||||||
| Age (years) | 53.6±14.8 | 55.2±14.2 | 55.4±14.6 | 52.7±15.3 | 46.9±13.2 | <0.001 |
| Women (%) | 46 | 50 | 52 | 42 | 29 | <0.001 |
| Marital status: % married | 47 | 46 | 45 | 50 | 51 | 0.3 |
| Race: % African-American | 31 | 25 | 30 | 38 | 28 | 0.08 |
| Ethnicity: % Hispanic | 50 | 59 | 48 | 46 | 55 | 0.2 |
| Primary insurance: % Medicare | 55 | 51 | 51 | 50 | 55 | 0.9 |
| Diabetes mellitus (%) | 60 | 60 | 63 | 49 | 35 | <0.001 |
| Modified Charlson comorbidity score | 1.9±1.6 | 2.0±1.7 | 2.1±1.6 | 1.7±1.5 | 1.3±1.5 | <0.001 |
| Mortality (%) | 29 | 40 | 31 | 24 | 14 | <0.001 |
| Body composition | ||||||
| Total calorie (Kcal/day)3 | 1656±635 | 1739±513 | 1595±688 | 1605±525 | 1881±915 | 0.6 |
| Total protein (gr/day)3 | 67.3±27.7 | 70.1±20.5 | 63.2±28.4 | 64.8±25.7 | 85.2±35.2 | 0.20 |
| Bone mineral density (total T-score)3 | −0.84±1.42 | −1.06±1.40 | −1.00±1.45 | −0.59±1.43 | −0.63±1.04 | 0.12 |
| Body mass index (kg/m2) | 26.5±6.0 | 26.2±7.0 | 26.9±6.4 | 26.6±5.4 | 25.7±4.9 | 0.6 |
| Triceps skinfold (mm) | 17.5±9.9 | 16.8±10.7 | 18.0±9.6 | 17.7±10.0 | 16.7±9.7 | 0.9 |
| Biceps skinfold (mm) | 9.8±7.8 | 9.7±9.6 | 10.1±7.6 | 9.5±7.0 | 9.3±8.2 | 0.5 |
| Mid-arm muscle circumference (cm) | 25.9±4.4 | 25.4±4.7 | 25.7±4.2 | 26.1±4.3 | 26.4±4.6 | 0.05 |
| Near infrared measured body fat (%) | 26.5 ± 10.7 | 26.4 ± 10.9 | 28.0 ± 10.9 | 26.0 ± 10.4 | 22.7 ± 10.0 | 0.004 |
| Hemodialysis treatment measures | ||||||
| Dialysis vintage <6 months (%) | 18 | 20 | 19 | 17 | 16 | 0.5 |
| Dialysis vintage (months) | 31.4±34.0 | 33.4±40.5 | 29.0±31.2 | 34.0±35.2 | 30.1±27.9 | 0.2 |
| Dialysis dose (Kt/V single pool) | 1.60±0.30 | 1.59±0.32 | 1.64±0.32 | 1.57±0.29 | 1.59±0.26 | 0.4 |
| nPNA (nPCR) (g.kg−1.day−1) | 1.06±0.24 | 1.01±0.26 | 1.04±0.22 | 1.09±0.24 | 1.16±0.24 | <0.001 |
| Erythropoietin dose (1,000 u/week) | 13.9±11.7 | 17.3±15.3 | 14.2±12.2 | 12.3± 0.9 | 11.1± 7.1 | <0.001 |
| Biochemical measurements | ||||||
| Serum albumin (g/dl) | 3.89±0.38 | 3.66±0.44 | 3.86±0.34 | 3.98±0.31 | 4.19±0.25 | <0.001 |
| creatinine (mg/dl) | 10.2±3.3 | 9.0±3.1 | 9.6±3.0 | 11.2±3.1 | 12.1±3.3 | <0.001 |
| calcium (mg/dl) | 9.4±0.7 | 9.2±0.7 | 9.3±0.7 | 9.5±0.7 | 9.6±0.7 | <0.001 |
| Phosphorus (mg/dl) | 5.8±1.5 | 5.7±1.6 | 5.8±1.5 | 5.7±1.3 | 5.8±1.4 | 0.7 |
| TIBC (mg/dl) | 208±40 | 200±47 | 208±39 | 209±36 | 219±34 | 0.001 |
| ferritin (ng/ml) | 573±444 | 598±527 | 537±409 | 554±399 | 710±500 | 0.06 |
| Bicarbonate (mg/dl) | 22.3±2.8 | 22.4±2.8 | 22.7±2.9 | 21.9±2.8 | 21.6±2.6 | 0.004 |
| total homocysteine (μmol/l) | 23.5±10.9 | 20.8±8.8 | 23.4±10.5 | 24.4±10.3 | 26.4±15.3 | <0.001 |
| CRP (mg/L) | 5.7±7.0 | 7.2±7.5 | 6.1±7.3 | 5.2±6.8 | 3.1±3.4 | <0.001 |
| IL-6 (pg/ml) | 18.3±51.4 | 34.4±63.2 | 15.3±45.4 | 16.9±57.5 | 6.0±4.9 | <0.001 |
| TNF-α (pg/ml) | 8.9±12.1 | 10.4±13.7 | 7.9±11.0 | 8.8±11.1 | 10.9±15.5 | 0.3 |
| Blood hemoglobin (g/dl) | 12.1±1.0 | 11.9±1.2 | 12.1±1.0 | 12.1±0.9 | 12.1±0.8 | 0.08 |
| WBC (×1000 cell/μl) | 7.14±2.0 | 7.4±2.5 | 7.1±1.9 | 7.0±1.8 | 7.1±1.7 | 0.09 |
| Lymphocyte (% of total WBC) | 28.8±7.9 | 21.7±8.8 | 22.8±7.9 | 23.1±7.4 | 24.3±8.1 | 0.02 |
Kt/V, dialysis dose; TIBC, Total iron binding capacity; nPCR, normalized protein catabolic rate; IL-6, Interleukin 6; TNF-α, Tumor necrosis factor α
All values are presented as Mean ± SD or percentages
The number of patients in NIED substudy in each group of prealbumin is: 18, 55, 66, and 17 for <20, 20 to <30, 30 to <40, and ≥40, respectively
P-values for dialysis dose (vintage), Ferritin, vitamin D dose, Erythropoietin dose, CRP, IL-6, and TNF- α are based on the logarithmic values of these measures. Linear regression and chi2 test for trend were used for examining the significance of trends in continuous and categorical variables, respectively.
We examined the association of relevant clinical and nutritional measures with serum transthyretin levels in all 798 MHD patients as shown in Table 2. Serum transthyretin was correlated with the nPNA (nPCR) as the surrogate of dietary protein intake as well as with serum albumin, creatinine and ferritin and logarithm values of serum CRP and IL-6. Figure 1 shows the relative contributions of inflammation, represented by serum IL-6 level, and dietary protein intake, represented by nPNA, to the variability of serum transthyretin in all MHD patients. Although serum transthyretin had a slightly stronger association with IL-6 than nPNA, at all levels of multivariate adjustment, both nPNA and IL-6 maintained their robust and independent correlations with serum transthyretin (p<0.001) without any statistical interaction between these two (data not shown).
Table 2.
Unadjusted and multivariate adjusted Pearson’s correlation coefficient of baseline serum transthyretin and other relevant variables in 798 maintenance hemodialysis patients
| Variable | Unadjusted | Case-mix1 adjusted | Case-mix + albumin + inflammatory markers (Full model)2 |
|---|---|---|---|
| General variables | |||
| Age | −0.17*** | −0.10** | +0.01 |
| Charlson comorbidity score | −0.16*** | −0.07∆ | +0.01 |
| Erythropoietin dose | −0.16*** | −0.17*** | −0.09∆ |
| Nutritional variables | |||
| Body mass index | −0.03 | +0.01 | +0.05 |
| Triceps skinfold | −0.01 | +0.05 | +0.09* |
| Biceps skinfold | −0.04 | +0.01 | +0.05 |
| Mid-arm muscle circumference | +0.09* | +0.08* | +0.10** |
| Near infrared measured body fat | −0.10** | +0.04 | +0.09* |
| NIR total body fat % | −0.09* | −0.03 | +0.05 |
| Lean body mass % | +0.07∆ | −0.02 | +0.02 |
| nPNA (nPCR) | +0.18*** | +0.20*** | +0.15*** |
| Laboratory variables | |||
| Albumin | +0.42*** | +0.13*** | +0.15*** |
| Creatinine | +0.31*** | +0.24*** | +0.17*** |
| Ferritin | 0.09** | +0.13*** | +0.15*** |
| Calcium | +0.20*** | +0.19*** | +0.08* |
| Phosphorus | +0.02 | −0.03 | +0.02 |
| Homocysteine | +0.15*** | +0.13*** | +0.08* |
| Inflammatory variables | |||
| Log CRP | −0.24*** | −0.23*** | −0.12** |
| Log IL-6 | −0.33*** | −0.30*** | −0.19*** |
| Log TNF-α | −0.04 | −0.04 | +0.02 |
nPCR, normalized protein catabolic rate; IL-6, Interleukin 6; TNF-α, Tumor necrosis factor α
Case-mix variables include age, gender, race/ethnicity, diabetes, dialysis vintage, insurance (medicare), marital status, Modified Charlson comorbidity score, dialysis dose (Kt/V), and kidney residual urine (KRU)
Full model consist of case-mix variables, albumin, and three inflammatory markers: C-reactive protein, Interleukin-6, Tumor necrosis factor-α
P-value: 0.10 to 0.05,
P-value: 0.05 to 0.01;
P-value: 0.01 to 0.001;
P-value: <0.001
Figure 1.
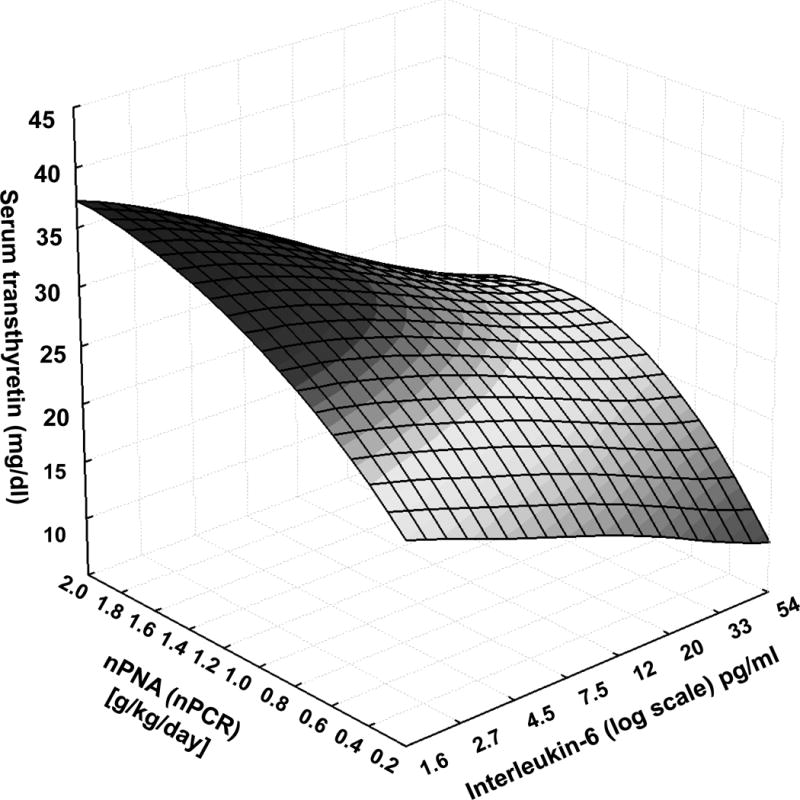
Concurrent association of nPNA (nPCR), an indirect measure of dietary protein intake, and serum interleukin-6 (IL-6), a surrogate of inflammation, with serum transthyretin (prealbumin) level in 798 maintenance hemodialysis patients.
We examined the association of serum transthyretin increments with self-reported health related quality of life as shown in Figure 2. The averaged standardized scores of SF-36 among 645 MHD patients who answered this quality of life questionnaire showed better quality of life with higher serum transthyretin values; this trend was more prominent for physical health dimension as well as the physical function and functionality scales.
Figure 2.

Standardized SF-36 quality of life scores in the 4 groups of transthyretin (mg/dl) in 645 maintenance hemodialysis patients
Footnote: serum transthyretin <20 (n=111), 20 to <30 (n=264), 30 to <40 (n=197), ≥40 (n=73)
* P <0.05
Over the 5 years of the cohort 228 (29%) patients died, 91 (11%) underwent transplantation, and 148 (19%) left the cohort without further follow-up information. Figure 3 shows the cubic splines graphs illustrating the associations between baseline serum transthyretin and mortality in the 5-year cohort of all 798 MHD patients. Patients with lower transthyretin levels, especially below 20 mg/dl, showed higher death risks including after adjustment for MICS markers and/or serum albumin. However, these relationships mitigated after additional multivariate adjustment for makers inflammation including serum CRP, IL-6 and TNF-α. Figure 4 shows the Kaplan-Meier survival curves for the four a priori selected groups of serum transthyretin levels.
Figure 3.

Mortality predictability of serum Transthyretin in 798 maintenance hemodialysis patients (Oct 2001 – Jan 2007)
Panel a. adjusted for Case-mix variables
Panel b. adjusted for Case-mix variables and serum albumin
Panel c. adjusted for Case-mix and MICS variables (including serum albumin)
Panel d. adjusted for case-mix, MICS, and inflammation
Case-mix variables: age, gender, race/ethnicity, diabetes mellitus, dialysis vintage, primary insurance, marital status, Modified Charlson co-morbidity score, dialysis dose (Kt/V), and kidney residual urine (KRU)
MICS variables: albumin, erythropoietin dose, creatinine, hemoglobin, phosphorus, total iron binding capacity (TIBC), normalized protein catabolic rate (nPCR), bicarbonate, calcium, ferritin, WBC, lymphocyte percentage, body mass index, and vitamin D dose
Inflammatory variables: C-reactive protein, Interleukin-6, Tumor necrosis factor-α
Figure 4.


Kaplan-Meier proportion of surviving maintenance hemodialysis patients after 5 years of observation according to the four a priori selected groups of serum transthyretin in 798 maintenance hemodialysis patients.
Upper panel: Unadjusted
Lower Panel: Adjusted for age and gender
Footnote: serum transthyretin <20 (n=147), 20 to <30 (n=316), 30 to <40 (n=248), ≥40 (n=87)
To further examine whether the mortality predictability of low serum transthyretin holds independent of hypoalbuminemia, we compared death hazard ratios of serum transthyretin increments in all 798 MHD patients with the subset of 655 patients who had a normal serum albumin, i.e., ≥3.5 g/dL. As shown in Table 3, a serum transthyretin below 20 mg/dL (18% of all and 12% of normoalbuminemic patients) was associated with 63% to 73% increased death risk in case-mix and MICS adjusted models. Sensitivity analyses using more parsimonious models with limited number of covariates showed similar trends (data not shown). The interaction between serum albumin and transthyretin was not statistically significant in any of the multivariate models (p>0.20).
Table 3.
Hazard ratios (HR) and 95% confidence interval (CI) of 5-year (Oct. 2001 to Jan 2007) mortality according to the four a priori selected groups of serum transthyretin in all 798 maintenance hemodialysis patients (upper rows) and in 655 normoalbuminemic (albumin ≥3.5 g/dL) patients (lower rows).
| Unadjusted | Case-mix1 adjusted | Case-mix + MICS2 adjusted | Case-mix + MICS + inflammation adjusted (Full model)3 | |||||
|---|---|---|---|---|---|---|---|---|
| Transthyretin categories (mg/dl) | HR (95% CI) | P | HR (95% CI) | P | HR (95% CI) | P | HR (95% CI) | P |
| All Patients (n=798)4 | ||||||||
| <20 (n=147) | 2.16 (1.51, 3.10) | <0.001 | 2.14 (1.48, 3.11) | <0.001 | 1.63 (1.07, 2.46) | 0.02 | 1.43 (0.93, 2.19) | 0.10 |
| 20 to <30 (n=316) | 1.34 (0.97, 1.85) | 0.08 | 1.26 (0.90, 1.74) | 0.17 | 1.12 (0.79, 1.58) | 0.5 | 1.06 (0.74, 1.50) | 0.8 |
| 30 to <40 (n=248) | 1.00 (Reference) | 1.00 (Reference) | 1.00 (Reference) | 1.00 (Reference) | ||||
| ≥40 (n=87) | 0.61 (0.33, 1.13) | 0.12 | 0.90 (0.48, 1.68) | 0.7 | 1.01 (0.53, 1.93) | 0.9 | 1.07 (0.56, 2.04) | 0.8 |
|
| ||||||||
| Normoalbuminemic patients (albumin≥3.5 g/dL, n=655)4 | ||||||||
| <20 (n=101) | 1.49 (0.95, 2.32) | 0.08 | 1.75 (1.11, 2.58) | 0.02 | 1.73 (1.07, 2.79) | 0.04 | 1.41 (0.86, 2.31) | 0.18 |
| 20 to <30 (n=264) | 1.22 (0.86, 1.73) | 0.3 | 1.17 (0.82, 1.67) | 0.4 | 1.18 (0.81, 1.71) | 0.4 | 0.99 (0.67, 1.46) | 0.9 |
| 30 to <40 (n=209) | 1.00 (Reference) | 1.00 (Reference) | 1.00 (Reference) | 1.00 (Reference) | ||||
| ≥40 (n=81) | 0.65 (0.35, 1.21) | 0.17 | 0.94 (0.50, 1.78) | 0.9 | 0.90 (0.47, 1.72) | 0.7 | 0.99 (0.51, 1.91) | 0.9 |
Case-mix variables include age, gender, race/ethnicity, diabetes, dialysis vintage, insurance (Medicare), marital status, Modified Charlson comorbidity score, dialysis dose (Kt/V), and kidney residual urine (KRU)
MICS variables include albumin, Log erythropoietin dose, creatinine, hemoglobin, phosphorus, total iron binding capacity, normalized protein catabolic rate (nPCR), bicarbonate, calcium, Log ferritin, white blood count (WBC), lymphocyte percent, body mass index, Log vitamin D dose
Full model consist of case-mix variables, MICS and three inflammatory markers: C-reactive protein, Interleukin-6, Tumor necrosis factor-α Cox proportional hazard model was used to calculate unadjusted and adjusted hazard ratio of mortality.
The interaction between serum albumin and transthyretin was not statistically significant in any of the above models (p>0.20)
To compare mortality predictability of serum albumin and transthyretin with each other, we performed ROC curve analyses. As shown in Figure 5, the mortality-predictability of serum albumin appeared superior to transthyretin in unadjusted models (areas under the curve [AUC]=0.66 vs. 0.59, p=0.004). However, Cox models including case-mix variables in addition to albumin or transthyretin showed similar AUCs (AUC=0.79 vs. 0.79, p =0.9), indicating that the unadjusted prognostic superiority of serum albumin was contributed significantly by patients’ demographics, whereas this was less so for serum transthyretin.
Figure 5.
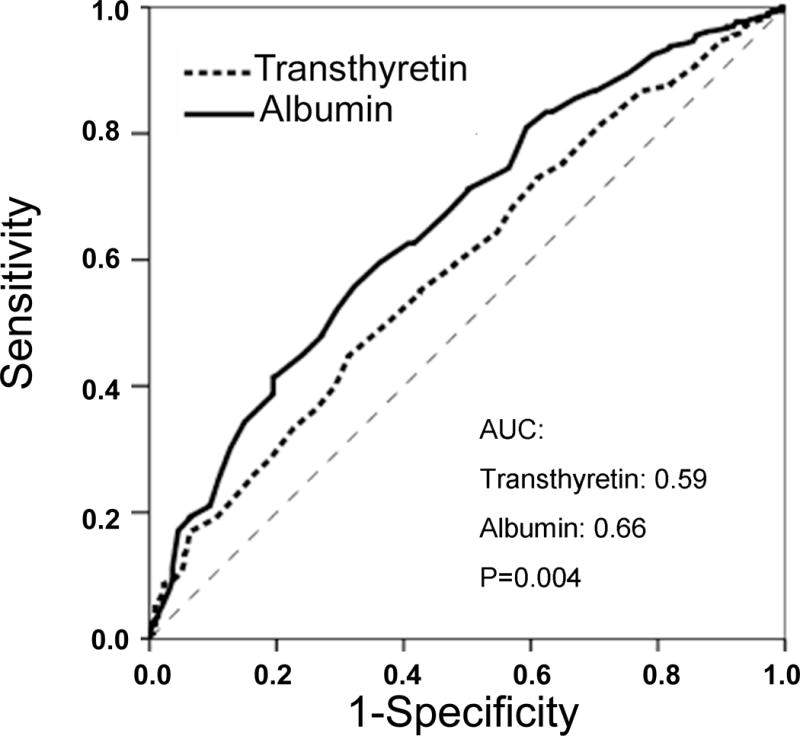

Receiver operating characteristic (ROC) curves of probabilities obtained from hazard regression models of serum albumin and transthyretin as independent variables and all-cause mortality as dependent (reference) variable in unadjusted (upper panel) and case-mix adjusted (lower panel) formats. Larger area under the curve (AUC) indicates higher prognostic value.
In order to examine whether longitudinal changes in serum transthyretin over time affected survival in MHD patients whose serum transthyretin was re-measured after 6 months (n=566), the magnitude and direction of change in serum transthyretin concentrations were calculated. Figure 6 shows the cubic splines graphs for the associations between changes in serum transthyretin and mortality in the 5-year cohort of 566 MHD patients. A consistent trend was noticed in that a fall in serum transthyretin was associated with worsening death risk whereas a rise in serum transthyretin showed a tendency towards greater survival, at least in the least adjusted models. Table 4 shows the hazard ratios of the a priori selected groups of transthyretin change. Patients whose serum transthyretin fell greater than 10 mg/dL over the first 6 months of observation had a 78% increased death risk ratio compared to those with stable transthyretin values. Additional analyses to model the continuous values of change in transthyretin over 6 months showed that in those with a baseline serum transthyretin between 20 to 40 mg/dL (73% of the patients), a drop by 10 mg/dL was associated with 37% increase in death risk (HR: 1.37, 95% CI: 1.02, 1.85, p=0.03) independent of baseline markers of MICS, serum albumin and inflammatory markers (see Table 4).
Figure 6.


Mortality predictability of changes in serum transthyretin during a 6-month period in 566 maintenance hemodialysis patients (Oct 2001 – Jan 2007)
Panel a. Adjusted for baseline transthyretin
Panel b. Fully adjusted for baseline transthyretin plus case-mix, MICS, and inflammatory variables
Case-mix variables: age, gender, race/ethnicity, diabetes mellitus, dialysis vintage, primary insurance, marital status, Charlson co-morbidity score, dialysis dose (Kt/V), and kidney residual urine (KRU)
MICS variables: albumin, erythropoietin dose, creatinine, hemoglobin, phosphorus, total iron binding capacity (TIBC), normalized protein catabolic rate (nPCR), bicarbonate, calcium, ferritin, WBC, lymphocyte percentage, body mass index, and vitamin D dose
Inflammatory variables: C-reactive protein, Interleukin-6, Tumor necrosis factor-α
Table 4.
Hazard ratios (HR) and 95% confidence interval (CI) of 5-year mortality according to the three a priori selected groups of change in serum transthyretin (upper rows) and according to the continuous measure of change in serum transthyretin (lower rows) in 566 maintenance hemodialysis patients (Oct. 2001 to Jan 2007).
| Adjusted for baseline serum transthyretin | Baseline serum transthyretin + Case-mix1 adjusted | Baseline serum transthyretin + Case-mix + MICS2 adjusted | Baseline serum transthyretin + Case-mix + MICS + inflammation adjusted (Full model)3 | |||||
|---|---|---|---|---|---|---|---|---|
|
| ||||||||
| HR (95% CI) | P | HR (95% CI) | P | HR (95% CI) | P | HR (95% CI) | P | |
| Categories of change in Transthyretin (mg/dl) | ||||||||
|
|
||||||||
| < −10 (n=72) | 1.68 (1.00, 2.84) | 0.05 | 1.63 (0.97, 2.77) | 0.07 | 1.83 (1.06, 3.17) | 0.03 | 1.78 (0.99, 3.21) | 0.05 |
| −10 to <+10 (n=406) | 1.0 (Reference) | 1.0 (Reference) | 1.0 (Reference) | 1.0 (Reference) | ||||
| ≥ +10 (n=88) | 0.66 (0.40, 1.09) | 0.10 | 0.96 (0.57, 1.61) | 0.8 | 1.11 (0.64, 1.93) | 0.71 | 1.10 (0.63, 1.93) | 0.7 |
|
| ||||||||
| Continuous change (each 10 mg/dL drop in transthyretin) | ||||||||
| All pts (n=566) | 1.46 (1.19, 1.79) | 0.001 | 1.29 (1.03–1.62) | 0.02 | 1.26 (0.99, 1.59) | 0.05 | 1.23 (0.97, 1.57) | 0.09 |
| Baseline transthyretin between 20 to 40 mg/dL (n=412) | 1.45 (1.12, 1.86) | 0.004 | 1.34 (1.01, 1.76) | 0.04 | 1.41 (1.06, 1.88) | 0.09 | 1.37 (1.02, 1.85) | 0.03 |
Case-mix variables include age, gender, race/ethnicity, diabetes, dialysis vintage, insurance (medicare), marital status, Charlson comorbidity score, dialysis dose (Kt/V), and kidney residual urine (KRU)
MICS variables include albumin, Log erythropoietin dose, creatinine, hemoglobin, phosphorus, total iron binding capacity, normalized protein catabolic rate (nPCR), bicarbonate, calcium, Log ferritin, white blood count (WBC), lymphocyte percent, body mass index, Log vitamin D dose
Full model consist of case-mix variables, MICS, and three inflammatory markers: C-reactive protein, Interleukin-6, Tumor necrosis factor-α
Cox proportional hazard model was used to calculate unadjusted and adjusted hazard ratio of mortality.
Discussion
In 798 MHD patients who participated in a prospective 5-year study in Southern California, we found that patients with the highest serum transthyretin concentrations (above 40 mg/dL) had higher serum albumin and creatinine levels, greater mid-arm muscle circumference and lower total body fat percentage, and tended to have higher dietary protein and calorie intake. Serum transthyretin was somewhat equally correlated with both markers of nutritional status and inflammation without any statically significant interaction between dietary protein intake and inflammatory cytokine. Standardized measures of quality of life indicated better physical health, physical function and functionality in MHD patients with higher serum transthyretin levels. A consistent trend of poor survival was noticed with low serum transthyretin levels even among normoalbuminemic patients, although these associations were weaker after controlling for inflammatory markers including serum CRP, TNF-α and IL-6. Comparing case-mix adjusted death hazard models, both serum albumin and transthyretin concentrations showed similar prognostic values of predicting mortality. A fall in serum transthyretin beyond 10 mg/dL over 6 months was associated with worsening death risk in the subsequent years. These findings underscore the clinically relevant associations of serum transthyretin with quality of life and survival and indicates that it is a useful marker to risk-stratify even normoalbuminemic patients and that longitudinal changes over time in serum transthyretin can modify the risk of death in MHD patients independent of baseline measures of nutritional status or inflammation.
Individuals with CKD have an exceptionally high mortality rate and a high burden of cardiovascular disease.(26) About one of every five of the 400,000 MHD patients in the United States dies every year.(27) Even though half of all these deaths are attributed to cardiovascular disease,(27) measures of protein-energy wasting (PEW) and not traditional cardiovascular risk factors are the strongest predictors of mortality in MHD patients.(2) The confounding effects of PEW, also known as the MICS, on associations between traditional cardiovascular risk factors and clinical outcome is so strong that these associations appear paradoxically inverted.(28, 29) Hence, a low, rather than a high, body mass index or serum cholesterol level are paradoxically associated with increased mortality in MHD patients.(28–32) This phenomenon, known as reverse epidemiology or altered risk factor patterns,(33) is also observed in chronic heart failure and other chronic disease states with wasting syndrome (34, 35) and underscores the striking role that nutritional/inflammatory status plays in short-term survival of populations with chronic disease states.(34) Therefore, reliable markers of MICS with stronger and more robust associations with morbidity and mortality in MHD patients are needed, so that patients at risk can better be identified for focused nutritional interventions.
Transthyretin, also known as prealbumin, is a 54 kilo-dalton protein synthesized primarily by the liver.(7) Its main function is to transport thyroxine and indirectly vitamin A, as it serves as a carrier protein for retinol binding protein. (9) A rise or fall in protein and energy intake leads to parallel changes in circulating transthyretin concentrations.(36) Similar to serum albumin, transthyretin, too, is considered a negative acute phase reactant, since its serum levels may decrease in inflammation.(37) In contrast to serum albumin, however, transthyretin’s half-life is relatively short, i.e., 2 to 3 days.(36, 37) Hence, it may be a more sensitive indicator of nutritional status than either serum albumin or transferrin according to the reports of Avram et al, (31) Sreedhara et al,(38) Mittman et al,(39) Goldwasser et al,(40) and Chertow et al. (7, 8) In our current study, even though there was no superiority of serum transthyretin to albumin in predicting mortality, we found that among normoalbuminemic patients a low serum transthyretin was still associated with increased death risk. More interestingly, a drop in serum transthyretin by 10 mg/dL or more over 6 months was a robust predictor of increased mortality independent of other baseline nutritional or inflammatory markers. To the best of our knowledge, our study is the first one to examine the effect of changes in circulating transthyretin over time on mortality and the only study with concomitant measures of nutritional and inflammatory markers and body composition esp. after controlling for several explicit markers of inflammation and cytokines, i.e., CRP, IL-6 and TNF-a.
Another interesting and novel finding in our study was the inverse association between serum transthyretin and the percentage of total body fat, in that in patients with higher transthyretin there was a lower, rather than higher, proportion of body fat (Table 1), whereas the mid-arm muscle circumference, lean body mass, protein intake (nPNA) and serum concentrations of creatinine and albumin were all higher. The latter is in contradistinction to serum albumin, for which we recently showed a positive association with body fat, which per se was paradoxically associated with greater survival. Thus, unlike serum albumin,(19) serum transthyretin appears to act in the opposite direction of serum albumin, at least with regard to its association with body fat. Furthermore, our study showed an association of transthyretin with components of health related quality of life, which per se is a predictor of survival in MHD patients.(14, 41) We found that this association was stronger for several physical health components of the SF-36 as compared to mental health components. Additional studies will be necessary to examine the clinical implications of these findings.
Our study also examined the implication of longitudinal changes in serum transthyretin over time. Patients whose transthyretin decreased after 6 months had a higher death risk subsequently, compared to those with stable serum transthyretin, especially among patients with a baseline serum transthyretin between 20 and 40 mg/ml (Table 4). Although the opposite association, i.e., between a rise in transthyretin and improved survival was not evident except for a trend in the spline graphs (Figure 6), these general findings may imply that monitoring changes in serum transthyretin can help identify patients at risk, who may benefit from nutritional interventions, especially if the transthyretin fall is greater than 10 mg/dL over 6 months. Relevant to our findings, Vehe et al (42) showed that nutritional support for 4 weeks led to a significant rise in serum transthyretin from 15.3±7.8 to 24.6±19.0 mg/dL in 14 CKD patients (P < 0.01). Although Mortelmans et al (43) did not show a significant increase in serum transthyretin in 16 MHD patients given intradialytic parenteral nutrition (IDPN) over a nine-month period, a recent randomized controlled trial in 186 malnourished MHD patients who also received oral nutritional supplements with or without one year of IDPN showed that an increase in transthyretin of >30 mg/L within 3 months independently predicted a 54% decrease in 2-year mortality and improved general well-being.(2)
A potential limitation of the present study is a selection bias during enrollment. However, since the mortality in our cohort was less than the base population, it might be argued that a selection bias with such a direction generally would lead to a bias toward the null hypothesis, so without this bias, our positive results might have been even stronger. The strengths of our study include the sample size, which was moderately large, the comprehensive clinical and laboratory evaluations with repeated measures of serum transthyretin, concomitant assessment of quality of life and body composition measures, and detailed evaluation of comorbid states by study physicians at baseline. Unlike previous cohorts that have been studied, ours has been extensively characterized for markers of inflammation and nutritional status, including direct total body fat measurements. The availability of these measures allowed us to demonstrate that transthyretin was able to predict mortality risk independent of influences from other known inflammatory markers or comorbid states in this group of MHD patients. Another strength of this cohort is that the subjects were selected randomly without having any prior knowledge of their inflammatory status. Finally, the same blood specimens that were utilized to measure markers of MICS and cytokines were also used for the transthyretin measurements.
In conclusion, we found that serum transthyretin correlated with several surrogates of body composition, inflammation and health related quality of life in MHD patients and that a low baseline serum transthyretin even in normoalbuminemic patients was independently associated with a trend towards increased death risk. Most importantly, a decline in serum transthyretin over 6 months was an independent death predictor. Understanding the role of transthyretin as an indicator of outcome in the MHD population may lead to more useful strategies to identify patients at risk for protein-energy wasting (PEW) and to the development of focused nutritional interventions to improve nutritional status and, hence, survival in almost half million dialysis patients and the many millions of individuals with CKD in the United States and as well as throughout the world. Randomized controlled trials are needed to examine the clinical implications of our findings.
Acknowledgments
Parts of this study were presented in form of abstracts, poster and oral presentations during the annual meetings of the National Kidney Foundation, April 4–8, 2008, Dallas, TX and Clinical Nutrition Week, February 10–13, 2008, Chicago, IL. The authors are thankful to Ms. Stephanie Griffith, at Harbor-UCLA GCRC Core Laboratories for the management of blood samples and measuring inflammatory markers.
Funding Sources: This study was supported by the National Institutes of Health, National Institute of Diabetes, Digestive and Kidney Disease grants K23DK61162 and R21DK078012, investigator initiated research grant from Watson and DaVita, and a research grant from the philanthropist Mr. Harold Simmons (all for KKZ), and the General Clinical Research Center (GCRC) grant M01RR00425 from the National Centers for Research Resources, National Institutes of Health.
Footnotes
Contribution of Authors: Dr. Rambod: Conduct and analyses of the study data, writing, reviewing and approving the manuscript. Drs. Kopple, Dezfuli, Bross and Kovesdy: Analysis and interpretation of the data, reviewing, amending and approving of the manuscript. Dr. Kalantar-Zadeh: Design, conduct and analysis of the NIED study, PI of the grants, and writing of the manuscript.
Potential Conflict of Interests: Drs. Kopple and Kalantar-Zadeh have received honoraria and/or research grants from NovoNordisk, the manufacturer of growth hormone (Norditropin®), which is currently tested in a Phase III trial in malnourished dialysis patients. Dr. Kalantar-Zadeh has received honoraria and/or research grants from Abbott Nutrition, the manufacturer of Nepro ™ and Oxepa™, and Nutripletion and Pentec, providers of intradialytic parenteral nutrition. None of the other authors has a conflict of interest to disclose.
References
- 1.National Kidney Foundation. KDOQI clinical practice guidelines and clinical practice recommendations for anemia in chornic kidney disease. Am J Kidney Dis. 2006;47:S16–S145. doi: 10.1053/j.ajkd.2006.03.011. [DOI] [PubMed] [Google Scholar]
- 2.Fouque D, Kalantar-Zadeh K, Kopple J, et al. A proposed nomenclature and diagnostic criteria for protein-energy wasting in acute and chronic kidney disease. Kidney Int. 2008;73:391–8. doi: 10.1038/sj.ki.5002585. [DOI] [PubMed] [Google Scholar]
- 3.Kalantar-Zadeh K. Recent advances in understanding the malnutrition-inflammation-cachexia syndrome in chronic kidney disease patients: What is next? Semin Dial. 2005;18:365–9. doi: 10.1111/j.1525-139X.2005.00074.x. [DOI] [PubMed] [Google Scholar]
- 4.Pupim LB, Caglar K, Hakim RM, Shyr Y, Ikizler TA. Uremic malnutrition is a predictor of death independent of inflammatory status. Kidney Int. 2004;66:2054–60. doi: 10.1111/j.1523-1755.2004.00978.x. [DOI] [PubMed] [Google Scholar]
- 5.Lacson E, Jr, Ikizler TA, Lazarus JM, Teng M, Hakim RM. Potential impact of nutritional intervention on end-stage renal disease hospitalization, death, and treatment costs. J Ren Nutr. 2007;17:363–71. doi: 10.1053/j.jrn.2007.08.009. [DOI] [PubMed] [Google Scholar]
- 6.Kalantar-Zadeh K, Kilpatrick RD, Kuwae N, et al. Revisiting mortality predictability of serum albumin in the dialysis population: time dependency, longitudinal changes and population-attributable fraction. Nephrol Dial Transplant. 2005;20:1880–8. doi: 10.1093/ndt/gfh941. [DOI] [PubMed] [Google Scholar]
- 7.Chertow GM, Ackert K, Lew NL, Lazarus JM, Lowrie EG. Prealbumin is as important as albumin in the nutritional assessment of hemodialysis patients. Kidney Int. 2000;58:2512–7. doi: 10.1046/j.1523-1755.2000.00435.x. [DOI] [PubMed] [Google Scholar]
- 8.Chertow GM, Goldstein-Fuchs DJ, Lazarus JM, Kaysen GA. Prealbumin, mortality, and cause-specific hospitalization in hemodialysis patients. Kidney Int. 2005;68:2794–800. doi: 10.1111/j.1523-1755.2005.00751.x. [DOI] [PubMed] [Google Scholar]
- 9.Kopple JD, Mehrotra R, Suppasyndh O, Kalantar-Zadeh K. Observations with regard to the National Kidney Foundation K/DOQI clinical practice guidelines concerning serum transthyretin in chronic renal failure. Clin Chem Lab Med. 2002;40:1308–12. doi: 10.1515/CCLM.2002.225. [DOI] [PubMed] [Google Scholar]
- 10.Kaysen GA. Effects of inflammation on plasma composition and endothelial structure and function. J Ren Nutr. 2005;15:94–8. doi: 10.1053/j.jrn.2004.09.021. [DOI] [PubMed] [Google Scholar]
- 11.Colman S, Bross R, Benner D, et al. The Nutritional and Inflammatory Evaluation in Dialysis patients (NIED) study: overview of the NIED study and the role of dietitians. J Ren Nutr. 2005;15:231–43. doi: 10.1053/j.jrn.2005.01.003. [DOI] [PubMed] [Google Scholar]
- 12.Mehrotra R, Kermah D, Fried L, et al. Chronic peritoneal dialysis in the United States: declining utilization despite improving outcomes. J Am Soc Nephrol. 2007;18:2781–8. doi: 10.1681/ASN.2006101130. [DOI] [PubMed] [Google Scholar]
- 13.Beddhu S, Bruns FJ, Saul M, Seddon P, Zeidel ML. A simple comorbidity scale predicts clinical outcomes and costs in dialysis patients. Am J Med. 2000;108:609–13. doi: 10.1016/s0002-9343(00)00371-5. [DOI] [PubMed] [Google Scholar]
- 14.Kalantar-Zadeh K, Kopple JD, Block G, Humphreys MH. Association among SF36 quality of life measures and nutrition, hospitalization, and mortality in hemodialysis. J Am Soc Nephrol. 2001;12:2797–806. doi: 10.1681/ASN.V12122797. [DOI] [PubMed] [Google Scholar]
- 15.Diaz-Buxo JA, Lowrie EG, Lew NL, Zhang H, Lazarus JM. Quality-of-life evaluation using Short Form 36: comparison in hemodialysis and peritoneal dialysis patients. Am J Kidney Dis. 2000;35:293–300. doi: 10.1016/s0272-6386(00)70339-8. [DOI] [PubMed] [Google Scholar]
- 16.Kalantar-Zadeh K, Kleiner M, Dunne E, et al. Total iron-binding capacity-estimated transferrin correlates with the nutritional subjective global assessment in hemodialysis patients. Am J Kidney Dis. 1998;31:263–72. doi: 10.1053/ajkd.1998.v31.pm9469497. [DOI] [PubMed] [Google Scholar]
- 17.Williams AJ, McArley A. Body composition, treatment time, and outcome in hemodialysis patients. J Ren Nutr. 1999;9:157–62. doi: 10.1016/s1051-2276(99)90056-0. [DOI] [PubMed] [Google Scholar]
- 18.Kalantar-Zadeh K, Block G, Kelly MP, Schroepfer C, Rodriguez RA, Humphreys MH. Near infra-red interactance for longitudinal assessment of nutrition in dialysis patients. J Ren Nutr. 2001;11:23–31. doi: 10.1016/s1051-2276(01)91938-7. [DOI] [PubMed] [Google Scholar]
- 19.Kalantar-Zadeh K, Kuwae N, Wu DY, et al. Associations of body fat and its changes over time with quality of life and prospective mortality in hemodialysis patients. Am J Clin Nutr. 2006;83:202–10. doi: 10.1093/ajcn/83.2.202. [DOI] [PubMed] [Google Scholar]
- 20.Erbagci AB, Tarakcioglu M, Aksoy M, et al. Diagnostic value of CRP and Lp(a) in coronary heart disease. Acta Cardiol. 2002;57:197–204. doi: 10.2143/AC.57.3.2005389. [DOI] [PubMed] [Google Scholar]
- 21.Ridker PM, Rifai N, Rose L, Buring JE, Cook NR. Comparison of C-reactive protein and low-density lipoprotein cholesterol levels in the prediction of first cardiovascular events. N Engl J Med. 2002;347:1557–65. doi: 10.1056/NEJMoa021993. [DOI] [PubMed] [Google Scholar]
- 22.Beutler B, Cerami A. The biology of cachectin/TNF–a primary mediator of the host response. Annu Rev Immunol. 1989;7:625–55. doi: 10.1146/annurev.iy.07.040189.003205. [DOI] [PubMed] [Google Scholar]
- 23.Pecoits-Filho R, Barany P, Lindholm B, Heimburger O, Stenvinkel P. Interleukin-6 is an independent predictor of mortality in patients starting dialysis treatment. Nephrol Dial Transplant. 2002;17:1684–8. doi: 10.1093/ndt/17.9.1684. [DOI] [PubMed] [Google Scholar]
- 24.Durrleman S, Simon R. Flexible regression models with cubic splines. Stat Med. 1989;8:551–561. doi: 10.1002/sim.4780080504. [DOI] [PubMed] [Google Scholar]
- 25.Pepe MS, Janes H, Longton G, Leisenring W, Newcomb P. Limitations of the odds ratio in gauging the performance of a diagnostic, prognostic, or screening marker. Am J Epidemiol. 2004;159:882–90. doi: 10.1093/aje/kwh101. [DOI] [PubMed] [Google Scholar]
- 26.Go AS, Chertow GM, Fan D, McCulloch CE, Hsu CY. Chronic kidney disease and the risks of death, cardiovascular events, and hospitalization. N Engl J Med. 2004;351:1296–305. doi: 10.1056/NEJMoa041031. [DOI] [PubMed] [Google Scholar]
- 27.United States Renal Data System. Excerpts from the USRDS 2005 Annual Data Report: Atlas of End-Stage Renal Disease in the United States, National Institutes of Health, National Institute of Diabetes and Digestive and Kidney Diseases. Am J Kid Dis. 2006;47(Supplement 1):1–286. [Google Scholar]
- 28.Kilpatrick RD, McAllister CJ, Kovesdy CP, Derose SF, Kopple JD, Kalantar-Zadeh K. Association between serum lipids and survival in hemodialysis patients and impact of race. J Am Soc Nephrol. 2007;18:293–303. doi: 10.1681/ASN.2006070795. [DOI] [PubMed] [Google Scholar]
- 29.Kalantar-Zadeh K, Abbott KC, Salahudeen AK, Kilpatrick RD, Horwich TB. Survival advantages of obesity in dialysis patients. Am J Clin Nutr. 2005;81:543–54. doi: 10.1093/ajcn/81.3.543. [DOI] [PubMed] [Google Scholar]
- 30.Nakai S, Akiba T, Kazama J, et al. Effects of serum calcium, phosphorous, and intact parathyroid hormone levels on survival in chronic hemodialysis patients in Japan. Ther Apher Dial. 2008;12:49–54. doi: 10.1111/j.1744-9987.2007.00540.x. [DOI] [PubMed] [Google Scholar]
- 31.Kalantar-Zadeh K, Ikizler TA, Block G, Avram MM, Kopple JD. Malnutrition-inflammation complex syndrome in dialysis patients: causes and consequences. Am J Kidney Dis. 2003;42:864–81. doi: 10.1016/j.ajkd.2003.07.016. [DOI] [PubMed] [Google Scholar]
- 32.McClellan WM, Chertow GM. Beyond Framingham: cardiovascular risk profiling in ESRD. J Am Soc Nephrol. 2005;16:1539–41. doi: 10.1681/ASN.2005040415. [DOI] [PubMed] [Google Scholar]
- 33.Kalantar-Zadeh K. What is so bad about reverse epidemiology anyway? Semin Dial. 2007;20:593–601. doi: 10.1111/j.1525-139X.2007.00360.x. [DOI] [PubMed] [Google Scholar]
- 34.Kalantar-Zadeh K, Abbott KC, Kronenberg F, Anker SD, Horwich TB, Fonarow GC. Epidemiology of dialysis patients and heart failure patients. Semin Nephrol. 2006;26:118–33. doi: 10.1016/j.semnephrol.2005.09.005. [DOI] [PubMed] [Google Scholar]
- 35.Kalantar-Zadeh K, Horwich TB, Oreopoulos A, et al. Risk factor paradox in wasting diseases. Curr Opin Clin Nutr Metab Care. 2007;10:433–42. doi: 10.1097/MCO.0b013e3281a30594. [DOI] [PubMed] [Google Scholar]
- 36.Spiekerman AM. Proteins used in nutritional assessment. Clin Lab Med. 1993;13:353–69. [PubMed] [Google Scholar]
- 37.Myron Johnson A, Merlini G, Sheldon J, Ichihara K. Clinical indications for plasma protein assays: transthyretin (prealbumin) in inflammation and malnutrition. Clin Chem Lab Med. 2007;45:419–26. doi: 10.1515/CCLM.2007.051. [DOI] [PubMed] [Google Scholar]
- 38.Sreedhara R, Avram MM, Blanco M, Batish R, Avram MM, Mittman N. Prealbumin is the best nutritional predictor of survival in hemodialysis and peritoneal dialysis. Am J Kidney Dis. 1996;28:937–42. doi: 10.1016/s0272-6386(96)90398-4. [DOI] [PubMed] [Google Scholar]
- 39.Mittman N, Avram MM, Oo KK, Chattopadhyay J. Serum prealbumin predicts survival in hemodialysis and peritoneal dialysis: 10 years of prospective observation. Am J Kidney Dis. 2001;38:1358–64. doi: 10.1053/ajkd.2001.29256. [DOI] [PubMed] [Google Scholar]
- 40.Goldwasser P, Michel MA, Collier J, et al. Prealbumin and lipoprotein(a) in hemodialysis: relationships with patient and vascular access survival. Am J Kidney Dis. 1993;22:215–25. doi: 10.1016/s0272-6386(12)70189-0. [DOI] [PubMed] [Google Scholar]
- 41.Kalantar-Zadeh K, Unruh M. Health related quality of life in patients with chronic kidney disease. Int Urol Nephrol. 2005;37:367–78. doi: 10.1007/s11255-004-0012-4. [DOI] [PubMed] [Google Scholar]
- 42.Vehe KL, Brown RO, Moore LW, Acchiardo SR, Luther RW. The efficacy of nutrition support in infected patients with chronic renal failure. Pharmacotherapy. 1991;11:303–7. [PubMed] [Google Scholar]
- 43.Mortelmans AK, Duym P, Vandenbroucke J, et al. Intradialytic parenteral nutrition in malnourished hemodialysis patients: a prospective long-term study. JPEN J Parenter Enteral Nutr. 1999;23:90–5. doi: 10.1177/014860719902300290. [DOI] [PubMed] [Google Scholar]