Abstract
Hexafluoroisopropanol (HFIP) has been widely used as an acidic modifier for mobile phases for liquid chromatography-mass spectrometry (LC-MS) analysis of oligonucleotides ever since the first report of its use for this purpose. This is not surprising considering the exceptional performance of HFIP compared to carboxylic acids which cause significant MS signal suppression in electrospray ionization. However, we have found that other fluorinated alcohols can also be utilized for mobile phase preparation and the choice of optimal fluorinated alcohol is determined by the ion-pairing (IP) agent. While HFIP is a very good choice to be used alongside less hydrophobic IP agents, other fluorinated alcohols such as 1,1,1,3,3,3-hexafluoro-2-methyl-2-propanol (HFMIP) can significantly outperform HFIP when used with more hydrophobic IP agents. We also found that more acidic fluorinated alcohols assist with the transfer of oligonucleotides with secondary structure (e.g. folded strands and hairpins) into the gas phase.
Introduction
Since its invention, electrospray ionization (ESI) has evolved as a major technique for the analysis of biomolecules. It allows for seamless mass spectrometric (MS) study of large biomolecules, such as oligonucleotides, following their separation with liquid chromatography (LC) [1, 2]. However, the choice of optimal solvent systems has proven to be absolutely essential for the successful ionization of analytes by ESI. Positive ion ESI, particularly for peptides and proteins, has shifted toward the use of protonated solutions of acetonitrile/water or methanol/water. These protonated solvent clusters are created by reaction of the solvent with a weak acid, e.g. acetic or formic acid [3–6]. Analogous to this concept, studies of ESI-MS in the negative ion mode were initially performed by adding ammonium hydroxide to aqueous solutions of acidic analytes [7–9]. However, negative ion ESI with basic solutions can be unfavorable as stable anions are not formed to any appreciable extent [10]. In fact, several studies have shown that ESI-MS in negative ion mode with volatile bases resulted in poorer detection limits and reduced stability of the electrospray plume [11–13]. Although it might seem counterintuitive, weak acids are also very favorable modifiers for negative-ion ESI because they can create a very stable deprotonated anion pool which supports the negative charging process [10, 14].
Oligonucleotides are primarily ionized via negative-ion ESI. Considering that reversed phase LC retention of these molecules is only possible with the help of basic alkylamine ion-pairing agents, acidic modifiers play a dual role in this particular case: in addition to carrying excess negative charge, they also neutralize the solution pH. Various carboxylic acids such as acetate, bicarbonate and formate have been used for this purpose [15–17] but all of them caused significant electrospray MS signal suppression. The introduction of hexafluoroisopropanol (HFIP) as an acid modifier by Apffel et al. [18, 19] was a landmark achievement in the evolution of solvent systems for LC-MS of oligonucleotides. HFIP can adjust the solution pH and at the same time enhance MS signal intensity of oligonucleotides which explains why it has been used in every LC-MS study since its introduction. There have been several recent studies into alternative alkylamines as ion pairing reagents [20–23]. However, other fluorinated alcohols have never been thoroughly investigated as potential substitutes for HFIP. Cech and Enke [10] briefly mentioned the use of trifluoroethanol (TFE) instead of HFIP for the analysis of oligonucleotides, but the outcome of their experiments was never discussed. To our knowledge, the only systematic comparison of TFE and HFIP for the ESI of oligonucleotides was reported by Chen et al. [24]. They showed that while increasing concentrations of HFIP enhanced the oligonucleotide MS signal intensity, higher concentrations of TFE had the opposite effect and caused signal suppression. However, their study was confined to only one alternative alcohol and one oligonucleotide molecule (DNA) and it was performed in the absence of ion pairing agents. Here, we present a comprehensive study of the effect of utilizing different fluorinated alcohols as ESI solvent modifiers for several classes of oligonucleotides in the presence and absence of various ion pairing reagents in order to provide a more detailed guidance for optimizing the mobile phase composition for LC-MS analysis of oligonucleotides.
Materials and methods
Chemicals and reagents
The ion pairing agents N,N-dimethylbutylamine, octylamine, tripropylamine, N,N-dimethylhexylamine, diisopropylamine, N-methyldibutylamine, propylamine, triethylamine, hexylamine, tributylamine, N,N-dimethylcyclohexylamine, N,N-diisopropylethylamine, tetramethylethylenediamine, dibutylamine, methyldibutylamine and 1,8-diazabicyclo[5.4.0]undec-7-ene (DBU), as well as bovine insulin and the fluorinated alcohols hexafluoroisopropanol, pentafluoropropanol, 1,1,1,3,3,3-hexafluoro-2-methyl-2-propanol, trifluoroethanol and nonafluoro tertiary butyl alcohol were purchased from Sigma-Aldrich (St. Louis, MO). Nuclease-free water was acquired from Life Technologies (Carlsbad, CA) and LC-MS grade methanol, acetonitrile, water and formic acid were purchased from Sigma-Aldrich, as well. The 24-mer ssDNA strand (5’-ATCGATCGATCGATCGATCGATCG-3’) and two RNA strands with the sequences of miR-451 (AAACCGUUACCAUUACUGAGUU) and miR-30c (UGUAAACAUCCUACACUCUCAGC) were purchased from Eurogentec (Seraing, Belgium). The 33mer phosphorothioate with the sequence (UAUUCAAGUUACACUCAAGAAGGAAUAAUUUCU) and its 5’(n-1) truncation were provided by ProQR (Leiden, Netherlands) and were fully modified with 2’-O-methyl groups. DNA Lobind microcentrifuge tubes were purchased from Eppendorf (Hauppauge, NY).
Preparation of working solutions for direct infusion and LC-MS experiments
For direct infusion experiments, precise amounts of various IP agents and fluorinated alcohols were added to aliquots of 20 µg/mL solutions of each oligonucleotide in 50:50 methanol/water to the final concentration of 15 mM for the IP agent and 25 mM for the alcohol, except for NFTB which was used at the concentration of 2 mM. The samples used during LC-MS analysis were a mixture of the above-mentioned phosphorothioate and its n-1 truncation from the 5’ side, both at 50 µg/mL and prepared in nuclease-free water. Solutions of intact insulin, insulin chain A and insulin chain B were prepared in 50:50 acetonitrile/water at the concentration of 20 µg/mL.
Instrumental conditions and software
Direct infusion experiments were made on a Waters (Milford, MA) Synapt G2 HDMS quadrupole time-of-flight hybrid mass spectrometer in the negative ion electrospray ionization mode via the instrument’s built-in fluidics system. LC-MS experiments were performed using a Waters Acquity UPLC system coupled to the same mass spectrometer (Waters Synapt G2). The TOF-MS tuning parameters for all configurations were as follows: capillary voltage −2.0 kV, cone voltage 25 V, extraction cone voltage 2 V, source temperature 125 °C, desolvation temperature 450 °C, cone gas 0 L/h and desolvation gas (nitrogen) 1000 L/h. The ion mobility experiments were performed at IMS gas (N2) flow of 100 mL/min and trap gas (Ar) flow of 2 mL/min, while the source and helium cell gas flows were set to 0 mL/min. IMS wave velocity was 450 m/s and IMS wave height was 18 V. For direct infusion, a flow rate of 50 µL/min was utilized and the data were collected in continuum full-scan MS mode with a 1 s scan time over the mass range from 500–3000 m/z. All measurements were performed in triplicate and base peak signal intensities were measured by combining 50 scans.
UPLC separation was performed at 60°C using a Waters Acquity UPLC OST C18 column (1.7 µm, 2.1×50 mm). Mobile phase A was 15 mM DMCHA and 25 mM HFIP (or HFMIP) in 10% methanol. Mobile phase B was 90% methanol. The flow rate was set at 1 mL/min and the injection volume at 15 µL. For DMCHA/HFIP mobile phase, a gradient from 20 to 25 percent B in 6 minutes was used during UPLC separation. In the case of DMCHA/HFMIP, the gradient was 12–17%, respectively.
Collision cross section (CCS) values were determined following the procedure of Ruotolo et al. [25]. A calibration curve was created by plotting CCS (Ω) versus the charge-corrected drift time values (t"D) for three calibrants: intact insulin with 3 and 4 negative charges (Ω = 654 Å2) [26], insulin chain A with two negative charges(Ω = 388 Å2) [27] and insulin chain B with two negative charges (Ω = 501 Å2) [26]. The resulting calibration plot that showed very good linearity (R2 > 0.99) was then used to convert drift time data for oligonucleotides to CCS measurements.
The UPLC and MS operation and data acquisition were performed using Waters MassLynx 4.1. IMS data were examined by Waters Driftscope v2.1. Statistical analyses and graphs were made in Microsoft Office Excel 2016 or GraphPad Prism 6. All pKa, surface area and distribution coefficient (log D) values were determined using the calculator plugins of MarvinSketch 14.7.14, 2014 (ChemAxon, http://www.chemaxon.com). Henry’s law constants were computed using HENRYWIN module of the US Environmental Protection Agency’s EPI suite v4.11. Hairpin structure prediction was carried out with OligoAnalyzer 3.1.
Results and Discussion
Our initial study was to determine which of 14 different alkylamine IP agents including N,N-dimethylbutylamine (DMBA), octylamine (OA), tripropylamine (TPA), N,N-dimethylhexylamine (DMHA), diisopropylamine (DIPA), N-methyldibutylamine (MDBA), propylamine (PA), triethylamine (TEA), hexylamine (HA), tributylamine (TBA), N,N-dimethylcyclohexylamine (DMCHA), N,N-diisopropylethylamine (DIEA), tetramethylethylenediamine (TMEDA) and 1,8-diazabicyclo[5.4.0]undec-7-ene (DBU) provided variable MS signal intensities for different classes of oligonucleotides. An interesting observation throughout these investigations (Supplemental figures S1 and S2) was the lower MS signal intensity of oligonucleotides in the absence of any ion pairing reagent compared to when IP reagents are present. There are two reasons for this phenomenon: IP agents can bring oligos to the surface of electrospray droplets with them as they move towards the surface. They also reduce cation adduction, resulting in an increase in the MS signal intensity of oligonuclaotides. Finally, four IP agents which provided variable, yet still high MS signal intensities for different types of oligonucleotides and possessed significantly different structural properties were chosen for the remaining studies. These IP agents were: DIEA, TEA, DMCHA and OA.
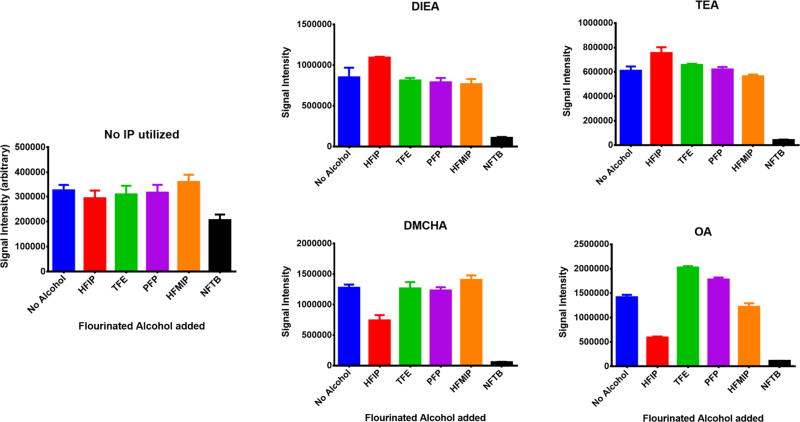
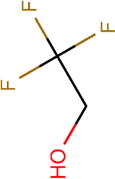
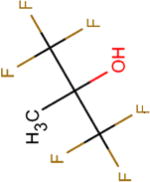
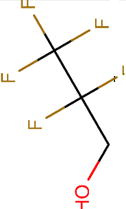
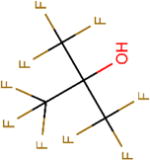
Next, phosphorothioate oligonucleotide solutions containing these four IP reagents were mixed with five different fluorinated alcohols hexafluoroisopropanol (HFIP), pentafluoropropanol (PFP), 1,1,1,3,3,3-hexafluoro-2-methyl-2-propanol (HFMIP), trifluoroethanol (TFE) and nonafluoro tertiary butyl alcohol (NFTB) and the differential effect of these alcohols on the electrospray MS signal intensity was recorded. As shown in figure 1 while HFIP has a better performance in the presence of ion-pairs DIEA and TEA, it clearly is not the best choice for use with either DMCHA or OA. In fact, the mixture of DMCHA/HFMIP provided stronger signal intensity relative to DIEA/HFIP or TEA/HFIP. Therefore, using alternative fluorinated alcohols can help significantly in lowering the MS detection limit of this phosphorothioate.
Figure 1. The effect of different fluorinated alcohols on MS signal intensity of a 33-mer phosphorothioate in the presence of four different alkylamine IP agents.
It can be observed that in the absence of IP agents, the addition of these alcohols does not have a significant effect on electrospray MS signal intensity. The only exception is NFTB that causes considerable MS signal suppression. It was exactly because of this suppression effect that NFTB was only used to a final concentration of 2 mM while other alcohols were used at a concentration of 25 mM. It is also clear that in the case of DMCHA and OA, other fluorinated alcohols (with the exception of NFTB) show a better performance than HFIP.
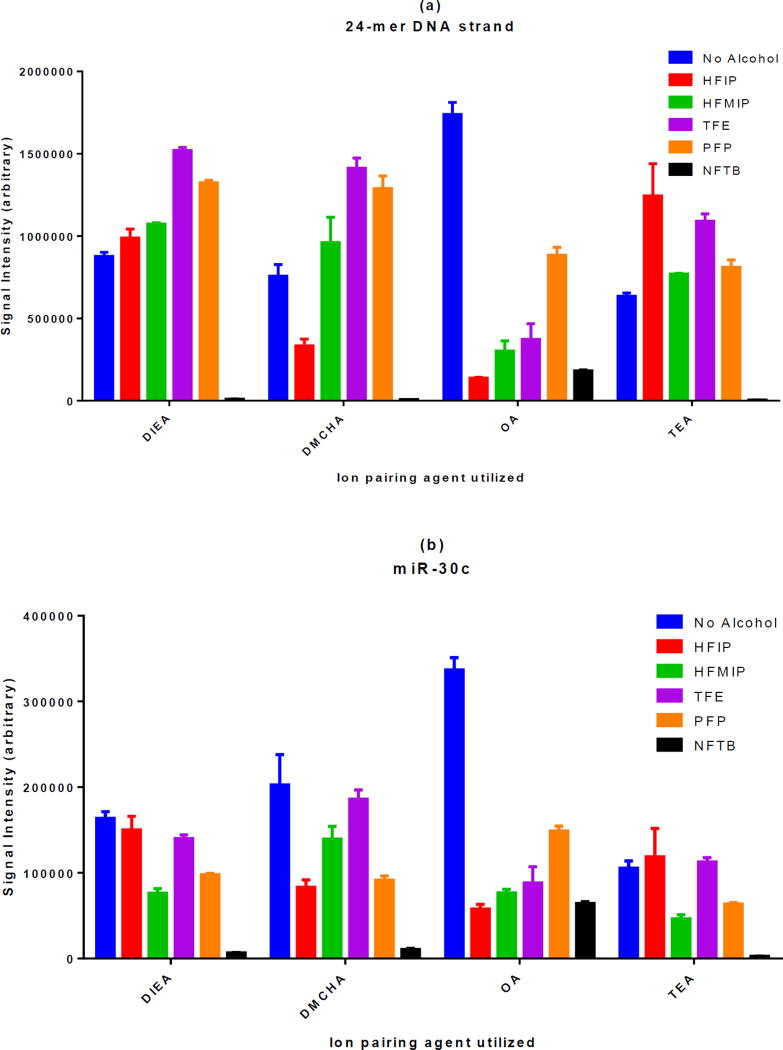
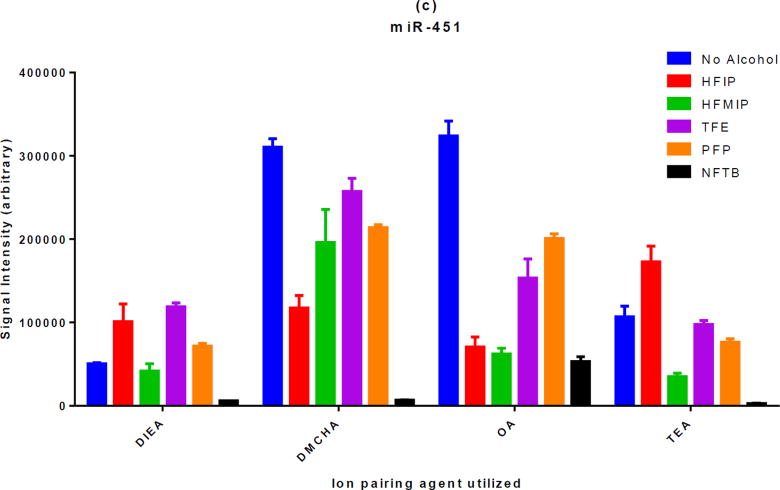
It has been reported previously that different types of oligonucleotides (e.g. phosphorothioate vs. DNA or RNA) optimize with different IP agents and that the hydrophobicity of the oligonucleotide molecule has been suggested as an explanation for this behavior [21]. So it was reasonable to assume that the same principle may apply to fluorinated alcohols and different classes of oligonucleotides would show differential preference with respect to these alcohols. In order to elucidate this point, the same experiment was repeated with a DNA and two RNA strands. The results are presented in figure 2. While the behavior of the two RNA strands (with different sequences) were almost the same, some differences were observed among the three classes of oligonucleotides examined. For example, for phosphorothioate and RNA molecules, DIEA generated the highest MS signal intensity with HFIP while the combination of DIEA and TFE was the best for DNA. However, the overall pattern remained largely similar among the three classes of oligonucleotides. Namely, while HFIP showed good performance alongside DIEA and TEA, it performed poorly when utilized with DMCHA or OA.
Figure 2. The effect of different fluorinated alcohols on MS signal intensity of DNA and RNA molecules in the presence of four different alkylamine IP agents.
One DNA molecule (a) and two RNA molecules (b and c) were investigated in the presence of different fluorinated alcohols. While some differences can be observed, the overall response pattern of various classes of oligonucleotides to different combinations of IP agents and fluorinated alcohols remains very similar.
Chen et al. [24] have previously reported superior performance with HFIP compared to TFE. Our results with DIEA and TEA were consistent with their observations. However, they never examined the IP agents DMCHA or OA for their study which explains why they did not observe the opposite effect reported here. They have also suggested that fluorinated alcohols with lower Henry’s law constants generate stronger oligonucleotide MS signal intensities. Although this notion can be used to explain a few of our observations (for example, HFMIP has a lower Henry’s law constant than HFIP and it produces stronger MS signal intensities when used with DMCHA), it does not coincide with the general pattern of our results. A brief examination of table 1 reveals that NFTB and TFE have the lowest and highest Henry’s law constants among utilized fluorinated alcohols, respectively. Yet, NFTB causes significant oligonucleotide ESI suppression, while TFE generates the highest signal intensity in several occasions (figures 1, 2). It appears that both the Henry’s law constant and ion suppression each influence the signal in a way that the final results are from the combined effects of these two phenomena. With this reasoning, NFTB is not a very good modifier because despite a favorable Henry’s law constant, it causes significant signal suppression.
Table 1.
Physicochemical properties of the utilized fluorinated alcohols
| HFIP | TFE | HFMIP | PFP | NFTB | |
|---|---|---|---|---|---|
| Structure |
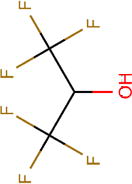
|
|
|
|
|
| Boiling point (°C) | 59 | 74 | 61 | 82 | 45 |
| pKa | 7.97 | 11.49 | 8.08 | 12.52 | 4.91 |
| Henry’s law constant, Hcp( ) | 0.23 | 0.57 | 0.17 | 0.44 | 0.08 |
| Polar surface area (Å2) | 20.23 | 20.23 | 20.23 | 20.23 | 20.23 |
| Molecular surface area (Å2) | 165.94 | 120.38 | 201.06 | 164.26 | 216.70 |
| log D (pH = 9) | 0.39 | 0.44 | 0.77 | 1.14 | –0.64 |
We suggest here that due to their more hydrophobic characteristics, DMCHA and OA prefer more hydrophobic fluorinated alcohols over HFIP. It can be seen in table 1 that while HFIP and HFMIP have a similar polar surface area, the overall surface area of HFMIP is significantly larger than HFIP. These data indicate that HFMIP has a larger non-polar area and hence is more hydrophobic. Distribution coefficients of HFIP and HFMIP at pH = 9 (normal pH range of oligo/IP solutions) also imply the same fact. Based on log D values, HFIP is the least hydrophobic alcohol after NFTB. This explains why HFIP produced the strongest MS signal in the presence of less hydrophobic IP agents, TEA and DIEA. Poor performance of the most hydrophilic alcohol, NFTB, even in the presence of less hydrophobic IP agents should be attributed to its very low pKa. On the other hand, more hydrophobic alcohols such as HFMIP and PFP generate higher ESI responses when used alongside hydrophobic IP agents — i.e., DMCHA and OA. Such behavior is not unprecedented. In fact, it has been reported previously that during negative-ion ESI of selective androgen receptor modulators, TFE increased response of more hydrophobic compounds but decreased response of a more hydrophilic compound [14]. The same pattern is seen with the oligonucleotides where TFE suppresses the signal in the presence of less hydrophobic IP reagents, while enhancing electrospray response in the presence of more hydrophobic compounds.
In general, the data from DMCHA and OA show that the presence of the fluorinated alcohols do not always contribute to improved electrospray detection for oligonucleotides. In the case of these two IP agents the electrospray response for both RNAs were reduced by the presence of the fluorinated alcohols while for DNA the fluorinated alcohols aided DMCHA but again reduced the response form OA. These results were different than the more classically used TEA or even the more recently published DIEA which had improved response with HFIP and several other fluorinated alcohols. These results show that in some cases the fluorinated alcohols may actually only be modifiers for the HPLC separation.
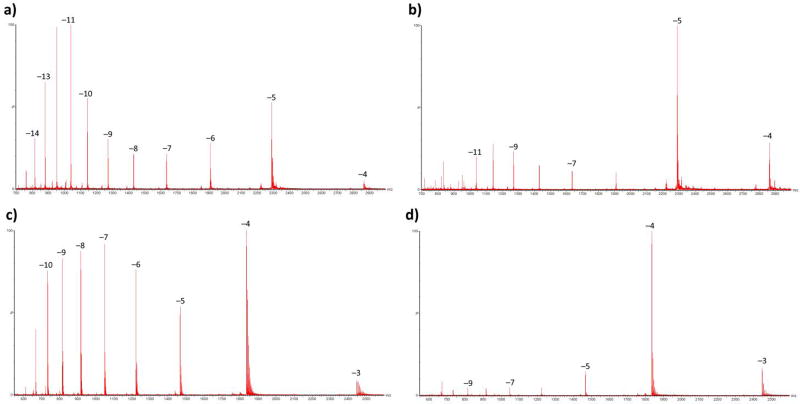
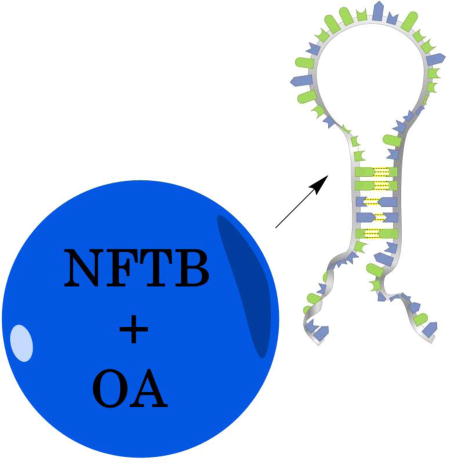
One conclusion from these studies was that NFTB appears to be a poor choice when MS signal enhancement is desired. However, we observed an unusual behavior particular to NFTB. When used with OA, it appears to preserve the secondary structure of the analyzed oligonucleotide. Figure 3 shows the shift toward higher m/z peaks when different types of oligonucleotides are sprayed from solutions containing OA and NFTB. It is a well-known phenomenon for proteins that the charge envelope at higher m/z (fewer charges) is representative of the folded protein, while the envelope at lower m/z represents the denatured and unfolded protein structures formed in acidic solutions [28–33]. Among the oligonucleotides we used, RNA and phosphorothioates could form hairpins and ssDNA was capable of folding on itself and making a short double-helix (supplemental figure S3). Moreover, stabilization of the secondary structure in OA/NFTB seemed to happen more readily when it was more favorable thermodynamically. Comparison of the top and bottom panels in figure 3 indicates that the hairpin structures are much more abundant in the mass spectrum of ssDNA compared to phosphorothioate, to the point that the hairpin is essentially the only major peak observed in the mass spectrum of ssDNA molecules sprayed from OA/NFTB solution. This observation is in complete agreement with predicted free energies of folding for these two oligonucleotides (ΔG = −9.30 Kcal/mol for ssDNA vs. ΔG = −4.95 Kcal/mol for the phosphorothioate). All of these evidence is suggesting that the same principle should govern the charge state distribution of the oligonucleotides that we examined. Nevertheless, this notion is not completely established for oligonucleotides as other parameters can also shift the charge state distribution. For example, Bartlett et al. [34] attributed the high number of charges observed on methylphosphonates to dielectric shielding by the backbone methyl groups. Therefore, we decided to measure the collision cross sections of different charge states of the phosphorothioate sprayed from a NFTB/OA solution using ion-mobility spectrometry in order to show that the higher m/z envelope represents a much more compact geometry consistent with a higher-order structure. The CCS values for different charge states of the 33-mer phosphorothioate are presented in table 2. While the average CCS value for ions carrying 8 to 12 negative charges is 1641 ± 166 Å2it declines rapidly to 984 ± 54 Å2 for −5 and −6 ions.
Figure 3. The effect of NFTB on stabilizing secondary oligonucleotide structures.
Top panels show the mass spectra of phosphorothioate infused in a solution of OA/HFIP (a) or OA/NFTB (b). Bottom panels show the mass spectra of the ssDNA strand in a solution of OA/HFIP (c) or OA/NFTB (d). Oligonucleotides sprayed from OA/NFTB solutions adopt a secondary structure with a lower charge state regardless of their type.
Table 2.
Collision cross section values for various charge states of the 33-mer phosphorothioate
| m/z | Charge state | Ω (Å2) |
|---|---|---|
| 954.76 | −12 | 1814 ± 32 |
| 1041.65 | −11 | 1763 ± 11 |
| 1145.92 | −10 | 1673 ± 13 |
| 1273.35 | −9 | 1557 ± 13 |
| 1432.65 | −8 | 1400 ± 15 |
| 1637.45 | −7 | 1228 ± 17 |
| 1910.53 | −6 | 1022 ± 31 |
| 2292.84 | −5 | 946 ± 11 |
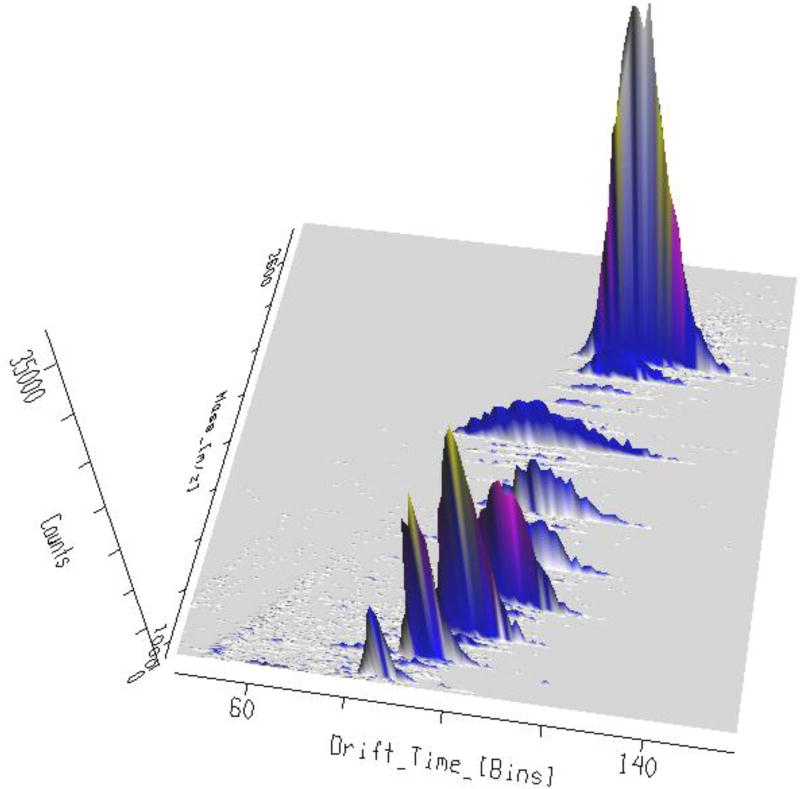
It has been suggested previously that a transition from compact globular oligonucleotide conformers to more open elongated forms occurs at higher charge states because of an increase in coulombic repulsion [9]. However, the observed increase in collision cross section as a result of elongation was only a factor of 1.2 – 1.4. Our results indicate that the collision cross section at the highest charge states is almost 2X larger than the lowest charge state (table 2). Furthermore, while the phosphorothioate conformer at 1400 Å2 in −8 charge state very closely resembles an elongated form of a 36mer G-rich sequence with eight charges (Ω = 1416 Å2) [35], the collision cross section value of −5 ion (Ω = 946 ± 11 Å2) shows a very good correlation with the experimental cross section of the quadruplex geometry of the same G-rich sequence in −5 charge state (Ω = 989 Å2) [35] as well as a previously reported triple-helix with 36 nucleotides where Ω = 960 ± 30 Å2 [36]. this strongly suggests that the oligo has adopted a secondary helical structure and not simply a compact globular form. It can also be observed in figure 4 that higher m/z peaks have clearly moved to a shorter drift time series. Through further experimentation, we realized that the same phenomenon can be reproduced with other hydrophobic linear alkylamines such as hexylamine (HA) and dibutylamine (DBA) when used with NFTB. However, just adding a single methyl side chain in methyldibutylamine (MDBA) is enough to eliminate this effect (Supplemental figure S4).
Figure 4. Drift time values for various ESI charge states of an oligonucleotide sprayed from a NFTB/OA solution.
Drift times for −5 to −12 charge states of the 33-mer phosphorothioate are shown here. It is clear that while the higher charge states at low m/z region (particularly the first four peaks) have fallen on a straight line indicative of the same drift time series, lower charge states have shifted to another series with shorter drift times (the last 2 peaks fall on a second line different from the line passing through higher charge states).
It is noticeable in figure 3 that the ssDNA already shows its secondary structure in an OA/HFIP solution, while this phenomenon was not observed with other IP agents — i.e., DIEA, TEA and DMCHA. This observation clearly indicated that the major driver of secondary structure stabilization is the IP agent. However, it is also noticeable that using NFTB alongside an appropriate IP reagent greatly increases the secondary structure formation. We believe this is due to the lower pKa of NFTB. Cech and Enke have mentioned previously that the oligonucleotide charge states achieved with the TFE solvent are significantly higher than those achieved with HFIP [10] which is consistent with our observations. This could be explained based on the lower pKa of HFIP, which causes higher protonation of oligonucleotides and therefore a decreased charge state. In the same manner, since the pKa of NFTB is significantly lower than all other alcohols investigated here (table 1), it drives the oligonucleotides to lower charge states and it is easier for these molecules with less charges to fold and form secondary structures. Consistent with this idea, adding formic acid to OA solutions generated similar results to NFTB addition (supplemental figure S5). Although formic acid had to be used at much higher concentration than NFTB and it caused more ESI signal suppression and more cluster formation. Also, despite its lower pKa value, formic acid could not shift the charge state distribution as much as NFTB even at higher concentration. Of course, the poor performance of formic acid as an ESI modifier (compared to NFTB) was not unexpected considering its unfavorable properties, such as high Henry’s law constant and boiling point.
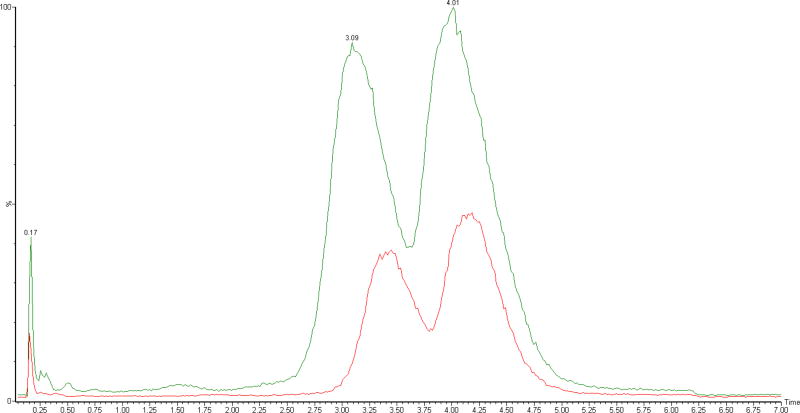
Finally, in order to demonstrate the applicability of other fluorinated alcohols for LC-MS analysis, the full-length phosphorothioate and its n-1 truncation were separated using DMCHA/HFIP and DMCHA/HFMIP mobile phases. As shown in figure 5, the DMCHA/HFMIP mobile phase can significantly enhance MS signal intensity without affecting the chromatographic separation.
Figure 5. Comparison of HFMIP and HFIP as mobile phase modifiers.
Total ion chromatogram of the mixture of phosphorothioate and its n-1 truncation acquired using a DMCHA/HFIP (red) or DMCHA/HFMIP (green) mobile phase. HFMIP generates an enhanced MS signal, without affecting the chromatographic resolution.
Conclusion
The use of other fluorinated alcohols instead of HFIP for LC-MS analysis of oligonucleotides was investigated for the first time. The behavior of fluorinated alcohols was similar to many reported studies on IP agents in that the maximum MS signal intensity was not always produced by HFIP. Two IP agents in particular, DMCHA and OA, could support much higher signal intensities when used with other fluorinated alcohols such as HFMIP and sometimes without the addition of any fluorinated alcohol. Our general guidelines for choosing IP/fluorinated alcohol based on the oligonucleotide type are summarized in table 3 below. These suggestions are made based on the fact that OA is less soluble in highly aqueous mobile phases and requires higher organic content which makes it less applicable in all situations; particularly when analyzing shorter oligonucleotides that are not well retained with high organic content. We have also observed that TFE does not have good chromatographic properties. Therefore, its combinations with IP agents were omitted from the list of final recommendations, as well.
Table 3.
Optimized mobile phase conditions for the LC-MS analysis of various oligonucleotides
| Oligonucleotide type | Optimum IP agent | Optimal fluorinated alcohol |
|---|---|---|
| ssDNA | TEA | HFIP |
| RNA | DBA | HFMIP |
| Phosphorothioate | DMCHA | HFMIP |
However, an interesting property of OA and other hydrophobic linear alkylamine IP agents was their ability to preserve the secondary structures of those oligonucleotides capable of forming such double-helical conformations. The shift in charge state distribution as well as very sharp decrease in CCS values of the lower charge states of oligonucleotides confirmed that they have adopted secondary structures.
The change of MS charge state distribution as a result of folding/unfolding in various pH values is a well-known phenomenon for proteins. However, due to the very low pKa of the backbone phosphate groups, this approach is not applicable to oligonucleotides. Nevertheless, the ESI-MS structural study of oligonucleotides in their folded state compared to their unfolded structure is desirable for many purposes. One example of this is the study of G-quadruplexes. Previous reports have indicated that G-quadruplex structures are stable in the gas phase and they can be readily studied by mass spectrometry [35, 37]. But due to the role of cations in stabilizing the structure through coordination with the O6 atom of guanine, different quadruplex structures exist at different solution conditions. For example, antiparallel basket-type forms have been observed in Na+ solutions [38] in contrast to more parallel quadruplexes in K+ solutions [39]. Substitution of Na+ and K+ with NH4+ ions for electrospray mass spectrometry can result in less stable and more polymorphic quadruplex structures [40] that are not representative of physiological conformers. In order to deal with this issue, a recent study has suggested spraying G-quadruplexes from a trimethylammonium solution doped with KCl [41]. The authors have reasoned that in contrast to NH4+ ions, triethylammonium ions cannot coordinate between G quartets due to their larger size. Therefore, only K+ ions participate in the resulting G-quadruplexes making a more physiologically relevant structure that is also ESI compatible. The NFTB/OA solution may prove particularly useful in this case. Secondary oligonucleotide structures sprayed from this solution, show a significant amount of sodium and potassium adduction even though they were not added to the solutions (figure 3). This is not surprising since it is well-known that desalting the secondary structures is more difficult than single strands [42] as cation adduction helps with salt bridge formation and the overall stability of the secondary structure. In the same manner, it could be expected that NFTB/OA solutions would substantially improve the formation of physiologically relevant Na+ or K+ coordinated G-quadruplexes by electrospray ionization.
Finally, by using a DMCHA/HFMIP mobile phase, we were able to enhance the MS signal intensity of a phosphorothioate molecule significantly more than it was possible with any combination of HFIP and IP agents. Moreover, HFMIP did not adversely affect the chromatography. These observations suggest that replacing HFIP with other fluorinated alcohols in some cases can significantly increase the sensitivity of LC-MS methods for oligonucleotide separation.
Supplementary Material
The IP agents selected for this study have been marked with an arrow. All four of them generate strong and generally comparable ESI-MS signal intensities for this particular oligonucleotide.
By examining the panels in this figure and also comparing them to figure S1, it can be observed that the relative orders in which IP agents provide the highest MS signal intensities are different from one class of oligonucleotides to another. This is even true for the oligos that belong to the same class (miR-451 and miR-30c are both RNA strands). The IP agents selected for this study have been marked with an arrow. They provide MS signal intensities that are quite variable depending on the type of oligonucleotides.
(a) 33-mer phosphorothioate ΔG = −4.95 Kcal/mol, (b) miR-451 ΔG = −1.15 Kcal/mol, (c) miR-30c ΔG = −2.82 Kcal/mol, (d) 24-mer ssDNA ΔG = −9.30 Kcal/mol
Acknowledgments
The experiments described in this manuscript were supported in part by grants from the National Cancer Institute (CA176653) and ProQR Therapeutics.
References
- 1.Bartlett MG, Chen B, McGinnis AC. LC-MS Bioanalysis of Oligonucleotides. John Wiley & Sons Inc.; 2013. [Google Scholar]
- 2.Basiri B, Bartlett Michael G. LC–MS of oligonucleotides: applications in biomedical research. Bioanalysis. 2014;6:1525–1542. doi: 10.4155/bio.14.94. [DOI] [PubMed] [Google Scholar]
- 3.Marwah A, Marwah P, Lardy H. Analysis of ergosteroids: VIII: Enhancement of signal response of neutral steroidal compounds in liquid chromatographic–electrospray ionization mass spectrometric analysis by mobile phase additives. J. Chromatogr. 2002;964:137–151. doi: 10.1016/s0021-9673(02)00650-7. [DOI] [PubMed] [Google Scholar]
- 4.Cech NB, Enke CG. Selectivity in Electrospray Ionization Mass Spectrometry. John Wiley & Sons, Inc.; 2010. [Google Scholar]
- 5.Straub RF, Voyksner RD. Determination of penicillin G, ampicillin, amoxicillin, cloxacillin and cephapirin by high-performance liquid chromatography—electrospray mass spectrometry. J. Chromatogr. 1993;647:167–181. doi: 10.1016/0021-9673(93)83336-q. [DOI] [PubMed] [Google Scholar]
- 6.Hua Y, Jenke D. Increasing the Sensitivity of an LC–MS Method for Screening Material Extracts for Organic Extractables via Mobile Phase Optimization. J. Chromatogr. Sci. 2012;50:213–227. doi: 10.1093/chromsci/bmr049. [DOI] [PubMed] [Google Scholar]
- 7.Loo JA, Loo RRO, Light KJ, Edmonds CG, Smith RD. Multiply charged negative ions by electrospray ionization of polypeptides and proteins. Anal. Chem. 1992;64:81–88. doi: 10.1021/ac00025a015. [DOI] [PubMed] [Google Scholar]
- 8.Kauppila TJ, Talaty N, Jackson AU, Kotiaho T, Kostiainen R, Cooks RG. Carbohydrate and steroid analysis by desorption electrospray ionization mass spectrometry. Chem. Commun. 2008:2674–2676. doi: 10.1039/b804413a. [DOI] [PubMed] [Google Scholar]
- 9.Hoaglund CS, Liu Y, Ellington AD, Pagel M, Clemmer DE. Gas-Phase DNA: Oligothymidine Ion Conformers. JACS. 1997;119:9051–9052. [Google Scholar]
- 10.Cech NB, Enke CG. Practical implications of some recent studies in electrospray ionization fundamentals. Mass Spectrom. Rev. 2001;20:362–387. doi: 10.1002/mas.10008. [DOI] [PubMed] [Google Scholar]
- 11.Harvey DJ. Fragmentation of Negative Ions from Carbohydrates: Part 1. Use of Nitrate and Other Anionic Adducts for the Production of Negative Ion Electrospray Spectra from N-linked Carbohydrates. J. Am. Soc. Mass. Spectrom. 2005;16:622–630. doi: 10.1016/j.jasms.2005.01.004. [DOI] [PubMed] [Google Scholar]
- 12.Xia Y-Q, Miller JD. LC-MS Method Development Strategies for Enhancing Mass Spectrometric Detection. John Wiley & Sons Inc.; 2013. [Google Scholar]
- 13.Kamel AM, Brown PR, Munson B. Effects of Mobile-Phase Additives, Solution pH, Ionization Constant, and Analyte Concentration on the Sensitivities and Electrospray Ionization Mass Spectra of Nucleoside Antiviral Agents. Anal. Chem. 1999;71:5481–5492. doi: 10.1021/ac9906429. [DOI] [PubMed] [Google Scholar]
- 14.Wu Z, Gao W, Phelps MA, Wu D, Miller DD, Dalton JT. Favorable Effects of Weak Acids on Negative-Ion Electrospray Ionization Mass Spectrometry. Anal. Chem. 2004;76:839–847. doi: 10.1021/ac0351670. [DOI] [PMC free article] [PubMed] [Google Scholar]
- 15.Huber CG, Krajete A. Analysis of Nucleic Acids by Capillary Ion-Pair Reversed-Phase HPLC Coupled to Negative-Ion Electrospray Ionization Mass Spectrometry. Anal. Chem. 1999;71:3730–3739. doi: 10.1021/ac990378j. [DOI] [PubMed] [Google Scholar]
- 16.Oberacher H, Parson W, Mühlmann R, Huber CG. Analysis of Polymerase Chain Reaction Products by On-Line Liquid Chromatography–Mass Spectrometry for Genotyping of Polymorphic Short Tandem Repeat Loci. Anal. Chem. 2001;73:5109–5115. doi: 10.1021/ac010587f. [DOI] [PubMed] [Google Scholar]
- 17.Muddiman DC, Cheng X, Udseth HR, Smith RD. Charge-state reduction with improved signal intensity of oligonucleotides in electrospray ionization mass spectrometry. J. Am. Soc. Mass. Spectrom. 1996;7:697–706. doi: 10.1016/1044-0305(96)80516-2. [DOI] [PubMed] [Google Scholar]
- 18.Apffel A, Chakel JA, Fischer S, Lichtenwalter K, Hancock WS. Analysis of Oligonucleotides by HPLC–Electrospray Ionization Mass Spectrometry. Anal. Chem. 1997;69:1320–1325. doi: 10.1021/ac960916h. [DOI] [PubMed] [Google Scholar]
- 19.Apffel A, Chakel JA, Fischer S, Lichtenwalter K, Hancock WS. New procedure for the use of high-performance liquid chromatography–electrospray ionization mass spectrometry for the analysis of nucleotides and oligonucleotides. J. Chromatogr. 1997;777:3–21. [Google Scholar]
- 20.Chen B, Bartlett MG. Evaluation of mobile phase composition for enhancing sensitivity of targeted quantification of oligonucleotides using ultra-high performance liquid chromatography and mass spectrometry: Application to phosphorothioate deoxyribonucleic acid. J. Chromatogr. 2013;1288:73–81. doi: 10.1016/j.chroma.2013.03.003. [DOI] [PubMed] [Google Scholar]
- 21.McGinnis AC, Grubb EC, Bartlett MG. Systematic optimization of ion-pairing agents and hexafluoroisopropanol for enhanced electrospray ionization mass spectrometry of oligonucleotides. Rapid Commun. Mass Spectrom. 2013;27:2655–2664. doi: 10.1002/rcm.6733. [DOI] [PubMed] [Google Scholar]
- 22.Erb R, Oberacher H. Comparison of mobile-phase systems commonly applied in liquid chromatography-mass spectrometry of nucleic acids. Electrophoresis. 2014;35:1226–1235. doi: 10.1002/elps.201300269. [DOI] [PubMed] [Google Scholar]
- 23.Sharma VK, Glick J, Vouros P. Reversed-phase ion-pair liquid chromatography electrospray ionization tandem mass spectrometry for separation, sequencing and mapping of sites of base modification of isomeric oligonucleotide adducts using monolithic column. J. Chromatogr. 2012;1245:65–74. doi: 10.1016/j.chroma.2012.05.003. [DOI] [PMC free article] [PubMed] [Google Scholar]
- 24.Chen B, Mason S, Bartlett M. The Effect of Organic Modifiers on Electrospray Ionization Charge-State Distribution and Desorption Efficiency for Oligonucleotides. J. Am. Soc. Mass. Spectrom. 2013;24:257–264. doi: 10.1007/s13361-012-0509-5. [DOI] [PubMed] [Google Scholar]
- 25.Ruotolo BT, Benesch JLP, Sandercock AM, Hyung S-J, Robinson CV. Ion mobility-mass spectrometry analysis of large protein complexes. Nat. Protocols. 2008;3:1139–1152. doi: 10.1038/nprot.2008.78. [DOI] [PubMed] [Google Scholar]
- 26.Fernandez-Lima FA, Blase RC, Russell DH. A Study of Ion-Neutral Collision Cross Section Values for Low Charge States of Peptides, Proteins, and Peptide/Protein Complexes. Int. J. Mass spectrom. 2010;298:111–118. doi: 10.1016/j.ijms.2009.10.009. [DOI] [PMC free article] [PubMed] [Google Scholar]
- 27.Counterman AE, Valentine SJ, Srebalus CA, Henderson SC, Hoaglund CS, Clemmer DE. High-order structure and dissociation of gaseous peptide aggregates that are hidden in mass spectra. J. Am. Soc. Mass. Spectrom. 1998;9:743–759. doi: 10.1016/S1044-0305(98)00052-X. [DOI] [PubMed] [Google Scholar]
- 28.Chowdhury SK, Katta V, Chait BT. Probing conformational changes in proteins by mass spectrometry. JACS. 1990;112:9012–9013. [Google Scholar]
- 29.Loo JA, Loo RRO, Udseth HR, Edmonds CG, Smith RD. Solvent-induced conformational changes of polypeptides probed by electrospray-ionization mass spectrometry. Rapid Commun. Mass Spectrom. 1991;5:101–105. doi: 10.1002/rcm.1290050303. [DOI] [PubMed] [Google Scholar]
- 30.Konermann L, Douglas DJ. Equilibrium unfolding of proteins monitored by electrospray ionization mass spectrometry: distinguishing two-state from multi-state transitions. Rapid Commun. Mass Spectrom. 1998;12:435–442. doi: 10.1002/(SICI)1097-0231(19980430)12:8<435::AID-RCM181>3.0.CO;2-F. [DOI] [PubMed] [Google Scholar]
- 31.Dobo A, Kaltashov IA. Detection of Multiple Protein Conformational Ensembles in Solution via Deconvolution of Charge-State Distributions in ESI MS. Anal. Chem. 2001;73:4763–4773. doi: 10.1021/ac010713f. [DOI] [PubMed] [Google Scholar]
- 32.Šamalikova M, Matečko I, Müller N, Grandori R. Interpreting conformational effects in protein nano-ESI-MS spectra. Anal. Bioanal. Chem. 2004;378:1112–1123. doi: 10.1007/s00216-003-2339-6. [DOI] [PubMed] [Google Scholar]
- 33.Watt SJ, Sheil MM, Beck JL, Prosselkov P, Otting G, Dixon NE. Effect of Protein Stabilization on Charge State Distribution in Positive- and Negative-Ion Electrospray Ionization Mass Spectra. J. Am. Soc. Mass. Spectrom. 2007;18:1605–1611. doi: 10.1016/j.jasms.2007.06.004. [DOI] [PubMed] [Google Scholar]
- 34.Bartlett MG, McCloskey JA, Manalili S, Griffey RH. The Effect of Backbone Charge on the Collision-Induced Dissociation of Oligonucleotides. J. Mass Spectrom. 1996;31:1277–1283. doi: 10.1002/(SICI)1096-9888(199611)31:11<1277::AID-JMS418>3.0.CO;2-F. [DOI] [PubMed] [Google Scholar]
- 35.Baker ES, Bernstein SL, Gabelica V, De Pauw E, Bowers MT. G-quadruplexes in telomeric repeats are conserved in a solvent-free environment. Int. J. Mass spectrom. 2006;253:225–237. [Google Scholar]
- 36.Arcella A, Portella G, Ruiz ML, Eritja R, Vilaseca M, Gabelica V, et al. Structure of Triplex DNA in the Gas Phase. JACS. 2012;134:6596–6606. doi: 10.1021/ja209786t. [DOI] [PubMed] [Google Scholar]
- 37.Mazzitelli CL, Wang J, Smith SI, Brodbelt JS. Gas-Phase Stability of G-quadruplex DNA Determined by Electrospray Ionization Tandem Mass Spectrometry and Molecular Dynamics Simulations. J. Am. Soc. Mass. Spectrom. 2007;18:1760–1773. doi: 10.1016/j.jasms.2007.07.008. [DOI] [PMC free article] [PubMed] [Google Scholar]
- 38.Wang Y, Patel DJ. Solution structure of the human telomeric repeat d[AG3(T2AG3)3] G-tetraplex. Structure. 1993;1:263–282. doi: 10.1016/0969-2126(93)90015-9. [DOI] [PubMed] [Google Scholar]
- 39.Parkinson GN, Lee MPH, Neidle S. Crystal structure of parallel quadruplexes from human telomeric DNA. Nature. 2002;417:876–880. doi: 10.1038/nature755. [DOI] [PubMed] [Google Scholar]
- 40.Smargiasso N, Rosu F, Hsia W, Colson P, Baker ES, Bowers MT, et al. G-Quadruplex DNA Assemblies: Loop Length, Cation Identity, and Multimer Formation. JACS. 2008;130:10208–10216. doi: 10.1021/ja801535e. [DOI] [PubMed] [Google Scholar]
- 41.Marchand A, Gabelica V. Native Electrospray Mass Spectrometry of DNA G-Quadruplexes in Potassium Solution. J. Am. Soc. Mass. Spectrom. 2014;25:1146–1154. doi: 10.1007/s13361-014-0890-3. [DOI] [PMC free article] [PubMed] [Google Scholar]
- 42.Beverly M, Hartsough K, Machemer L. Liquid chromatography/electrospray mass spectrometric analysis of metabolites from an inhibitory RNA duplex. Rapid Commun. Mass Spectrom. 2005;19:1675–1682. doi: 10.1002/rcm.1972. [DOI] [PubMed] [Google Scholar]
Associated Data
This section collects any data citations, data availability statements, or supplementary materials included in this article.
Supplementary Materials
The IP agents selected for this study have been marked with an arrow. All four of them generate strong and generally comparable ESI-MS signal intensities for this particular oligonucleotide.
By examining the panels in this figure and also comparing them to figure S1, it can be observed that the relative orders in which IP agents provide the highest MS signal intensities are different from one class of oligonucleotides to another. This is even true for the oligos that belong to the same class (miR-451 and miR-30c are both RNA strands). The IP agents selected for this study have been marked with an arrow. They provide MS signal intensities that are quite variable depending on the type of oligonucleotides.
(a) 33-mer phosphorothioate ΔG = −4.95 Kcal/mol, (b) miR-451 ΔG = −1.15 Kcal/mol, (c) miR-30c ΔG = −2.82 Kcal/mol, (d) 24-mer ssDNA ΔG = −9.30 Kcal/mol


