

Abstract
Introduction
The surging popularity of all-terrain vehicles (ATV) in the United States has caused an “epidemic of injuries and mortality.” The U.S. Consumer Product Safety Commission reported 99,600 injuries and 426 fatalities from ATV accidents in 2013. The aim of this study was to examine the relationship between helmet use and positive toxicology screenings on outcomes in ATV accident victims.
Methods
This is a retrospective study of patients admitted to a Level 1 Trauma Center in southwestern West Virginia following an ATV accident between 2005 and 2013. Data were obtained from the institution’s Trauma Registry.
Results
A total of 1,857 patients were admitted during the study period with 39 (1.9%) reported deaths. Positive serum alcohol and/or urine drug screens were obtained in 66.4% of the patients tested (n = 1,293). Those with positive screenings were 9.5% less likely to utilize a helmet (13.2% vs. 22.7%, p < 0.001); and the lack of helmet use was associated with an increase in traumatic brain injury (57.1% vs. 41.7%, p < 0.001). Positivity for substances or the lack of helmet use was significantly associated with higher morbidity. Lack of helmet use resulted in a 3.94-fold increase in the risk of discharge in a vegetative state or death.
Conclusions
Drugs and alcohol use may predispose riders to be less likely to wear helmets and significantly increase the risk of a poor clinical outcome following an ATV accident. Rigorous efforts should be made to enhance safety measures through educational endeavors and amendment of current regulations to promote safe and responsible use of ATVs.
Practical applications
Modification of regulatory requirements should be considered in order to mandate the wearing of helmets during ATV operation. In addition, expansion of safety programs should be considered in an effort to improve availability, affordability and awareness of safe ATV practices.
Keywords: Injury diagnosis, Helmet, ATV, Drugs, Alcohol
1. Introduction
The increasing popularity of all-terrain vehicles (ATV) in the United States has caused an “epidemic of injuries and mortality” among ATV users (Mullins et al., 2007). A recent publication deemed that the evolution of ATVs from a farming aid to a recreational vehicle has been detrimental to society (White, McKinnon, & Hughes, 2013). This perspective is supported by epidemiological data of ATV accidents and related morbidity and mortality. In the United States between 2008 and 2013, the U.S. Consumer Product Safety Commission (CPSC) reported a total of 13,043 ATV-related deaths. The latest annual report published by CPSC recorded approximately 99,600 ATV-related emergency department-treated injuries and 426 fatalities in 2013. Twenty-five percent of these ATV injuries were in children below 16 years of age (Annual Report of ATV-Related Deaths and Injuries, 2013).
The safety of ATVs has been questioned since the 1980s. Multiple regulatory efforts have been made to curb the alarming increase of ATV-associated injuries and deaths (Balthrop et al., 2007; Rodgers & Adler, 2001). In 1988, following an extensive regulatory proceeding initiated by the CPSC, distributors agreed to discontinue the production and sale of three wheel ATVs. Additional decrees resulting from this effort, which expired in 1998, included the development of more stringent age requirements for drivers of ATVs and the implementation of a nationwide training program approved by the CPSC (Rodgers & Adler, 2001).
Currently, the regulation of ATV operation falls under the purview of state governmental bodies and is not governed by federal legislation. According to CPSC, all 50 states have ATV regulations in place; however, these laws are not standardized and vary significantly in their scope and application. Only 25 states require the use of a helmet; of these, 12 states have legislation specific to children whereas the remaining 13 states mandate both adults and children wear helmets (http://www.cpsc.gov/en/Safety-Education/Safety-Education-Centers/ATV-Safety-Information-Center/State-ATV-Information/,n.d.). Legislation addressing training requirements for ATV operation, age and ATV size limitations also vary significantly among states (Helmkamp, Furbee, Coben, & Tadros, 2008).
Current literature evaluating ATV associated traumas have identified the lack of helmet use as a risk factor for fatalities and head injuries (Bowman, Aitken, Helmkamp, Maham, & Graham, 2009; Rodgers, 1990; Rostas et al., 2014). Studies have also shown an association between substance exposure and ATV-related deaths (Hall, Bixler, Helmkamp, Kraner, & Kaplan, 2009; Smith & Middaugh, 1986). A study by Williams et al. described the characteristics of fatally injured ATV riders whose crashes occurred on public roads between 2007 and 2011. These investigators discovered that only 13% of drivers and 6% of passengers were wearing helmets at the time of their fatal accident. In addition, 43% of the fatally injured drivers had blood alcohol concentrations above 0.08% (Williams, Oesch, McCartt, Teoh, & Sims, 2014). While data exists evaluating mortality rates and other hospital-related outcomes in the overall ATV trauma population, very few studies have investigated a potential relationship between outcomes with helmet use and substance exposure (Balthrop et al., 2007; Bowman et al., 2009; Helmkamp et al., 2008). Furthermore, substantial resources are annually expended in the treatment of ATV accident patients. One study estimated hospitalization costs for ATV-related injuries to approach $1.1 billion between 2000 and 2004, of which 20% of the incurred costs were paid from public funds (Helmkamp et al., 2008). This alarming data calls for further studies that not only more effectively define the association between helmet use, substance exposure and ATV accident outcomes, but also attempts to describe the impact that lack of helmet use and substance exposure has on economic outcomes.
Accordingly, the current study endeavors to provide a comprehensive evaluation of the impact of no helmet use and substance exposure on morbidity, functional status at discharge, mortality, and economic outcomes associated with ATV accidents. This study will be the first to concomitantly evaluate the relationship between the two most common risk factors, substance exposure and helmet use, previously individually studied in ATV trauma literature (Bowman et al., 2009; Hall et al., 2009; Rodgers, 1990; Rostas et al., 2014; Smith & Middaugh, 1986).
2. Methods
This is a retrospective cohort study of patients of all ages who presented to a Level 1 Trauma Center in southwestern West Virginia secondary to injuries obtained from ATV accidents between January 2005 and December 2013. Following approval of the Institutional Review Board, subjects were identified and data were obtained through the institution’s Trauma Registry. A total of 1,857 patients’ data were provided by the registry. Patients were divided into 6 groups based on helmet use and results of serum alcohol and urine toxicology screens obtained upon presentation to the emergency department (Fig. 1). Drugs tested in urine included narcotics, cannabis, benzodiazepines, amphetamines, cocaine, barbiturates, and ecstasy. For the purpose of this study, alcohol and the above-listed drugs are mentioned by the broader term “substance exposure.”
Variables collected included demographic data, alcohol and toxicology screen results, helmet use, admission diagnoses, hospital and Intensive Care Unit (ICU) length of stay (LOS), charges billed, mortality, and functional status at discharge. The assessment of functional status was based on Functional Independence Measure performed by a trauma nurse practitioner prior to patients’ discharge. Admission diagnoses were categorized into 11 broad injury groups: skin, musculoskeletal, traumatic brain injury (TBI), spinal injury, peripheral nervous system, genitourinary, gastrointestinal, cardiovascular, eye-ocular adnexa, and thoracic-lung.
Data analysis was performed using SPSS Version 22.0 (IBM Corp, Armonk, NY). Descriptive statistics were computed for each variable to describe the patient population. Normality for the variables was tested with Kolmogorov–Smirnov test. For non-normally distributed variables, medians with interquartile ranges were reported in this study; these variables were compared using Mann–Whitney U test. Outcome variables of hospital LOS, ICU LOS, and hospital billing cost were dichotomized using a binary median split. Frequencies and percentages were computed to describe categorical data, which were compared using Pearson’s Chi-square test or Fisher’s exact t-test. P values of ≤.05 were considered significant. Odds ratios with 95% confidence intervals (CI) were reported.
3. Results
3.1. Patient characteristics and overall outcomes
The analysis included 1,857 patients over a nine year period. The majority of patients were male (78.5%) and ≥18 years old (80.8%; median age of 33 years). More than two-thirds of the patients (n = 1,256, 67.6%) were tested for alcohol; of these, 38.8% tested positive. Urine drug screens were conducted in approximately half of the patients (n = 1,011, 54.4%); out of which 62.4% had positive results. Narcotics were the most common positive finding (59.7%), followed by cannabis (41.9%) and benzodiazepines (41.0%; Table 1). The median ISS was 10 (5–17) with the three most frequently encountered injury categories being the skin (76.8%), musculoskeletal (69.6%), and TBI (51.0%). Data documenting helmet use was available for 1,711 patients, with only a small percentage (18.8%) wearing a helmet at the time of their accident.
Table 1.
Patient characteristics and hospital outcomes.
| N = 1,857 | |
|---|---|
| Patient characteristics | |
| Ageb | 33 (20–47) |
| Gender (male)a | 1,458 (78.5%) |
| Adult ≥ 18 yearsa | 1,500 (80.8%) |
| Use of safety devicea | 321 (18.8%) |
| Injury severity scoreb | 10 (5–17) |
| Alcohol positivea | 487 (38.8%) |
| Positive for drug(s)a | 631 (62.4%) |
| Narcotics Positivea | 377 (59.7%) |
| Cannabis Positivea | 265 (41.9%) |
| Benzodiazepine positivea | 259 (41.0%) |
| Amphetamine positivea | 60 (9.5%) |
| Cocaine positivea | 46 (7.2%) |
| Barbiturates positivea | 20 (3.1%) |
| Ecstasya | 1 (0.15%) |
| At least one substance exposurea | 858 (66.4%) |
| Injuries | |
| Skina | 1,424 (76.8%) |
| Musculoskeletala | 1,292 (69.6%) |
| Traumatic brain injurya | 946 (51.0%) |
| Spinal injurya | 21 (1.1%) |
| Peripheral nervous systema | 42 (2.3%) |
| Genitourinarya | 70 (3.8%) |
| Gastro intestinala | 178 (9.6%) |
| Cardiovasculara | 25 (1.3%) |
| Eye-ocular adnexaa | 38 (2.0%) |
| Thoracic-lunga | 629 (33.9%) |
| Outcomes | |
| Hospital length of stay (d)b | 3 (2–6) |
| ICU length of stay (d)b | 2 (1–6) |
| ICU incidencea | 719 (38.7%) |
| Hospital cost ($)b | $18,187.88 ($10,736.69–$34,633.23) |
| Mortalitya | 36 (1.9%) |
| Mortality and vegetative statea | 38 (2.2%) |
| Moderate and worsea | 142 (8.1%) |
n (%).
Median (interquartile range).
General outcomes (Table 1) were assessed including mortality, hospital LOS, ICU LOS, functional status at discharge, and hospital billing cost. Patients who were discharged within 24 h were excluded from the analysis of HLOS. Similarly, patients discharged from ICU in less than 24 h were not included in the ICU LOS analysis. The median hospital and ICU LOS were 3 (2–6) and 2 (1–6) days respectively. More than one-third of the patients required ICU admission (38.7%), however, the overall mortality rate was only 1.9% (n = 36). The majority of the patients (91.9%) were discharged either in good condition or with a temporary disability. The remaining 8.1% of the study population were discharged with at least a moderate disability(s). Evaluation of economic outcomes revealed a median hospital billing cost of $18,187.88 ($10,736.69–$34,633.23). Total charges billed in the nine-year time were estimated to be approximately $61 million, Medicaid and/or Medicare was listed as a payer source for 43.4% of this total hospital billing cost.
3.2. Outcomes comparing positive vs. negative substance exposure groups
After conducting an overall analysis, a sub-analysis was performed comparing the demographics, injuries, and outcomes between patients who had positive serum alcohol or urine drug screen versus those with negative toxicology results (Table 2). Approximately 70% (n = 1,293) of the patient population was tested for substance exposure and of those 66.4% (n = 858) were positive for at least one substance upon presentation to the emergency department. The median age of the substance exposure group was significantly higher than the median age of the non-substance exposure group (37 vs. 27, p = 0.000); the former group also had a higher median ISS (12 vs. 10, p = 0.000). Out of the 11 injury categories, there were a higher percentage of substance exposure patients in 9 of these categories. However, significant differences between the two groups were detected only for 3 injury types: musculoskeletal (69.6% vs. 63.4%, p = 0.027, OR = 1.31, 95% CI = 1.03–1.67), TBI (67.2% vs. 55.9%, p < 0.001, OR = 1.63, 95% CI = 1.28–2.07), and genitourinary (5.3% vs. 2.8%, p = 0.039, OR = 1.97, 95% CI = 1.02–3.73).
Table 2.
Patient characteristics and hospital outcomes by substance exposure.a
| Substance exposure (N = 858) | No substance exposure (N = 435) | P value | Odds ratioa | 95% CI | |
|---|---|---|---|---|---|
| Patient characteristics | |||||
| Agec | 37 (26–48) | 27 (16–46) | 0.000 | ||
| Gender (male)b | 716 (83.4%) | 316 (72.6%) | 0.000 | ||
| Injury severity scorec | 12 (6–19) | 10 (5–17) | 0.000 | ||
| Use of helmetb | 111 (13.2%) | 94 (22.7%) | 0.000 | 1.92 | 1.41–2.60 |
| Admission injuries | |||||
| Skinb | 718 (83.9%) | 357 (82.1%) | 0.410 | ||
| Musculoskeletalb | 596 (69.6%) | 276 (63.4%) | 0.027 | 1.31 | 1.03–1.67 |
| Traumatic brain injuryb | 577 (67.2%) | 243 (55.9%) | 0.000 | 1.63 | 1.28–2.07 |
| Spinal injuryb | 11 (1.3%) | 8 (1.8%) | 0.435 | ||
| Peripheral nervous systemb | 27 (3.2%) | 6 (1.4%) | 0.056 | ||
| Genitourinaryb | 45 (5.3%) | 12 (2.8%) | 0.039 | 1.97 | 1.02–3.73 |
| Gastro intestinalb | 101 (11.8%) | 42 (9.7%) | 0.246 | ||
| Cardiovascularb | 15 (1.8%) | 7 (1.6%) | 0.851 | ||
| Eye-ocular adnexab | 23 (2.6%) | 10 (2.3%) | 0.676 | ||
| Thoracic-lungb | 359 (41.9%) | 170 (39.1%) | 0.324 | ||
| Outcomes | |||||
| Hospital Length of stay >3(d)b | 366 (52.1%) | 136 (43.3%) | 0.009 | 1.43 | 1.09–1.86 |
| ICU Length of stay >2(d)b | 182 (50.6%) | 60 (54.5%) | 0.464 | ||
| Incidence of ICU admissionb | 457 (53.3%) | 148 (34.0%) | 0.000 | 2.21 | 1.73–2.80 |
| Hospital cost >$18,187.88b | 499 (58.9%) | 208 (48.0%) | 0.000 | 1.55 | 1.23–1.96 |
| Mortalityb | 24 (2.8%) | 8 (1.8%) | 0.295 | ||
| Mortality and vegetative stateb | 26 (3.2%) | 8 (1.9%) | 0.204 | ||
| Moderate and worseb | 98 (12.1%) | 33 (8.0%) | 0.029 | 1.57 | 1.04–2.37 |
Boldface indicates statistical significance (p ≤ 0.05).
Unadjusted odds ratio.
n (%).
Median (Interquartile Range).
Evaluation of helmet use revealed that patients with substance exposures were less likely to wear helmets while operating ATVs (13.2% vs. 22.7%, p < 0.001). The likelihood of substance exposure patients not wearing helmets was almost 2-fold (OR = 1.92; 95% CI = 1.41–2.60) higher than patients with negative substance screenings. Similarly, a significantly higher percentage of substance exposure patients had a hospital LOS > 3 days (52.1% vs. 43.3%, p = 0.009, OR = 1.43, 95% CI = 1.09–1.86). Although there was no significant difference between the groups with respect to ICU LOS > 2 days, the incidence of ICU admission in the substance exposure group was significantly higher (53.3% vs. 34.0%, p < 0.001, OR = 2.21, 95% CI = 1.73–2.80). The incidence of discharge with moderate disability or worse was also significantly higher in the patients who were positive for substances upon presentation (12.1% vs. 8.0%, p = 0.029, OR = 1.57, 95% CI = 1.04–2.37). Hospital billing cost >$18,187.88 were significantly higher in this group as well (58.9% vs. 48.0%, p < 0.001, OR = 1.55, 95% CI = 1.23–1.96) with total billed hospital cost for these patients approaching $34 million. Medicare and/or Medicaid were listed as a payer source for 61.3% the total hospital billing cost.
3.3. Outcomes comparing helmet vs. no helmet groups
An additional sub-analysis was conducted comparing characteristics, injuries, and outcomes between patients wearing helmets versus those who were not (Table 3). The median age of patients not wearing a helmet was significantly higher than helmeted patients (31 vs. 28, p < 0.001). The median ISS of the non-helmeted group was also significantly higher than the helmeted group (10 vs. 9, p = 0.045). Accordingly, a significantly higher number of patients not wearing helmets had TBIs (57.1% vs. 47.1%, p < 0.001). The odds of non-helmeted patients having TBI was 1.85-fold higher than the helmeted group (95%CI = 1.45–2.37). A significantly higher number of non-helmeted patients had hospital LOS > 3 (46.3% vs. 33.9%, p < 0.001, OR = 1.68, 95% CI = 1.26–2.24). The two groups were comparable with regard to ICU LOS > 2 days; however, incidence of ICU admission was significantly higher in the non-helmeted group (42.8% vs. 29.9%, p < 0.001, OR = 1.75, 95% CI = 1.35–2.27). Mortalities or discharges in a vegetative state were significantly higher for patients not wearing helmets (2.5% vs. 0.6%, p = 0.043). Patients without helmets were 3.94 times more likely to die or be discharged in a vegetative state (95%CI = 0.92–16.24). Furthermore, the percentage of non-helmeted patients with a hospital billing cost >$18,187.88 was significantly higher (52.4% vs. 42.8%, p = 0.002, OR = 1.47, 95% CI = 1.15–1.88) resulting in a total hospital billing cost of approximately $49 million. Medicaid and/or Medicare were listed as the payer source for 48.7% of this cost.
Table 3.
Patient characteristics and hospital outcomes by helmet use.
| Helmet use (N = 321) | No helmet use (N = 1,390) | P value | Odds ratioa | 95% CI | |
|---|---|---|---|---|---|
| Patient characteristics | |||||
| Agec | 28 (15–42) | 31 (24–48) | 0.000 | ||
| Gender (male)b | 271 (84.4%) | 1,077 (77.5%) | 0.006 | ||
| Injury severity scorec | 9 (5–14) | 10 (5–17) | 0.045 | ||
| Admission injuries | |||||
| Skinb | 224 (69.8%) | 1,127 (81.2%) | 0.000 | 1.87 | 1.42–2.45 |
| Musculoskeletalb | 225 (70.1%) | 960 (69.1%) | 0.732 | ||
| Traumatic brain injuryb | 134 (41.7%) | 792 (57.1%) | 0.000 | 1.85 | 1.45–2.37 |
| Spinal injuryb | 3 (0.9%) | 17 (1.2%) | 0.663 | ||
| Peripheral nervous systemb | 5 (1.6%) | 35 (2.5%) | 0.303 | ||
| Genitourinaryb | 14 (4.4%) | 53 (3.8%) | 0.651 | ||
| Gastro intestinalb | 37 (11.5%) | 133 (9.6%) | 0.294 | ||
| Cardiovascularb | 3 (0.9%) | 21 1.5%) | 0.427 | ||
| Eye-ocular adnexab | 3 (0.9%) | 35 (2.5%) | 0.082 | ||
| Thoracic-lungb | 108 (33.6%) | 501 (36.1%) | 0.409 | ||
| Outcomes | |||||
| Hospital length of stay >3(d)b | 86 (33.9%) | 487 (46.3%) | 0.000 | 1.68 | 1.26–2.24 |
| ICU length of stay >2(d)b | 26 (40.0%) | 228 (50.6%) | 0.112 | ||
| Incidence of ICU admissionb | 96 (29.9%) | 595 (42.8%) | 0.000 | 1.75 | 1.35–2.27 |
| Hospital cost >$18,187.88b | 136 (42.8%) | 772 (52.4%) | 0.002 | 1.47 | 1.15–1.88 |
| Mortalityb | 2 (0.6%) | 31 (2.2%) | 0.059 | ||
| Mortality and vegetative stateb | 2 (0.6%) | 33 (2.5%) | 0.043 | 3.94 | 0.92–16.24 |
| Moderate and worseb | 20 (6.5%) | 115 (8.8%) | 0.195 |
Boldface indicates statistical significance (p ≤ 0.05).
Unadjusted odds ratio.
n (%).
Median (interquartile range).
3.4. Outcomes comparing substance positive and no helmet vs. substance negative and helmet groups
A final analysis was conducted comparing morbidity and mortality in patients positive for substance exposure and not wearing a helmet versus those negative for substance exposure and wearing helmet (Table 4). The median age of the patients in the former group was significantly higher (37 vs. 20, p = 0.000) and patients in this group were also more severely injured with respect to their ISS (12 vs. 10, p = 0.015). Hospital LOS > 3 (53.3% vs. 34.8%, p = 0.004, OR = 2.13, 95% CI = 1.25–3.63), incidence of ICU admission (54.6% vs. 28.4%, p < 0.001, OR = 3.03, 95% CI = 1.89–4.84), and hospital billing cost > $18,187.88 above (60.3% vs. 41.5%, p = 0.001, OR = 2.13, 95% CI = 1.38–3.30) were significantly unfavorable for this group. A higher percentage of patients in this group also experienced a TBI (70.1% vs. 54.7%, p = 0.003, OR = 1.93, 95% CI = 1.25–2.98). When comparing mortality between the two groups, patients positive for substances and not wearing helmet had higher mortality (2.9% vs. 0.0%); however, this comparison did not reach statistical significance. A significantly higher percentage of these patients, however, were discharged with at least a moderate disability (12.0% vs. 4.3%, p = 0.032, OR = 3.01, 95%CI = 1.07–8.42).
Table 4.
Patient characteristics and hospital outcomes by substance and helmet use.
| Substance and no helmet use (N = 727) | No substance and helmet use (N = 95) | P value | Odds ratioa | 95% CI | |
|---|---|---|---|---|---|
| Patient characteristics | |||||
| Agec | 37 (26–48) | 20 (15–40) | 0.000 | ||
| Gender (male)b | 608 (83.6%) | 77 (81.1%) | 0.526 | ||
| Injury severity scorec | 12 (6–19) | 10 (5–17) | 0.015 | ||
| Admission injuries | |||||
| Skinb | 624 (86.1%) | 73 (76.8%) | 0.018 | 1.86 | 1.10–3.13 |
| Musculoskeletalb | 500 (69.0%) | 56 (58.6%) | 0.049 | 1.54 | 0.99–2.39 |
| Traumatic brain injuryb | 508 (70.1%) | 52 (54.7%) | 0.003 | 1.93 | 1.25–2.98 |
| Spinal injuryb | 9 (1.2%) | 1 (1.1%) | 0.877 | ||
| Peripheral Nervous systemb | 25 (3.4%) | 1 (1.1%) | 0.210 | ||
| Genitourinaryb | 38 (5.2%) | 5 (5.3%) | 0.993 | ||
| Gastro intestinalb | 86 (11.9%) | 12 (12.6%) | 0.828 | ||
| Cardiovascularb | 15 (2.1%) | 2 (2.1%) | 0.981 | ||
| Eye-ocular adnexab | 21 (2.9%) | 2 (2.1%) | 0.661 | ||
| Thoracic-lungb | 306 (42.2%) | 42 (44.2%) | 0.710 | ||
| Outcomes | |||||
| Hospital length of stay >3(d)b | 313 (53.3%) | 23 (34.8%) | 0.004 | 2.13 | 1.25–3.63 |
| ICU length of stay >2(d)b | 165 (52.4%) | 9 (39.1%) | 0.220 | ||
| Incidence of ICU admissionb | 397 (54.6%) | 27 (28.4%) | 0.000 | 3.03 | 1.89–4.84 |
| Hospital cost >$18,187.88b | 432 (60.3%) | 39 (41.5%) | 0.001 | 2.13 | 1.38–3.30 |
| Mortalityb | 21 (2.9%) | 0 (0.0%) | 0.157 | ||
| Mortality and vegetative stateb | 23 (3.3%) | 0 (0.0%) | 0.097 | ||
| Moderate and worseb | 83 (12.0%) | 4 (4.3%) | 0.032 | 3.01 | 1.07–8.42 |
Boldface indicates statistical significance (p ≤ 0.05).
Unadjusted odds ratio.
n (%).
Median (Interquartile Range).
4. Discussion
The rising number of ATV accidents and related injuries has become a pressing public health problem attracting increasing attention from researchers. Current literature indicates that the majority of ATV drivers are male (74% to 90%) with approximately 14% being children <18 years of age (Hall et al., 2009; Helmkamp et al., 2008; Mazotas et al., 2014; Rostas et al., 2014; Smith & Middaugh, 1986; Williams et al., 2014). The current reported rate of substance exposure in the existing literature ranges from 26% to 57.7% for patients presenting secondary to ATV accidents. The average hospital and ICU LOS ranges from 3.9 to 8.1 and 3.8 to 8.4 days respectively with musculoskeletal and central nervous system (CNS) injuries being the most prevalent reported diagnoses (Balthrop et al., 2007; Bowman et al., 2009; Hall et al., 2009; Helmkamp et al., 2008; Rodgers & Adler, 2001; Smith & Middaugh, 1986). Several previous studies have assessed the impact of substance exposure on mortality associated with ATV accidents and support a direct relationship between the two (Balthrop et al., 2007; Hall et al., 2009; Rodgers, 1990; Rostas et al., 2014; Smith & Middaugh, 1986). A study conducted by Smith and Middaugh suggests that fatal injuries are strongly associated with alcohol use. Alcohol was cited as the contributing cause of the fatal crash for 12 of 15 drivers (Smith & Middaugh, 1986). Rodgers and colleagues reported data demonstrating that the risk of fatality was 62% lower if alcohol and drugs were not present at the time of the accident (Rodgers, 1990). Despite this data, there remains a paucity of literature addressing differences in injury severity, incidence of ICU admission, the duration of hospitalization, or functional status at discharge with regard to substance exposure in this patient population.
The current study’s findings are comparable to previous studies with male riders being most frequently injured (78.5%); however, the rate of injured pediatric patients is approximately 4% higher in the current study (18.2%). Patients with substance exposure represented 66.4% of the study population. Despite having a higher incidence of substance exposure in patients presenting with injuries secondary to ATV accidents, patients admitted to the study’s Trauma Center had a slightly shorter median hospital (3 days) and an ICU LOS (2 days). Similarly the overall mortality rate for the current study was quite low at 1.9%. Despite these differences the injury subsets remained consistent with previous literature with a high prevalence of musculoskeletal and CNS injuries. Indicators of morbidity such as ISS and incidence of ICU admission are significantly higher among patients with substance exposure findings upon presentation to the trauma center. This patient population was also found to be 1.57 times more likely to be discharged with at least a moderate disability.
Previously, studies aimed at examining the relationship between substance exposure and helmet use were unsuccessful in establishing such a relationship (Hall et al., 2009; Rostas et al., 2014). The current study, however, found that patients with substance exposure are almost 2 times less likely to wear helmets. Furthermore, previous data by Hall et al. reported that only 15% of the patients in West Virginia were wearing helmets at the time of their ATV accident (Hall et al., 2009). In the current study, a slightly higher percentage of patients (18.8%) were wearing helmets at the time of their accident, however, this was 31.7% lower than the national rate (Adams, Aitken, Mullins, Miller, & Graham, 2013).
Studies have reported that helmet use reduced the risk of death and head injury by 42% and 64%, respectively (Rodgers, 1990). Bowman et al. noted that helmet use was associated with lower rates of neck, face, TBI and death (Hall et al., 2009). In a more recent study conducted by Rostas et al., use of a helmet was found to significantly reduce the risk of having intracranial hemorrhage following an ATV accident (Rostas et al., 2014). Findings from the current study were congruent with the existing data. In addition to markers of morbidity being significantly higher in non-helmeted patients; this population was almost twice as likely to have suffered a brain injury and approximately 4 times as likely to have experienced an injury culminating in death or a chronic vegetative state.
To the best of the authors’ knowledge, previous studies have not investigated the association between morbidity and mortality outcomes in patients with substance exposure and no helmet use. Results of this study suggest that being positive for substances and lack of helmet use increases the chances of having a higher hospital LOS, incidence of ICU admission, hospital billing cost, and discharge with at least moderate disability. Furthermore, the compounded impact of substance exposure and lack of helmet use significantly increases the odds for unfavorable morbidity and mortality outcomes.
There is limited data evaluating the economic impact of ATV accidents in the current literature. A study conducted by Helmkamp et al. reported that national hospital cost for ATV injuries approached $1.1 billion dollars from 2000 to 2004. The study further found that the average cost per patient was $19,671 and nearly one out of five patients was paid by a public source of insurance (8% Medicare and 12% Medicaid) (Helmkamp et al., 2008). In the current study, the total cost of hospitalization to treat 1,857 patients was $61 million between 2005 to 2013 with a median cost of $18, 187.88 per hospitalization. Medicare and/or Medicaid were listed as a payer source for approximately 43% of this cost. This study also found a positive association between non-helmeted patients, substance exposure, and increasing hospital billing cost. Medicare and/or Medicaid was listed as a payer source for significant amounts of the total costs for treating non-helmeted (48.7%) and substance exposure (61.3%) patients. These data could be critically important for states that do not legally require adult helmet use. Economic burden borne by public funding to treat these patients may potentially be reduced through mandating the use of helmets with all ATV operation and potentially through the development of awareness and injury prevention programs. A study conducted by Adams et al. in Arkansas with adolescent and adult ATV users identified a lack in risk perception of driving an ATV and potential severity of injuries resulting from it. They concluded that the development of injury prevention programs to educate ATV users about the risk of unsafe ATV usage will lead to increased use of helmets (Adams et al., 2013).
Despite this study highlighting various impactful findings concerning the influence of substance exposure and safety device use on outcomes in ATV related traumas, the study is not without limitations. Due to its design the study is reliant upon the identification, availability and completeness of patients’ medical records. Accordingly, all patients presenting to the study facility during the evaluated period may not have been identified and included in the study resulting in selection bias that is an inherent limitation of retrospective studies. In addition, the validity of the evaluated data depends on the accuracy with which it has been documented and subsequently collected. The substance use group in this study included patients with benzodiazepine and narcotic exposure. On occasion, these drugs are administered by healthcare professionals during transport or upon admission to the emergency department. Additionally, in some cases, patient charts do not contain a complete list of home medications. Furthermore, many of the substances tested, including cocaine and cannabis, can elicit positive findings for several days after drug consumption. A distinction between drug use and/or exposure at the time of the ATV accident and iatrogenic exposure was frequently hard to attain.
5. Conclusions
This study contends that wearing a safety device and abstinence from substance exposure would decrease severity of injury, hospital LOS, and the incidence of ICU admission. Moreover, ATV riders exposed to substances prior to operating ATVs are less likely to wear helmets lending to a significant increase in the odds of having more severe injuries, higher hospital billing costs, and worse outcomes.
6. Practical applications
Modification of regulatory requirements should be considered in order to mandate the wearing of helmets during ATV operation. In addition, expansion of safety programs should be considered in an effort to improve availability, affordability and awareness of safe ATV practices.
Biographies
Dr. Audis Bethea is a graduate of the Medical University of South Carolina where he received B.S. and Doctorate of Pharmacy degrees. In 2001–2003 he completed PGY1 Pharmacy Practice and PGY2 Internal Medicine pharmacy residency programs at MCV Hospitals and Physicians/VCU Health Systems. Dr. Bethea has been employed at Charleston Area Medical Center (CAMC) since 2005 where he has practiced as a Clinical Pharmacy Specialist with the Trauma-Surgery service. In 2014 Dr. Bethea became the coordinator of CAMC’s Trauma Research Program and currently serves as CAMC’s Clinical Research Scientist for the WV Clinical and Translational Science Institute. Dr. Bethea is a member of the Society of Critical Care Medicine and is a Board Certified Pharmacotherapy Specialist through the Board of Pharmaceutical Specialties.
Damayanti Samanta works as a Senior Research Associate with the Center for Health Services and Outcomes Research atCharleston Area Medical Center in Charleston, WV. She received a Master of Science from the University of Louisiana in Lafayette, LA. Her work focuses on conducting analyses and coordinating trauma research studies. Her areas of research interest include epidemiology and outcomes in pediatric and adult trauma. She is a member of West Virginia Clinical and Translation Science Institute.
John A. Willis, MD is the President of Associated Radiologists, Inc. at Charleston Area Medical Center (CAMC) in Charleston, WV. He is a graduate of West Virginia University School of Medicine. He trained in diagnostic radiology at University Health Centers of Pittsburgh and radiologic pathology at the Armed Forces Institute of Pathology in Washington, D.C. Dr. Willis has been practicing since 1995 at CAMC and is board certified in diagnostic radiology. He is a member of American College of Radiology, Radiological Society of North America, and the American Roentgen Ray Society.
Franck C. Lucente, MD, FACS is the Medical Director of Surgical Intensive Care, Trauma and Emergency Services at Charleston Area Medical Center (CAMC) in Charleston, WV. He is a graduate of West Virginia University School of Medicine. He trained in general surgery at West Virginia University Charleston Division/CAMC and trauma-critical care at Washington Hospital Center. Dr. Lucente has been practicing since 1993 at CAMC. Dr. Lucente is a professor of surgery at West Virginia University, and is a Fellow of the American College of Surgeons and Critical Care Medicine. Dr. Lucente is board certified in surgery, surgical critical care, and neurocritical care neurologic subspecialties.
Julton Tomanguillo Chumbe, MD is the Research Assistant with Center for Health Services and Outcomes Research at Charleston Area Medical Center in Charleston, WV. He graduated from Cesar Vallejo University, Peru. He currently assists in the development and coordination of trauma research at CAMC. He is a member of American College of Surgeons and West Virginia Clinical and Translation Science Institute. Research interest includes critical care, trauma, and translational research.
Appendix A
Fig. 1.
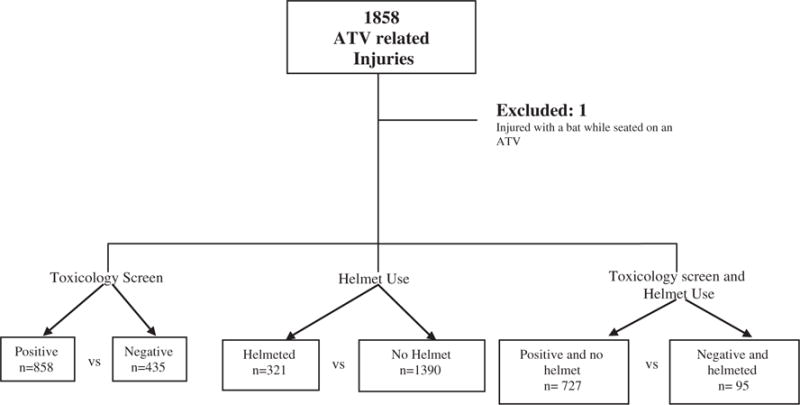
Study flow chart.
Footnotes
Conflict of interest statement
Audis Bethea has no conflict of interest to report.
Damayanti Samanta has no conflict of interest to report.
John Willis has no conflict of interest to report.
Frank C Lucente has no conflict of interest to report.
Julton Tomanguillo Chumbe has no conflict of interest to report.
Financial disclosure
Audis Bethea is a research scientist for the West Virginia Clinical Translational Science Institute. “Research reported in this publication was supported by the National Institute of General Medical Sciences of the National Institutes of Health under Award Number U54GM104942. The content is solely the responsibility of the authors and does not necessarily represent the official views of the National Institutes of Health.”
Damayanti Samanta is a member of the West Virginia Clinical Translational Science Institute. “Research reported in this publication was supported by the National Institute of General Medical Sciences of the National Institutes of Health under Award Number U54GM104942. The content is solely the responsibility of the authors and does not necessarily represent the official views of the National Institutes of Health.”
John A Willis has no financial disclosures.
Frank C Lucente has no financial disclosures.
Julton Tomanguillo Chumbe is a member of the West Virginia Clinical Translational Science Institute. “Research reported in this publication was supported by the National Institute of General Medical Sciences of the National Institutes of Health under Award Number U54GM104942. The content is solely the responsibility of the authors and does not necessarily represent the official views of the National Institutes of Health.”
References
- Adams LE, Aitken ME, Mullins SH, Miller BK, Graham J. Barriers and facilitators to all-terrain vehicle helmet use. Journal of Trauma and Acute Care Surgery. 2013;75(4 Suppl 3):S296–S300. doi: 10.1097/TA.0b013e318292421f. http://dx.doi.org/10.1097/TA.0b013e318292421. [DOI] [PubMed] [Google Scholar]
- Annual report of ATV-related deaths and injuries. Bethesda, MD: CPSC; 2013. ( http://www.cpsc.gov//Global/Research-and-Statistics/Injury-Statistics/Sports-and-Recreation/ATVs/2013-ATV-Annual-Rpt-of-ATV-Related-Deaths–Injuries.pdf, Accessed August 12, 2015) [Google Scholar]
- Balthrop PM, Nyland JA, Roberts CS, Wallace J, Van Zyl R, Barber G. Orthopedic trauma from recreational all-terrain vehicle use in central Kentucky: a 6-year review. The Journal of Trauma. 2007;62(5):1163–1170. doi: 10.1097/01.ta.0000229814.08289.9a. http://dx.doi.org/10.1097/01.ta.0000229814.08289.9a. [DOI] [PubMed] [Google Scholar]
- Bowman SM, Aitken ME, Helmkamp JC, Maham SA, Graham CJ. Impact of helmets on injuries to riders of all-terrain vehicles. Injury Prevention. 2009;15(1):3–7. doi: 10.1136/ip.2008.019372. http://dx.doi.org/10.1136/ip.2008.019372. [DOI] [PubMed] [Google Scholar]
- Hall AJ, Bixler D, Helmkamp JC, Kraner JC, Kaplan JA. Fatal all-terrain vehicle crashes: injury types and alcohol use. American Journal of Preventive Medicine. 2009;36(4):311–316. doi: 10.1016/j.amepre.2008.11.019. http://dx.doi.org/10.1016/j.amepre.2008.11.019. [DOI] [PubMed] [Google Scholar]
- Helmkamp JC, Furbee PM, Coben JH, Tadros A. All-terrain vehicle-related hospitalizations in the United States, 2000–2004. American Journal of Preventive Medicine. 2008;34(1):39–45. doi: 10.1016/j.amepre.2007.09.016. http://dx.doi.org/10.1016/j.amepre.2007.09.016. [DOI] [PubMed] [Google Scholar]
- State ATV information. Bethesda, MD: CPSC; http://www.cpsc.gov/en/Safety-Education/Safety-Education-Centers/ATV-Safety-Information-Center/State-ATV-Information/ (Accessed August 13, 2015) [Google Scholar]
- Mazotas I, Toal M, Borrup K, Saleheen H, Hester AL, Copeland D, Campbell BT. A prospective, multi-institutional study of pediatric all-terrain vehicle crashes. Journal of Trauma and Acute Care Surgery. 2014;77(1):103–108. doi: 10.1097/TA.0000000000000266. http://dx.doi.org/10.1097/TA.0000000000000266. [DOI] [PubMed] [Google Scholar]
- Mullins RJ, Brand D, Lenfesty B, Newgard CD, Hedges JR, Ham B. Statewide assessment of injury and death rates among riders of off-road vehicles treated at trauma centers. Journal of the American College of Surgeons. 2007;204(2):216–224. doi: 10.1016/j.jamcollsurg.2006.10.025. http://dx.doi.org/10.1016/j.jamcollsurg.2006.10.025. [DOI] [PubMed] [Google Scholar]
- Rodgers GB. The effectiveness of helmets in reducing all-terrain vehicle injuries and deaths. Accident; Analysis and Prevention. 1990;22(1):47–58. doi: 10.1016/0001-4575(90)90006-7. http://dx.doi.org/10.1016/0001-4575(90)90006-7. [DOI] [PubMed] [Google Scholar]
- Rodgers GB, Adler P. Risk factors for all-terrain vehicle injuries: a national case–control study. American Journal of Epidemiology. 2001;153(11):1112–1118. doi: 10.1093/aje/153.11.1112. http://dx.doi.org/10.1093/aje/153.11.1112. [DOI] [PubMed] [Google Scholar]
- Rostas JW, Donnellan KA, Gonzalez RP, Brevard SB, Ahmed N, Rogers EA, Simmons JD. Helmet use is associated with a decrease in intracranial hemorrhage following all-terrain vehicle crashes. Journal of Trauma and Acute Care Surgery. 2014;76(1):201–204. doi: 10.1097/TA.0b013e3182a994ff. http://dx.doi.org/10.1097/TA.0b013e3182a994ff. [DOI] [PubMed] [Google Scholar]
- Smith SM, Middaugh JP. Injuries associated with three-wheeled, all-terrain vehicles, Alaska, 1983 and 1984. Journal of the American Medical Association. 1986;255(18):2454–2458. [PubMed] [Google Scholar]
- White LC, McKinnon BJ, Hughes CA. Etiologies of pediatric craniofacial injuries: a comparison of injuries involving all-terrain vehicles and golf carts. International Journal of Pediatric Otorhinolaryngology. 2013;77(3):414–417. doi: 10.1016/j.ijporl.2012.11.043. http://dx.doi.org/10.1016/j.ijporl.2012.11.043. [DOI] [PubMed] [Google Scholar]
- Williams AF, Oesch SL, McCartt AT, Teoh ER, Sims LB. On-road all-terrain vehicle (ATV) fatalities in the United States. Journal of Safety Research. 2014;50:117–123. doi: 10.1016/j.jsr.2014.05.001. http://dx.doi.org/10.1016/j.jsr.2014.05.001. [DOI] [PubMed] [Google Scholar]