Abstract
Background & objectives:
The relevance of the gut microbiota to human health is increasingly appreciated. The objective of this study was to compare the gut microbiota of a group of adult tribals with that of healthy adult villagers in Tamil Nadu, India.
Methods:
Faeces were collected from 10 healthy tribal adults (TAs) in the Jawadhi hills and from 10 healthy villagers [rural adults (RAs)] in Vellore district, Tamil Nadu. DNA was extracted, and 456 bp segments comprising hypervariable regions 3 and 4 of the 16S rRNA gene were amplified, barcoded and 454 sequenced.
Results:
Totally 227,710 good-quality reads were analyzed. TAs consumed a millets-based diet, ate pork every day, and did not consume milk or milk products. RAs consumed a rice-based diet with meat intake once a week. In both groups, Firmicutes was the most abundant phylum, followed by Proteobacteria, Bacteroidetes and Actinobacteria. The median Firmicutes-to-Bacteroidetes ratio was 34.0 in TA and 92.9 in RA groups. Actinobacteria were significantly low in TA, possibly due to non-consumption of milk. Clostridium constituted the most abundant genus in both groups, but was significantly more abundant in TAs than RAs, while Streptococcus was significantly more abundant in RA (P<0.05). Analyses of genetic distance revealed that the microbiota were distinctly different between TA and RA, and principal component analysis using 550 distinct taxonomically identifiable sequences revealed a clear separation of microbiota composition in the two groups. Phylogenetic analysis of major microbiota indicated clustering of microbial groups at different major branch points for TAs and RAs.
Interpretation & conclusions:
Phylum Firmicutes and genus Clostridium constituted the bulk of the faecal microbiota, while significant differences in composition between the groups were probably due to differences in diet and lifestyle.
Keywords: Clostridium, deep sequencing, diet, faecal, lifestyle, Streptococcus
The human intestinal microbiota is a complex ecosystem that is established at birth and continues to change through childhood and adolescence to adult life1,2. It plays an important role in determining health, immune status and metabolism of the host3,4. The composition of the microbiota is influenced by many factors of which possibly the most important is the dietary habit of the individual. A study, drawing data from several countries, has suggested that the human faecal microbiome is characterized by three enterotypes that are independent of nation or continent5. While short-term dietary interventions affected microbiome composition, these did not affect the enterotype which was more dependent on long-term dietary patterns6. Diet and microbiota composition together influence concentrations of fermentation products such as short-chain fatty acids (SCFAs) which are not only nutritive but have multiple effects beyond this on metabolism and immunity7,8,9, leading to health benefits such as reduction of dyslipidaemia and prevention of colon cancer. There is a considerable interest in the effect of dietary practices and lifestyles on the gut microbiota because these may impact nutrition and health. For instance, conditions as diverse as obesity and colorectal cancer are known to be associated with variations in microbiota composition10,11,12,13.
The gut microbiota is associated with a state of subclinical inflammation that may contribute to some of the chronic diseases that affect humans. The rise in such diseases has been attributed to a variety of causes including increased hygiene and to changes in gut microbiota occasioned by changes in diet and lifestyle14,15,16. Traditional lifestyles, associated with diets consisting of crude rather than highly processed foods, have thus been considered to provide health benefits including reduced incidence of inflammatory diseases, and a study comparing the gut microbiota of children in Africa with children in Europe identified major differences between the two groups that were hypothesized to be of significance in determining health in later life17.
Tribal populations in southern India are located in the hilly regions of the Eastern and Western Ghats. One such population resides in the Jawadhi hills, a range of hills running north-south to a length of 64 km and a width of 26 km in northern Tamil Nadu, India18,19. These hills are home to 80,000 tribals called the Malaiyalis (people of the hills) who live in approximately 175 villages. In contrast to the average rural residents of Tamil Nadu, the Jawadhi residents cultivate and eat millets as their staple cereal. Due to cultural reasons, they do not consume any products derived from cows including milk, curd and beef. The present study was undertaken to examine the faecal metagenome of the tribal residents of the Jawadhi hills and to compare this with the faecal metagenome of the residents of a representative village in the plains of northern Tamil Nadu, and to compare variability between individuals in each group as well as between the two groups.
Material & Methods
The study was undertaken in Vellore district of Tamil Nadu State between 2010 and 2011. Participants included 10 healthy residents of a village [tribal adults (TAs)] located in the Jawadhi hill area of Vellore district of Tamil Nadu and 10 healthy residents [rural adults (RAs)] of a village also located in the Vellore district, approximately 40 km distant from the village in the hills. Permission of the village council leader or headman was obtained to apprise them of the nature and purpose of the study. Participants were chosen from independently living individuals aged 18-60 yr who were in apparent good health and were not known to have any disease. Individuals who had taken any medication in the previous three months were excluded from the study. Participants were included as a sample of convenience. Demographic details were recorded, and dietary intakes of food groups and macronutrients were calculated from 24 h dietary recall and compared with the recommended dietary allowances for Indians20. The team visited the villages early in the morning on the appointed date for stool collection and transported the stool containers on ice to the laboratory within two hours of collection. The samples were stored at -70°C to be processed in batches for DNA extraction. The study was approved by the Ethics and Research Committees of the Christian Medical College, Vellore, India.
DNA was extracted from approximately 100 mg (wet weight) of faecal sample using QIAamp DNA stool mini kits (QIAGEN GmbH, Hilden, Germany), following a slight modification of the manufacturer's instructions. The modification involved heating the faecal suspension at 80°C for one hour followed by proteinase K digestion at 70°C for 20 min as has been done in our previous studies1,2. DNA was eluted in buffer AE provided in the kit. The DNA was quantitated using SYBR Green, and then amplified using the primers 347F (5'-GGAGGCAGCAGTRRGGAAT-3') and 803R (5'-CTACCRGGGTATCTAATCC) to obtain a 456 bp amplicon that contained hypervariable regions (HVRs) 3 and 4 of the 16S rRNA gene. This primer set has earlier been validated for 454 pyrosequencing of complex microbiomes, and reportedly has the ability to anneal >98 per cent of all 16S rRNA genes in the RDP database21. This was rechecked by using in silico polymerase chain reaction (PCR) against 16S rRNA genes for 593 bacterial species21. For the present study, PCR was carried out with 50 ng DNA, PCR buffer, 300 nM of each primer, 200 μM of dNTPs and 2.5 U of Jumpstart Taq DNA polymerase (Sigma Genosys, Bangalore, India) in 100 μl volume, with initial denaturation at 95°C, 35 cycles of denaturation at 95°C for 30 sec, annealing at 47°C for 30 sec and extension at 72°C for 1 min, followed by the final extension at 72°C for 10 min. The PCR product, which was 456 bp in size, was scaled up and purified using PureLink PCR purification kits (K-3100-01, Invitrogen Life Science, Carlsbad, CA, USA) and quantified by fluorimetry using SYBR Green22. PCR-purified product yield ranged from 1.31 to 5.43 μg (median 2.15) and OD260/280 was >1.8. The PCR products underwent quality control on an Agilent Bioanalyzer high-sensitivity DNA chip (Waldbronn, Germany) with detected median fragment length of 518 bp (range 449-545 bp). DNA quantity ranged from 3.2 × 10⁸ to 7.3 × 10⁸(median 5.3 × 10⁸) mol/μl in the TA group to 2.9 × 10⁸ to 3.4 × 10⁹(median 5.8 × 10⁸) mol/μl in the RA group. DNA libraries were prepared separately for 10 DNA samples from the TA group and 10 from the RA group using multiplex identifier sequence tags (MID-adaptors). The 10 TA libraries and the 10 RA libraries were pyrosequenced in two regions of a 1/8 Picotiter plate in a Roche 454 GLX Titanium sequencer (Roche Diagnostics GmbH, Mannheim, Germany) at Macrogen (Seoul, Korea). Preparing different libraries with different MIDs allowed multiplexing of the sequencing run. The sequenced reads were deconvoluted after the sequencing run by the data analysis software provided with the instrument. The data thus generated were processed using the Roche GS FLX software (v 2.5.3) (Roche Diagnostics GmbH, Mannheim, Germany). Images were processed and normalized after subtracting background and the information captured in composite wells format files. The reads were filtered and trimmed, generating flow grams and base called sequences with quality scores, following which all high-quality information was output to standard flowgram format (SFF) files, one per PicoTiterPlate region. The barcode tags were used to segregate reads from each sample, and the number of errors allowed was set at 0 bases. A search was done to find regions of local similarity between sequences using the Silva rRNA database (http://www.arb-silva.de) and NCBI BLAST nucleotide database (https://blast.ncbi.nlm.nih.gov/Blast.cgi). An E-value of 0.01 was set, and hits which had the top five E-values were selected. Pairwise global alignment was done using Needleman-Wunsch global alignment algorithm to find the optimum alignment (including gaps) of two sequences along their entire length; the alignment was done on selected candidate hits to find the best aligned hit. The best hit selected from these steps was used to assign the taxonomic classification.
Further analysis of the data was made on the basis of the phylogenetic classification of the sequences from each individual. Trimmed sequences were classified at phylum to genus level using Ribosomal Database Project (RDP II) classifier and at species level using RDP II Seqmatch23,24. Five hundred and fifty unique taxa were identified and their occurrence in each of the 20 study participants was noted. Principal component analysis was done using these data, to determine whether the faecal microbial taxa clustered separately in the two groups. In addition, labelled FASTA sequences were aligned using Geneious Pro (version 5.4.6, www.geneious.com). A phylogenetic tree was built by the neighbour-joining method25 with genetic distance based on the Jukes-Cantor model26. Sample distance matrices were constructed based on the genetic distances between individuals within groups as well as individuals in different groups and shown as heat maps.
Statistical analysis: Fast UniFrac27 was used to calculate the P test significance and the UniFrac significance using 208 of the 210 abundant sequences. Of these sequences, 26 were represented in both groups, 95 were represented only in group 1 and 87 only in group 2. Both P test significance and UniFrac significance were calculated using 500 permutations. UniFrac was also used for the assessment of the sample distance matrix.
Results
TA comprised 10 (5 female) healthy villagers of mean age of 39.2±12.7 yr and RA comprised 10 (5 female) healthy villagers of mean age of 38.8±11.3 yr. TAs consisted of villagers whose diet was majorly composed of the cereal millets 'ragi' (finger millet, Eleusine coracana) and 'kambu' (pearl millet, Pennisetum glaucum). This group ate a moderate quantity of meat (largely pork) every day, but did not consume milk or milk products due to their religious beliefs. RAs consisted of villagers whose diet was composed largely of rice and lentils, and who consumed milk and curd every day but ate meat only once a week.
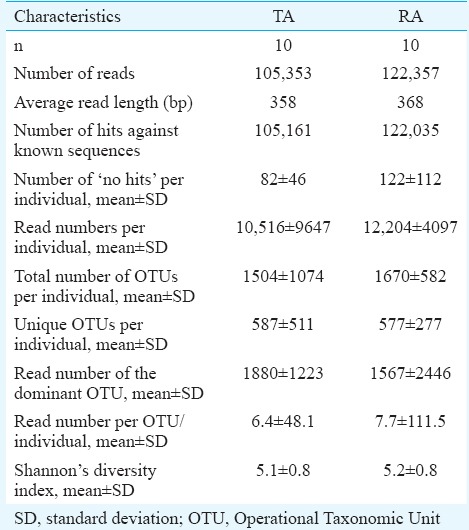
The general characteristics of the 16S rRNA gene pyrosequencing data are depicted in the Table. A total of 227,710 sequences (short reads) passed the initial quality control and were analyzed. The number of reads per individual ranged from 6341 to 18403 in the TA group and from 1705 to 31409 in the RA group; this difference was not significant. Taking each individual participant, 96-100 per cent of the sequences could be matched with sequences already available in the NCBI and/or Silva databases with identities ranging from 83 to 100 per cent. The matched sequences were sorted according to whether others in the group also exhibited similar sequences or whether they were sequences unique to that individual that were not identified in any of the 19 other participants in the metagenomic analysis. On an average, 1500 distinct microbial sequences were detected per individual, of which two-thirds were found in at least one other individual tested in this study while one-third were unique to that individual. The abundance of individual taxa was skewed, with a few taxa accounting for most of the sequences in each individual. The ability to successfully match the reads to published sequences was very high at the phylum level in both TA (99.9±0.03%, mean±SD) and RA (99.91±0.04%) groups. The percentage of sequences that could be identified at the genus level dropped considerably to 59.7±18.3 per cent for TA and 58.9±23.5 per cent for RA groups.
Table.
Analytical characteristics of the faecal metagenome in the tribal adult (TA) and rural adult (RA) groups
Firmicutes was the most abundant phylum (Fig. 1) in both groups, followed by Proteobacteria, Bacteroidetes and Actinobacteria. There were no significant differences between the two groups with respect to distribution at the phylum level. Genus assignment was not possible in about 40 per cent of the sequences from both groups. There were significant differences at the genus level between the two groups (Fig. 2). Bacteria belonging to genus Clostridium were significantly more abundant in the TA group (32.7%, 10.8-51.1) [median, interquartile range (IQR)] compared to the RA group (4.8%, 0.5-10.2). Bacteria belonging to genus Streptococcus were significantly (P<0.05) less abundant in the TA group (0.4%, 0.08-1.1) (median, IQR) than in the RA group (2.7, 0.3-34.8). Bacteroidetes (median, IQR) tended to be more abundant in TA (median 2.65%, range 0.3-6.8) compared to RA groups (median 0.45%, range 0.1-9.0) (P<0.05). Enterobacteriaceae (median, IQR) tended to be less abundant in the TA (0.4%, 0.08-1.1) than in the RA groups (1.2%, 0.4-2.4). The other major genera did not significantly differ between the TA and RA groups.
Fig. 1.
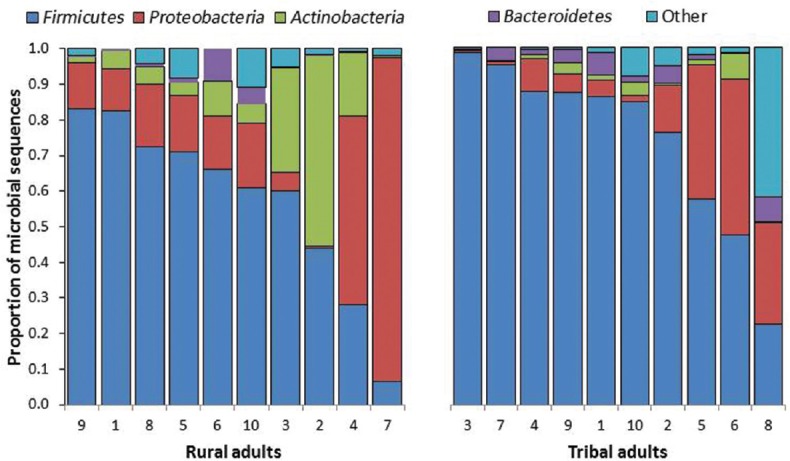
Frequency of microbial sequences at the phylum level. A comparison of tribal adults and rural adults. The stacked bars (each representing one individual participant) show the proportion contributed by each phylum.
Fig. 2.
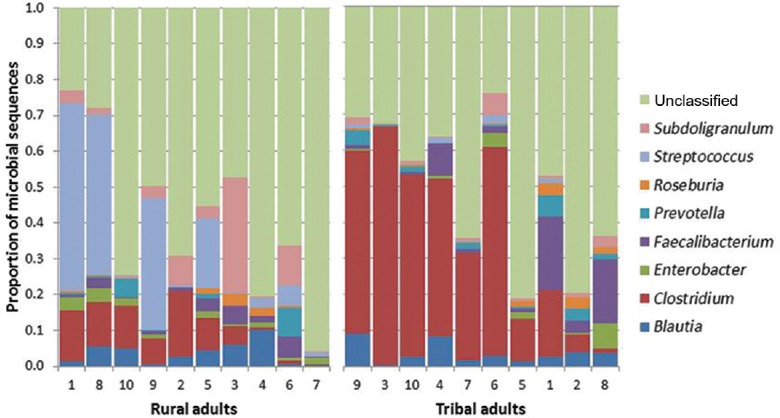
Frequency of microbial sequences at the genus level. A comparison of tribal adult and rural adult groups. The stacked bars (each representing one individual participant) show the proportion contributed by each genus.
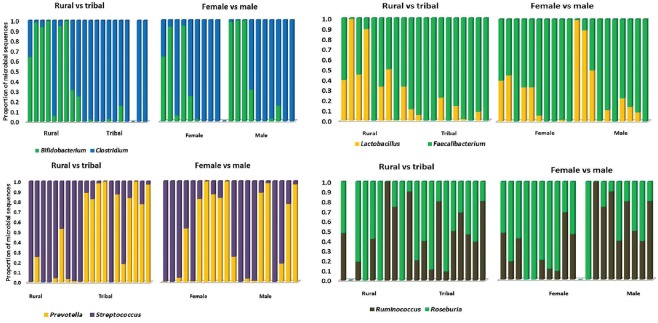
Analyses were done to determine the effect of community and gender on the abundance of genera in the 20 participants (Fig. 3). It was clear from this that the community from which the participants were drawn (i.e., TA or RA) was the major determinant of the differences for Bifidobacterium, Clostridium, Lactobacillus, Faecalibacterium, Prevotella and Streptococcus, whereas gender influences predominated for Roseburia and Ruminococcus.
Fig. 3.
Effect of community and gender on the relative abundance of specific genera of the faecal microbiota. Each pair of figures compares the effects of community (rural adult vs. tribal adults) or gender (males vs. females) on the proportion of the microbiome contributed by a specific organism. The first three panels show differences between the populations while in the bottom right panel gender appears to have predominant effect on the difference.
Principal component analysis of the distribution of 550 unique taxa showed that the TA and RA group participants clustered according to the community (TA or RA), with no overlap between the two groups of participants (Fig. 4).
Fig. 4.
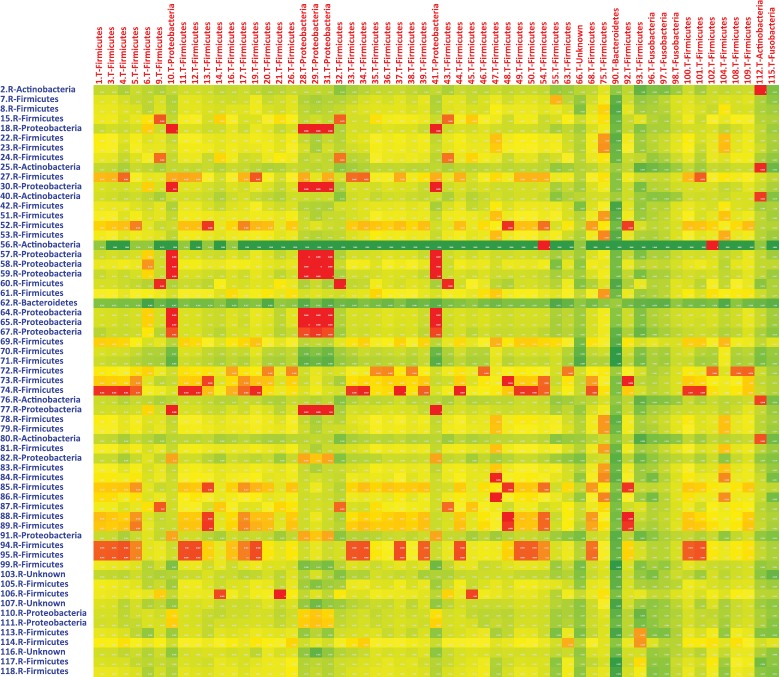
Heat map based on the phylogenetic distance between the dominant faecal bacterial taxa in the rural adult group compared to the tribal adult group. The 20 most dominant bacterial taxa in each participant were plotted by group, with tribal adults represented along the X axis and rural adults represented along the Y axis. Phylogenetic distances for each intersection were calculated, and a heat map was generated. Squares shaded red indicate phylogenetic distance <0.1 (closer identity), yellow <0.2 and green 0.3 or more (no identity).
The most abundant 20 sequences in each individual were identified. After deleting duplicates, 210 unique sequences from 20 participants were tagged according to their presence in individual members of the group. A sample distance matrix of genetic distances between the abundant taxa among RA and TA groups showed that only a minority of the TA group taxa coincided with those of the RA group while the majority showed genetic distances of 0.2 or greater (Fig. 5). A phylogenetic tree was generated using the 210 most abundant taxonomically identified microbial sequences (Fig. 6). The tree showed that microbial sequences from RA and TA groups clustered at different nodes that were distant and distinct from one another. If we assume as correct that the tribal and rural adults came from common ancestors who separated several generations earlier, it is likely that the faecal microbiota in these two populations evolved slightly differently from each other to achieve the current profile. The P test, using Fast UniFrac with 500 permutations, showed that clustering was significant (P<0.01) when sequences present only in TA were compared with sequences present only in RA or shared sequences.
Fig. 5.
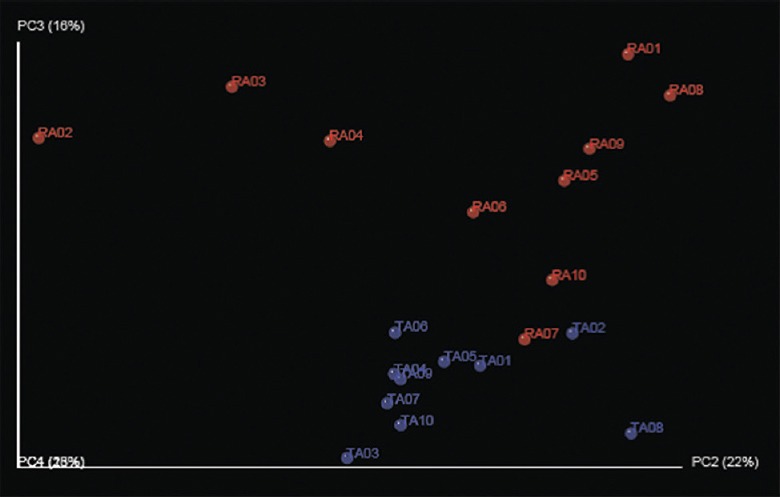
Principal component analysis done using 550 unique sequences identified in the two groups together, plotted according to their occurrence in tribal adult (TA) and rural adult (RA) groups. As can be seen, tribal adults and rural adults clustered quite separately.
Fig. 6.
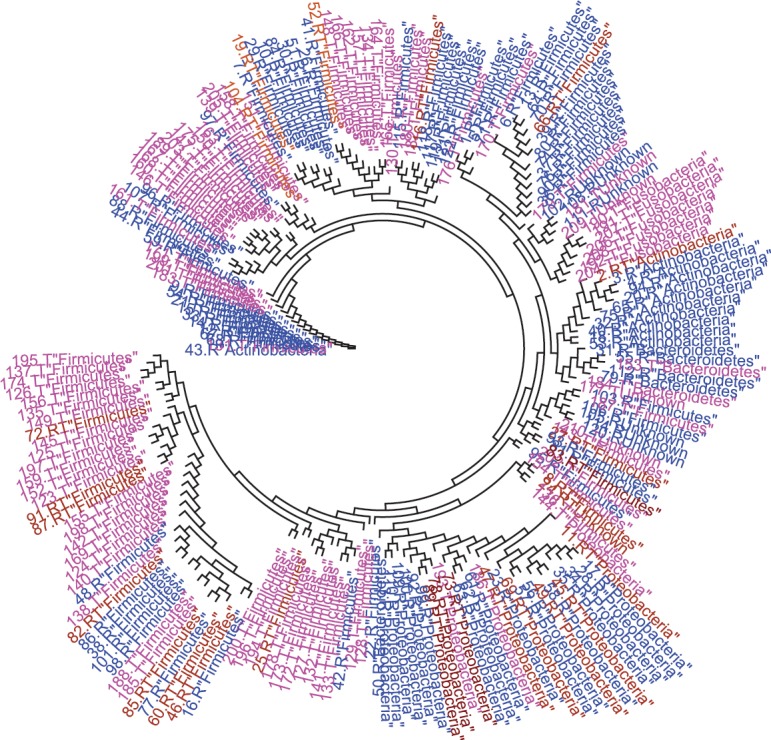
Phylogenetic tree showing the relative distribution of the most abundant taxa found in the tribal adult and rural adult groups. The taxa are coloured pink (tribal adult group only), blue (rural adult group only) or brown (common to both tribal adult and rural adult groups). It is noted that taxa from tribal adults and rural adults do not distribute equally but seem to be clustered in groups adjacent to each other, suggesting that each cluster may have derived from a common root but evolved over generations in slightly different ways.
Discussion
This study on faecal microbiota composition of healthy adults belonging to a tribal and a rural population of south India showed that there were significant differences in the faecal microbiota in these two populations and that they clustered along different patterns. The faecal microbiota in both groups of individuals was enriched with Firmicutes which were the most abundant phylum, with a median abundance of 85.9 per cent in TA and 63.5 per cent in RA groups compared to 40 per cent in most Western populations5. Firmicutes include bacteria belonging to Clostridial clusters IV and XIV including Ruminococcus, Roseburia and Faecalibacterium. All these bacteria ferment carbohydrates with the production of SCFAs28,29. SCFAs are a source of energy to the colonic epithelium, influence metabolism in other parts of the body, especially the liver, and help in epithelial restitution and recovery from damage in the colon7. Other members of the Firmicutes include Lactobacillus, Veillonella and Streptococcus, many of which are also beneficial to human health through metabolic and immune effects.
The next most abundant phylum in both groups was Proteobacteria which showed an abundance of 7.1 per cent in TA and 15.5 per cent in RA groups. Proteobacteria are generally much less abundant in Western populations, constituting <1 per cent of the faecal microbiota30. Proteobacteria are Gram-negative bacteria and include many facultative anaerobic organisms such as Escherichia, Enterobacter and Klebsiella and also pathogens such as Vibrio, Salmonella, Shigella and Campylobacter. Drinking contaminated water, frequent gastrointestinal infections and increased oxygen tension in the colonic lumen may all be potential reasons for the observed abundance of Proteobacteria in the faeces of the studied populations.
Bacteria belonging to phylum Actinobacteria were found with an abundance of 1.2 per cent in TA and 5.25 per cent in RA groups. The abundance in the RA group was close to the reported 5 per cent abundance reported in the faeces of Western individuals5,31. One of the major components of faecal Actinobacteria is the bifidobacterium. The other major components are the Coriobacteriaceae which include genera such as Collinsella, Eggerthella and Atopobium. The presence of galactooligosaccharides in milk and fructooligosaccharides in fruits has been considered to encourage the growth of Bifidobacterium species, and the relative scarcity of Actinobacteria in the TA group might be due to the fact that they did not consume milk or milk products and very little fruit.
Bacteroidetes, which are abundant in many Western populations constituting around 20 per cent of the faecal microbiota5, were comparatively rare in both TA and RA groups. The phylum Bacteroidetes harbours many microbial genera including Bacteroides and Prevotella. The ratio of Firmicutes to Bacteroidetes has been used as a measure of health, with higher ratio favouring eubiosis and lower ratio favouring dysbiosis32. If one were to use this as a sole measure of eubiosis, both the TA group (median ratio of 34.0) and the RA group (median ratio of 92.9) were strongly tilted in favour of a beneficial gut microbiota when compared to Western adults who have a median Firmicutes to Bacteroidetes ratio of approximately 10.932. A high Firmicutes to Bacteroidetes ratio was associated with obesity in initial studies13. However, the importance of the Firmicutes to Bacteroidetes ratio in obesity has been questioned, and a comparison of obese and lean twin pairs suggested that abundance of Actinobacteria (rather than Firmicutes) was associated with obesity33,34. None of our participants was obese. The abundance of Firmicutes in both TA and RA groups probably reflected the fact that the diet in both groups was composed largely of cereals which provided poorly absorbed carbohydrates encouraging the growth of microbes belonging to phylum Firmicutes.
Clostridium was the most abundant genus in both groups, but was significantly more abundant in the TA group. Streptococcus was more abundant in the RA group compared to the TA group. Based on the proportions of microbial sequences belonging to genus Bacteroides, Prevotella and Ruminococcus, three enterotypes have been described in humans5, but we were unable to assign our two groups to any of these enterotypes as the proportions in our participants were quite different from any of the three proposed enterotypes.
Our study had several limitations. Only taxonomic data were examined using amplification of HVRs 3 and 4 of the 16S rRNA gene. Thus, interpretation of metabolic function in these two groups was not possible. Since only HVRs 3 and 4 were amplified, it was not always possible to assign taxa at the genus or species level. The data pertained only to adult populations and this particular study did not evaluate differences at different age levels.
In conclusion, this study provided interesting and hitherto unavailable data on gut microbial communities present in adult tribal and rural individuals in south India. It would be interesting to determine to what extent these gut microbiota patterns occur in other geographic regions of India.
Acknowledgment
This study was supported by grant no. BT/PR-10769/FNS/20/384/2008 from the Department of Biotechnology, Government of India, New Delhi.
Footnotes
Conflicts of Interest: None.
References
- 1.Kabeerdoss J, Ferdous S, Balamurugan R, Mechenro J, Vidya R, Santhanam S, et al. Development of the gut microbiota in southern Indian infants from birth to 6 months: A molecular analysis. J Nutr Sci. 2013;2:e18. doi: 10.1017/jns.2013.6. [DOI] [PMC free article] [PubMed] [Google Scholar]
- 2.Balamurugan R, Janardhan HP, George S, Chittaranjan SP, Ramakrishna BS. Bacterial succession in the colon during childhood and adolescence: Molecular studies in a Southern Indian village. Am J Clin Nutr. 2008;88:1643–7. doi: 10.3945/ajcn.2008.26511. [DOI] [PubMed] [Google Scholar]
- 3.Kau AL, Ahern PP, Griffin NW, Goodman AL, Gordon JI. Human nutrition, the gut microbiome and the immune system. Nature. 2011;474:327–36. doi: 10.1038/nature10213. [DOI] [PMC free article] [PubMed] [Google Scholar]
- 4.Ramakrishna BS. Role of the gut microbiota in human nutrition and metabolism. J Gastroenterol Hepatol. 2013;28(Suppl 4):9–17. doi: 10.1111/jgh.12294. [DOI] [PubMed] [Google Scholar]
- 5.Arumugam M, Raes J, Pelletier E, Le Paslier D, Yamada T, Mende DR, et al. Enterotypes of the human gut microbiome. Nature. 2011;473:174–80. doi: 10.1038/nature09944. [DOI] [PMC free article] [PubMed] [Google Scholar]
- 6.Wu GD, Chen J, Hoffmann C, Bittinger K, Chen YY, Keilbaugh SA, et al. Linking long-term dietary patterns with gut microbial enterotypes. Science. 2011;334:105–8. doi: 10.1126/science.1208344. [DOI] [PMC free article] [PubMed] [Google Scholar]
- 7.Ramakrishna BS, Roediger WEW. Bacterial short chain fatty acids: Their role in gastrointestinal disease. Dig Dis. 1990;8:337–45. doi: 10.1159/000171266. [DOI] [PubMed] [Google Scholar]
- 8.Hosseini E, Grootaert C, Verstraete W, Van de Wiele T. Propionate as a health-promoting microbial metabolite in the human gut. Nutr Rev. 2011;69:245–58. doi: 10.1111/j.1753-4887.2011.00388.x. [DOI] [PubMed] [Google Scholar]
- 9.Meijer K, de Vos P, Priebe MG. Butyrate and other short-chain fatty acids as modulators of immunity: What relevance for health? Curr Opin Clin Nutr Metab Care. 2010;13:715–21. doi: 10.1097/MCO.0b013e32833eebe5. [DOI] [PubMed] [Google Scholar]
- 10.Balamurugan R, Rajendiran E, George S, Samuel GV, Ramakrishna BS. Real-time polymerase chain reaction quantification of specific butyrate-producing bacteria, Desulfovibrio and Enterococcus faecalis in the feces of patients with colorectal cancer. J Gastroenterol Hepatol. 2008;23:1298–303. doi: 10.1111/j.1440-1746.2008.05490.x. [DOI] [PubMed] [Google Scholar]
- 11.Candela M, Guidotti M, Fabbri A, Brigidi P, Franceschi C, Fiorentini C. Human intestinal microbiota: Cross-talk with the host and its potential role in colorectal cancer. Crit Rev Microbiol. 2011;37:1–14. doi: 10.3109/1040841X.2010.501760. [DOI] [PubMed] [Google Scholar]
- 12.Balamurugan R, George G, Kabeerdoss J, Hepsiba J, Chandragunasekaran AM, Ramakrishna BS. Quantitative differences in intestinal Faecalibacterium prausnitzii in obese Indian children. Br J Nutr. 2010;103:335–8. doi: 10.1017/S0007114509992182. [DOI] [PubMed] [Google Scholar]
- 13.Turnbaugh PJ, Ley RE, Mahowald MA, Magrini V, Mardis ER, Gordon JI. An obesity-associated gut microbiome with increased capacity for energy harvest. Nature. 2006;444:1027–31. doi: 10.1038/nature05414. [DOI] [PubMed] [Google Scholar]
- 14.Okada H, Kuhn C, Feillet H, Bach JF. The 'hygiene hypothesis' for autoimmune and allergic diseases: An update. Clin Exp Immunol. 2010;160:1–9. doi: 10.1111/j.1365-2249.2010.04139.x. [DOI] [PMC free article] [PubMed] [Google Scholar]
- 15.West CE, Jenmalm MC, Prescott SL. The gut microbiota and its role in the development of allergic disease: A wider perspective. Clin Exp Allergy. 2015;45:43–53. doi: 10.1111/cea.12332. [DOI] [PubMed] [Google Scholar]
- 16.Penders J, Gerhold K, Thijs C, Zimmermann K, Wahn U, Lau S, et al. New insights into the hygiene hypothesis in allergic diseases: Mediation of sibling and birth mode effects by the gut microbiota. Gut Microbes. 2014;5:239–44. doi: 10.4161/gmic.27905. [DOI] [PMC free article] [PubMed] [Google Scholar]
- 17.De Filippo C, Cavalieri D, Di Paola M, Ramazzotti M, Poullet JB, Massart S, et al. Impact of diet in shaping gut microbiota revealed by a comparative study in children from Europe and rural Africa. Proc Natl Acad Sci U S A. 2010;107:14691–6. doi: 10.1073/pnas.1005963107. [DOI] [PMC free article] [PubMed] [Google Scholar]
- 18.Thurston E, Rangachari K. Castes and tribes of Southern India. Madras: Government Press; 1909. [Google Scholar]
- 19.Chakrabarti SB. Social science and social concern. Delhi: Mittal Books; 1988. [Google Scholar]
- 20.Gopalan C, Rama Sastri BV, Balasubramanian SC. Nutritive values of Indian foods. New Delhi: Indian Council of Medical Research; 2004. [PubMed] [Google Scholar]
- 21.Nossa CW, Oberdorf WE, Yang L, Aas JA, Paster BJ, Desantis TZ, et al. Design of 16S rRNA gene primers for 454 pyrosequencing of the human foregut microbiome. World J Gastroenterol. 2010;16:4135–44. doi: 10.3748/wjg.v16.i33.4135. [DOI] [PMC free article] [PubMed] [Google Scholar]
- 22.Leggate J, Allain R, Isaac L, Blais BW. Microplate fluorescence assay for the quantification of double stranded DNA using SYBR Green I dye. Biotechnol Lett. 2006;28:1587–94. doi: 10.1007/s10529-006-9128-1. [DOI] [PubMed] [Google Scholar]
- 23.Wang Q, Garrity GM, Tiedje JM, Cole JR. Naive Bayesian classifier for rapid assignment of rRNA sequences into the new bacterial taxonomy. Appl Environ Microbiol. 2007;73:5261–7. doi: 10.1128/AEM.00062-07. [DOI] [PMC free article] [PubMed] [Google Scholar]
- 24.Cole JR, Wang Q, Cardenas E, Fish J, Chai B, Farris RJ, et al. The ribosomal database project: Improved alignments and new tools for rRNA analysis. Nucleic Acids Res. 2009;37:D141–5. doi: 10.1093/nar/gkn879. [DOI] [PMC free article] [PubMed] [Google Scholar]
- 25.Saitou N, Nei M. The neighbor-joining method: A new method for reconstructing phylogenetic trees. Mol Biol Evol. 1987;4:406–25. doi: 10.1093/oxfordjournals.molbev.a040454. [DOI] [PubMed] [Google Scholar]
- 26.Jukes TH, Cantor CR. Evolution of Protein Molecules. New York: Academic Press; 1969. pp. 21–132. [Google Scholar]
- 27.Hamady M, Lozupone C, Knight R. Fast UniFrac: Facilitating high-throughput phylogenetic analyses of microbial communities including analysis of pyrosequencing and PhyloChip data. ISME J. 2010;4:17–27. doi: 10.1038/ismej.2009.97. [DOI] [PMC free article] [PubMed] [Google Scholar]
- 28.Russell WR, Hoyles L, Flint HJ, Dumas ME. Colonic bacterial metabolites and human health. Curr Opin Microbiol. 2013;16:246–54. doi: 10.1016/j.mib.2013.07.002. [DOI] [PubMed] [Google Scholar]
- 29.Flint HJ, Scott KP, Louis P, Duncan SH. The role of the gut microbiota in nutrition and health. Nat Rev Gastroenterol Hepatol. 2012;9:577–89. doi: 10.1038/nrgastro.2012.156. [DOI] [PubMed] [Google Scholar]
- 30.Grice EA, Segre JA. The human microbiome: Our second genome. Annu Rev Genomics Hum Genet. 2012;13:151–70. doi: 10.1146/annurev-genom-090711-163814. [DOI] [PMC free article] [PubMed] [Google Scholar]
- 31.Ringel-Kulka T, Cheng J, Ringel Y, Salojärvi J, Carroll I, Palva A, et al. Intestinal microbiota in healthy U.S. young children and adults – A high throughput microarray analysis. PLoS One. 2013;8:e64315. doi: 10.1371/journal.pone.0064315. [DOI] [PMC free article] [PubMed] [Google Scholar]
- 32.Mariat D, Firmesse O, Levenez F, Guimaraes V, Sokol H, Doré J, et al. The Firmicutes/Bacteroidetes ratio of the human microbiota changes with age. BMC Microbiol. 2009;9:123. doi: 10.1186/1471-2180-9-123. [DOI] [PMC free article] [PubMed] [Google Scholar]
- 33.Schwiertz A, Taras D, Schäfer K, Beijer S, Bos NA, Donus C, et al. Microbiota and SCFA in lean and overweight healthy subjects. Obesity (Silver Spring) 2010;18:190–5. doi: 10.1038/oby.2009.167. [DOI] [PubMed] [Google Scholar]
- 34.Turnbaugh PJ, Hamady M, Yatsunenko T, Cantarel BL, Duncan A, Ley RE, et al. A core gut microbiome in obese and lean twins. Nature. 2009;457:480–4. doi: 10.1038/nature07540. [DOI] [PMC free article] [PubMed] [Google Scholar]


