

Summary
Cancer cell lines are major model systems for mechanistic investigation and drug development. However, protein expression data linked to high-quality DNA, RNA and drug screening data have not been available across a large number of cancer cell lines. Using reverse-phase protein arrays, we measured expression levels of ∼230 key cancer-related proteins in >650 independent cell lines, many of which have publically available genomic, transcriptomic and drug screening data. Our dataset recapitulates the effects of mutated pathways on protein expression observed in patient samples, and demonstrates that proteins and particularly phosphoproteins provide information for predicting drug sensitivity that is not available from the corresponding mRNAs. We also developed a user-friendly bioinformatic resource, MCLP, to help serve the biomedical research community.
Introduction
Cancer cell lines are major model systems for investigating cancer mechanisms and developing effective therapies. With the advance of high-throughput genome characterization technologies, several studies have systematically characterized a large number of cancer cell lines for mutations, copy number alterations and gene expression profiles, and these studies represent valuable resources for the cancer research community (Barretina et al., 2012; Garnett et al., 2012; Klijn et al., 2015). Importantly, comprehensive drug response and multiplexed genomic manipulation data are rapidly emerging across large datasets (Marcotte et al., 2016; Seashore-Ludlow et al., 2015). In contrast, although proteomic data is available for limited cell line sets such as the NCI-60 cell lines (Moghaddas Gholami et al., 2013; Nishizuka et al., 2003), there have been no large-scale proteomic data of human cancer cell lines. This is despite the fact that proteins comprise the basic functional units in biological processes and represent major targets for cancer therapy. Furthermore, our ability to impute protein levels and function from DNA and RNA levels is limited by posttranscriptional and posttranslational regulatory processes. Therefore, there is an urgent need to fill this gap, which would greatly contribute to the comprehensive molecular portrait and translational utility of cancer cell lines.
Reverse-phase protein arrays (RPPAs), which have been widely used to elucidate the molecular basis of human cancer, evaluate protein-based biomarkers, and investigate the mechanisms underlying sensitivity and resistance to cancer therapy, offer a powerful approach for this purpose (Cheung et al., 2015; Ince et al., 2015; Sheehan et al., 2005; Spurrier et al., 2008; Yang et al., 2015; Yang et al., 2013). This rapidly maturing quantitative antibody-based assay can assess a large number of protein markers in many samples in a cost-effective, sensitive and high-throughput manner (Hennessy et al., 2010; Nishizuka et al., 2003; Tibes et al., 2006). More recently, The Cancer Genome Atlas (TCGA) has employed this technology to characterize thousands of patient samples across a broad range of cancer types and generated the expression data of >200 total and phosphorylated protein markers in major signaling pathways, including PI3K, mTOR, MAPK, TGF-β, WNT, cell cycle, apoptosis, immune responsiveness, and DNA damage response (Akbani et al., 2014; Li et al., 2013). To serve the broader biomedical research community, we initiated the MD Anderson Cell Lines Project (MCLP) with the goal of characterizing a large number of cancer cell lines using the RPPA platform and presenting a bioinformatic resource for analyzing these data.
Results
Overview of protein expression data of cancer cell lines
We generated high-quality normalized protein expression data for 706 cell lines (including 651 independent cell lines) using the Cancer Center Support Grant supported RPPA platform (Experimental Procedures, Supplemental Experimental Procedures, Figure S1 and Table S1). The average number of protein markers (including both total and phosphorylated proteins) profiled per sample is 227. Many of the cell lines (65%) have been profiled at the DNA and RNA levels through other major cell line efforts such as the Cancer Cell Line Encyclopedia (CCLE), COSMIC Cell Lines Project, and a recent project from Genentech (Barretina et al., 2012; Garnett et al., 2012; Klijn et al., 2015) (Figure 1A); however, 246 cell lines are unique to our study. The MCLP cell lines encompass 19 lineages, with six lineages having more than 50 cell lines characterized (lung, blood, head and neck, breast, ovary, and skin) (Figure 1B).
Figure 1. Overview of the MCLP cell line dataset and associated molecular and drug data.

(A) Venn diagram of the MCLP cell line set with other large public cell line resources, including CCLE, COSMIC Cell Lines Project, and Genentech Cell Lines Project. (B) Distribution of MCLP cell lines in various lineages. (C) Heatmaps summarizing the publically available mRNA expression, copy number alteration, single nucleotide variation and drug sensitivity data. In the heatmaps, each vertical line in the top row represents a cell line in the MCLP set, and each line in other rows indicates the corresponding molecular data is available for that specific data type. The CTRPv2 drug sensitivity data were based on CCLE cell lines, and the GDSC data were based on COSMIC cell lines. (D) RPPA data reproducibility based on replicate samples of NCI60 cell lines. Random pairs were sampled from NCI60 cell lines only. (E) Correlations of derivative cell lines relative to random cell line pairs that were sampled from all cell lines surveyed. (F) Correlations of total- phosphorylated protein pairs relative to random protein pairs. Vertical dotted lines indicate the median values. See also Table S1 and Figure S1.
To enhance the utility of the MCLP, we collected genomic, transcriptomic and drug sensitivity data from our in-house and other major publicly available cell line resources (Barretina et al., 2012; Daemen et al., 2013; Garnett et al., 2012; Klijn et al., 2015; Seashore-Ludlow et al., 2015) (Figure 1C). The number of MCLP cell lines with available mRNA expression, copy number alteration, and single nucleotide variation data is 464, 456 and 418, respectively. For mRNA and copy number alteration data, our MCLP shares >300 cell lines with three major public cell line resources; for single nucleotide variation data, our MCLP shares >250 cell lines with two major public resources. For drug sensitivity data, both the Cancer Therapeutic Response Portal (CTRPv2, based on CCLE cell lines; Seashore-Ludlow et al., 2015) and Genomics of Drug Sensitivity in Cancer (GDSC) resources (Garnett et al., 2012) include >250 MCLP cell lines.
We performed several analyses to assess the quality of our RPPA data. To evaluate reproducibility, we generated the RPPA data of replicate samples of NCI-60 cell lines. The median value of the sample-wise Pearson correlations between the NCI-60 replicates was 0.92, which was substantially higher than that of random cell lines pairs sampled from NCI-60 cell lines, 0.46 (Z-score = 14.97, p = 6.15×10-51, Figure 1D, Figure S1D). Since some cell lines were derived from the same patient such as HEC-1-A and HEC-1-B or as derivative drug resistant and sensitive pairs (Table S1), we next calculated the sample-wise correlations between all derivative cell line pairs and compared them to random cell line pairs sampled from all the cell lines surveyed. We found that the correlations among the derivative pairs (median R = 0.87) were again much higher than those of random pairs (median R = 0.42, Z-score = 18.65, p = 6.77×10-78, Figures 1E, S1E). The positive correlations among random cell line pairs probably reflect the intrinsic similarities of protein expression profiles in cell lines, particularly in the same lineage. Indeed, the correlation of random pairs within a single lineage were higher than those sampled across lineages (Figure S1F). Finally, we assessed the protein-wise correlations between matched total and phosphorylated protein pairs such as AKT and AKT_pT308. Approximately 34% of the total-phosphorylated protein pairs showed a correlation of >0.5 while only 2% of random pairs exceeded the same cut off (Figure 1F). These results indicate that RPPA data can reliably capture information content across the cell lines and protein markers surveyed. Together, our study presents a robust RPPA protein expression dataset of the largest number of cancer cell lines with matched DNA, RNA profiling and drug sensitivity data. To avoid sample redundancy, we only retained one cell line from all derivative cell line pairs and focused on 651 independent cell lines for subsequent analyses.
Comparison of mRNA and protein expression in cancer cell lines
The RPPA-based characterization of the MCLP dataset with parallel transcriptomic data enabled us to investigate the relationship between mRNA and protein expression in a systematic manner. Among our MCLP cell lines, 369 cell lines (mainly from 11 lineages) have available mRNA expression data from the CCLE. We analyzed 250 proteins (including 188 total proteins and 62 phosphoproteins) with matching protein and RNA data. We found that the corresponding mRNA and protein pairs generally showed good correlations: 86.4% of the mRNA–protein pairs had a significantly positive correlation, whereas only 1.6% of the pairs showed a significantly negative correlation (false discovery rate [FDR] < 0.1). The significant negative correlations may arise due to regulatory feedback loops. The median Spearman rank correlation (Rs) across the 250 mRNA–protein pairs is ∼0.45, which is higher than that previously observed on patient samples (Akbani et al., 2014), potentially due to the ease of handling cell lines and preserving RNA and protein levels as well as the increased purity of cell line samples relative to clinical samples (Figure 2A). After filtering proteins with lower variations, the median correlations across lineages were further improved. Among the 11 lineage groups, the blood cell line group showed the lowest median correlation (Rs = 0.3, blood vs. other p = 1.12 ×10⁻⁶) because many of the protein markers, which were enriched for proteins of interest from solid tumors, are expressed at low levels in hematopoietic cell lines. Importantly, the mRNA–protein correlation varied greatly from protein to protein (especially for phosphorylated proteins), as noted in earlier studies (Gygi et al., 1999), which is presumably related to the complexity of the regulation of individual protein levels by microRNA and posttranscriptional processes such as degradation. We further examined the correlation of individual protein markers with mRNA expression across different cell line lineages. Based on the number of lineages in which the mRNA–protein pair showed a positive correlation (Rs > 0.5), protein markers were classified into three groups: proteins in group 1 showed no correlation in any lineage, those in group 2 showed a positive correlation in 1∼5 lineages, and proteins in group 3 showed a correlation in >5 lineages surveyed (Figure 2B, Table S2). The proportion of phosphoproteins was 51%, 22% and 6% in these groups (chi-squared test, p = 5.68 ×10⁻⁹), indicating that phosphoproteins tend to have lower correlations with their corresponding mRNAs (Tables S3, S4) and further that mRNA is not able to accurately reflect phosphoprotein levels.
Figure 2. Comparison of protein and mRNA expression in MCLP cell lines.

(A) Box plots of the expression correlations of matched mRNA and protein pairs in different lineages. Box boundaries mark the first and third quartiles, with the median in the center, and whiskers extending to 1.5 interquartile range from the boundaries. The striped box plots were based on the protein sets after excluding the 20% of proteins with the lowest coefficient of variation within each lineage. (B) Distribution of the number of lineages in which the mRNA and protein pair show a significant correlation. Three protein groups are shown in different colors. (C) Co-expression network of protein–protein expression. See also Tables S2-4 and Figure S2.
To obtain a view beyond individual proteins, we constructed a protein–protein co-expression network and assessed whether the same protein–protein connections could be identified at the mRNA level (Figure 2C). In total, we identified 72 strongly co-expressed protein pairs (|Rs| > 0.6, FDR < 0.01), among which 16 pairs represented total and phosphorylated proteins from the same gene and 56 pairs were from two genes. Among the co-expressed protein pairs, 41% also showed a significant mRNA expression correlation in the same direction (|Rs| > 0.2) including a small group of proteins related to the cell cycle (i.e., CDK1/CDK1_pY15/CRM1). When both proteins involved in an interaction were total proteins, nearly 60% of them were correlated at the mRNA level, which was significantly higher than that (24%) when at least one protein involved in an interaction was a phosphoprotein (chi-squared test, p = 0.031). Intriguingly, 4 pairs showed an mRNA co-expression correlation pattern opposite to that observed at the protein level, all of which involved the phosphorylated protein EPHA2_pT594, suggesting that phosphorylation of EPHA2 at T594 is regulated at a posttranslational level by complex mechanisms including negative (i.e., compensatory) feedback loops. We also performed a similar analysis based on mRNA co-expression networks and found that 40% of strongly correlated mRNA pairs are not correlated at the protein level (Figure S2). These results indicate that a protein and the corresponding mRNA contain considerably distinct information content in terms of expression and interrelationships with the expression levels of other proteins. Importantly, protein activity reflected by phosphoprotein levels could not be accurately inferred from mRNA expression data, supporting the importance of a comprehensive cell line proteomic resource.
Clustering pattern of cancer cell lines by protein expression
To understand the global protein expression patterns of cancer cell lines, we performed unsupervised clustering analysis on the 651 unique cancer cell lines based on proteins most commonly assessed across cell lines. Using a robust unsupervised consensus clustering algorithm (Monti et al., 2003), we identified 10 distinct cell line clusters (Figure 3A, Table S5). (An interactive, high-resolution, next generation clustered heat map is included in the web portal described below to allow exploration of specific proteins and cell lines.) These clusters showed significant correlations with mutated cancer genes, including PTEN (FDR = 0.027), KRAS (FDR= 7.7×10⁻⁴), ARID1A (FDR = 1.4×10⁻³), and PIK3CA (FDR = 4.6×10⁻⁶), suggesting that these aberrations contribute to alterations in total and phosphoprotein levels in a sufficient number of cell lines. For a set of cell lines with both mRNA and protein expression data, we performed unsupervised clustering analysis in parallel. We found that the resulting RPPA clusters showed more significant correlations with key mutated genes than the mRNA clusters (FDR < 0.1, 5 vs. 3, Figure S3A and B), suggesting that protein expression captures more signals from key genetic alterations than mRNA.
Figure 3. Clustered heatmap of MCLP cell lines based on RPPA protein expression data.
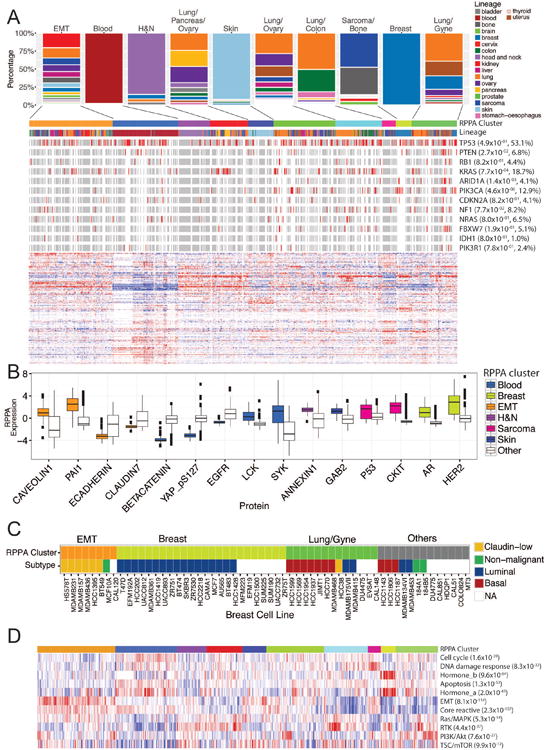
(A) Distribution of different lineages in clusters based on protein expression and a heatmap showing clustered patterns of 651 MCLP cell lines based on >200 protein markers. Mutation data in key cancer genes are shown in the bars (red, mutation; white, no mutation; and grey, NA) above the heatmap, with corrected p values (FDRs) indicating the significance of correlations with the clusters. (B) Box plots of key protein markers that distinct a cluster of interest from other clusters. (C) The alignment of the RPPA clusters and the tumor subtype of breast cancer cell lines. (D) Heatmap showing pathway scores across different protein clusters, with corrected p values (FDRs) indicating the significance of correlations with the clusters. A high-resolution, interactive clustered heat map is available at the MCLP data portal. See also Table S5 and Figure S3.
Among the RPPA clusters, four clusters were dominated by one lineage (i.e., >50% cell lines in the cluster came from the lineage) and we therefore named them by the major lineage in that cluster; while the other six clusters contained mixtures of cell lines and were therefore named by the lineage compositions or by key protein markers (Figure 3B). The epithelial–mesenchymal transition (EMT) cluster consisted of multiple lineages and was clearly defined by increased levels of EMT protein markers such as caveolin1 and PAI-1 and decreased levels of epithelial markers such as E-cadherin and claudin 7. Almost all the members (98%) of the blood cluster were composed of hematopoietic cell lines, which represented the most differential cluster, and was defined by lower expression of epithelial markers such as beta-catenin, phospho-YAP and EGFR and higher expression of LCK and SYK as expected based on the dominantly hematopoietic cell lineage. The head and neck cluster was dominated by head and neck cell lines plus a few lung and breast cancer lines, and was associated with high expression of annexin1, caveolin1 and EGFR. The skin cluster was dominated by melanoma and was associated with high levels of GAB2 and low levels of SYK. The sarcoma cluster was mainly composed of sarcoma and bone cell lines, and was associated with the higher levels of TP53 and c-KIT. The breast cluster consisted of breast cancer cell lines only, with increased AR and HER2 protein levels and represented primarily luminal breast cancer lines. The lung cancer cell lines were separated into four major clusters: lung/pancreas/ovary, lung/ovary, lung/colon, and lung/gyne. The “lung/gyne” cluster consisted of breast, ovarian and uterine cancer cell lines, and was marked by the activation of the PI3K/AKT pathway. The lung/colon cluster was a cross-lineage group that included the majority of the colon cancer cell lines. We further focused on a set of breast cell lines with known subtypes, and found a significant correlation between well-established breast cancer subtypes and RPPA clusters (p = 5.6×10⁻¹⁰, Figure 3C). Almost all cell lines of the claudin-low subtype were located in the EMT cluster; while luminal and basal cell lines were enriched in the breast and lung/gyne clusters, respectively. These results indicate that the RPPA pattern not only reflects the lineage/tissue information but also tumor subtype distinctions.
Given the clustering patterns, we further calculated pathway scores as previously described (Akbani et al., 2014) and found that these clusters showed distinct pathway associations (Figures 3D, S3C). In particular, the EMT cluster was clearly associated with an increased EMT score (p = 8.1×10-114, Figure S3C); the breast cluster was marked by high hormone pathway scores (hormone_a, p = 2.0×10-45, and hormone_b, p = 9.6×10-64, Figure S3C); and the sarcoma cluster was associated with an increased DNA damage response score (p = 8.3 ×10⁻³², Figure S3C).
Effects of mutations on protein expression patterns
TCGA studies have systematically identified genes and pathways frequently mutated in different cancer types. Understanding the effects of mutated genes on cancer signaling pathways is essential for developing cancer therapy. As commonly used cellular models, a key question is to what extent cancer cell lines capture the clinically relevant mutation patterns observed in cancer patient cohorts. Among our MCLP cell lines, single nucleotide variations of 250 cell lines have been characterized by CCLE with targeted sequencing; and five lineage groups (breast, ovary, colon, lung and uterus) had more than 10 cell lines, with respectively matched TCGA cancer types (BRCA, OV, COAD, LUAD/LUSC and UCEC). Due to the relatively small number of cell lines in each lineage, we focused on the four most frequently mutated pathways (or sub-networks), p53, PI3K, NOTCH and SWI/SNF complex signaling, each of which exhibited >10% mutation frequency in at least one of the five patient cohorts from a recent TCGA pan-cancer study (Leiserson et al., 2015) (Tables S6 and S7). We observed an overall strong concordance between TCGA patient cohorts and MCLP cell line lineages for these pathways in terms of the top mutated genes and their mutation frequencies (Figure 4A-4B, Tables S6 and S7).
Figure 4. Effects of mutated pathways on protein expression.

(A) Pattern of frequently mutated pathways in TCGA patient cohorts; red bars indicate presence of mutations in a sample. (B) Profiles of frequently mutated pathways in MCLP cell line lineages; red bars indicate presence of mutations in a sample. (C) Given the mutations of a p53 signaling pathway, a Circos plot showing proteins differentially expressed between TCGA WT and mutated breast cancer patient samples (FDR < 0.05) in the external layer and those differentially expressed between MCLP WT and mutated breast cancer cell lines in the middle layer. Color-coded fold changes: blue indicates downregulation relative to WT samples; red indicates upregulation. The inner layer: consistently up and down-regulated markers in TCGA and MCLP samples are indicated by red and blue respectively; inconsistently regulated markers are indicated by green. (D) Examples of individual proteins differentially expressed between WT and mutated samples in TCGA patients and MCLP cell lines. Box boundaries mark first and third quartiles, with the median in the center, and whiskers extending to 1.5 interquartile range from the boundaries. See also Tables S6, S7 and Figure S4.
We then examined the effects of the selected mutated pathways (Leiserson et al., 2015) on the expression of individual proteins. Given a mutated signaling pathway and a cell line lineage described above, we first identified proteins that were significantly differentially expressed between wild-type (WT) and mutated groups (t-test, FDR < 0.05, Tables S6 and S7). Only 5 lineages showed sufficient differential expression signals (>10 differentially expressed proteins in WT and mutated samples), so we focused on these lineages and assessed whether TCGA patient samples and MCLP cell lines showed similar patterns of dysregulated proteins (i.e., up- or down- regulated fold changes across the differential proteins). We found that 4 of the 5 comparisons showed overall similar mutation–protein patterns: mutations in PI3K signaling in breast cancer (Spearman rank Rs = 0.41, p < 0.001), lung cancer (Rs = 0.36, p = 0.36) and colon cancer (Rs = 0.83, p = 0.005); and mutations in p53 signaling pathway in breast cancer (Rs = 0.34, p < 0.001) (Figure 4C, Figure S4 and Tables S6, S7). The only exception was the effect of mutated p53 signaling pathway in lung cancer, where a weak negative correlation was detected. Thus, given a mutated pathway, individual proteins generally showed the similar patterns between the WT and mutant groups in both patient and cell line cohorts (Figure 4D).
The predictive power of protein markers in drug sensitivity
Our MCLP proteomic dataset is able to link protein and particular protein phosphorylation levels to drug sensitivity, which offers an opportunity to complement the assessment of genomic and transcriptomic activity as potential predictive biomarkers. Using the CTRPv2 drug sensitivity data for the cell lines with both protein and mRNA expression data, we performed a global comparison of protein markers and corresponding mRNA markers from the same genes in predicting drug sensitivity. Since quantitative drug sensitivity data tends to be noisy and less consistent (Haibe-Kains et al., 2013), we first employed a robust method to classify the cell lines into sensitive or resistant groups for a given drug (Cancer Cell Line Encyclopedia and Genomics of Drug Sensitivity in Cancer, 2015) and assessed whether a protein was significantly differentially expressed between the two cell line groups (Experimental Procedures). Then, given a drug and the mRNA and protein (total and phosphoproteins) from the same gene, drug sensitivity could be either associated with protein only, mRNA only, or both mRNA and protein levels (t-test, FDR < 0.1). We found that the relative abundance of these three types of markers varied across different drug families, suggesting complementary predictive power of RNA and protein analysis (Figure 5A). We next focused on the predictive powers of protein or mRNA levels of specific drug targets (e.g., EGFR family members and EGFR targeted drugs), the most important relationships in the clinic. We found that protein markers showed more significant associations than those of corresponding mRNAs (Figure 5B, Figure S5A-S5C). The predictive power of phosphoHER2 and phosphoEGFR was particularly apparent for EGFR pathway targeted drugs (Figure 5B). Furthermore, baseline phosphorylation level of AKT was a negative predictor of response to a subset of EGFR family inhibitors as expected. In terms of BRAF inhibitors, phosphoCRAF and to a degree phosphoARAF and VEGFR2 were predictors of resistance, observations that were not captured at RNA levels (Figure S5A). Similarly, total phosphoMEK levels were predictors of response to MEK inhibitors (Figure S5B). In addition to individual proteins, using the CTRPv2 drug data as the training set and the GDSC drug data as the test set, we compared the drug- sensitivity predictive power of protein or mRNA combinations and found that the protein-based classifiers showed better predictive power (based on the area under the curve [AUC] score in the receiver operating characteristic [ROC] curve) than the mRNA-based classifiers for a greater number of drugs (Experimental Procedures, Figure 5C). Taken together, these comparisons demonstrate that protein markers provide an improved ability to predict response to drugs and thus have the potential to function as predictive markers in the clinic.
Figure 5. Predictive power of protein markers on drug sensitivity.

(A) Numbers of only protein, only mRNA and both mRNA and protein markers significantly associated with different drug families (FDR < 0.1). (B) A heatmap showing the correlations of the sensitivity of EGFR pathway targeted drugs with protein, phosphoprotein and mRNA markers of their targeted genes. The color is based on the correlation direction and statistical significance, and insignificant correlations are shown in white. (C) Predictive power comparison of proteins vs. mRNAs based on multiple-marker classifiers using the AUC scores. (D) Volcano plot for EGFR_pY1068. (E) Volcano plot of EMT pathway score. Significant nodes (FDR < 0.1) are highlighted with green representing negative correlations and red representing positive correlations. See also Figure S5.
We next explored the relationship for drugs that target the EGFR family of receptors since these showed the strongest associations (Figure 5B). In both CTRPv2 and GDSC data, phosphoEGFR_Y1068 and phosphoHER2_Y1248 were strongly associated with response to drugs that targeted members of the EGFR family, as expected (Figures 5D, S5D-S5F). The associations were particularly clear for pan-inhibitors such as afatinib, canertinib, neratinib, and lapatinib, with weaker associations with EGFR selective drugs such as WZ-1-84, gefitinib and PD153035. Intriguingly, we observed marked sensitivity to saracatinib (SRC/Abl inhibitor) and ibrutinib, a BTK inhibitor. SRC is a downstream mediator for EGFR, and saracatinib has shown activity in a number of EGFR-activated tumor models (Formisano et al., 2014; Nam et al., 2013). The strong association between the ac tivation of EGFR and HER2 and saracatinib activity suggests that saracatinib (Figure S5G, S5H) should be considered for evaluation in patients whose tumors exhibit EGFR and HER2 activation (due to EGFR mutations or HER2 amplification). In terms of predicting ibrutinib activity (Figure S5I), phospho-HER2 showed the strongest correlation to sensitivity. Strikingly, ibrutinib, which is under evaluation in B-cell tumors as a BTK inhibitor, demonstrates cross-reactivity with EGFR and in particular mutant EGFR (Gao et al., 2014; Haura and Rix, 2014; Wu et al., 2015). Indeed, ibrutinib is being evaluated in a clinical trial for patients with EGFR-mutant lung tumors (NCT02321540).
Interestingly, the volcano plots for lapatinib and other EGFR family inhibitors demonstrate a marked sensitivity in cells with high levels of markers associated with epithelial differentiation (Figures S5J-S5M). This is compatible with several studies reporting that EMT is associated with a stem cell-like phenotype and resistance to multiple therapeutic modalities, including targeted therapies (Byers et al., 2013; Mani et al., 2008; Singh and Settleman, 2010). We thus used our EMT pathway predictor (Akbani et al., 2014) to classify cell lines to identify drugs may have increased activity in the cells that had undergone EMT (Figure 5E). As predicted, cell lines that had a strong EMT signature were resistant to targeted therapies including saracatinib and drugs targeting the EGFR family. However, the EMT cell lines were markedly sensitive to fluvastatin and lovastatin that target HMGCR and were moderately sensitive to a number of drugs that target BRAF, MAPK or NFκB signaling.
One interesting example is the MDM2 inhibitor Nutlin3 (Figures S5N, S5O). The analysis on both the CTRPv2 and GDSC sets showed that elevated p53 proteins levels predicted resistance to Nultin3. This likely represents the resistance being due to elevated p53 levels associated with stabilizing p53 mutations. Indeed, the association of Nutlin3 activity with BAX levels (CTRPv2, p = 6.3×10⁻⁷, GDSC, p = 7.8 ×10⁻⁵, both FDR < 0.05) and p21 levels (CTRPv2, p = 2.1×10⁻⁵, FDR < 0.01; and GDSC, p = 0.0056), which are downstream targets for p53 and indicative of wild type p53, supports this contention.
Another example of particular interest is the relationship between ARID1A protein expression and the sensitivity to MEK inhibitor trametinib, which is an FDA-approved drug for the treatment of patients with metastatic melanoma and currently under intensive clinical investigation (Flaherty et al., 2012). Based on the volcano plots, ARID1A was one top predictor for trametinib across different protein markers; reciprocally, trametinib showed the strongest negative correlation with the ARID1A protein level across different drugs (Figure S5P, Q). Indeed, the ARID1A expression was significantly higher in sensitive cell lines than resistant cell lines (CTRPv2, p = 0.01, Figure S5R). We performed independent drug sensitivity assays in a set of in-house cell lines and validated this pattern (p = 1.59×10⁻⁵, Figure S5S). In contrast, both mRNA expression and mutational status and of ARID1A were not correlated with trametinib sensitivity (Figure S5T, S5U). This example further demonstrates a unique value of RPPA protein markers over DNA mutation or mRNA expression data. This result also suggests that a retrospective analysis of patient samples treated with MEK inhibitors is warranted and if the association with ARID1A protein levels is validated, a prospective study of ARID1A as a biomarker for MEK inhibitor response could be implemented. Taken together, these observations support the power of RPPA analysis for predicting responses to different therapeutic modalities.
A protein-centered web platform for exploring cancer cell line data
To facilitate the utilization of the proteomic data contained in our cell line set to a broad biomedical community, we developed a user-friendly, interactive web platform, MCLP, for fluent data exploration and analysis, which can be accessed at http://bioinformatics.mdanderson.org/main/MCLP:Overview. The MCLP platform provides four interactive modules: “My Protein,” “Analysis,” “Visualization” and “Data Sets” (Figure 6A). To illustrate how users can quickly obtain useful information about a specific protein, we use PDL1, a key immunotherapy target as an example in this section. “My Protein” shows detailed information for each RPPA protein, including protein name, corresponding gene names, antibody source and validation status. This module also provides the global expression pattern of a protein across different cell line lineages in boxplots. For example, the PDL1 protein expression is much higher in head and neck and lung cancer cell lines which are associated with tobacco and have a high mutational load than in uterine cell lines (Figure 6B). This may also correlate with the response to PDL1 and PD1 inhibitors in these lineages. The “Analysis” module provides three common analyses through which users can explore the function and underlying associations of proteins in each cell line lineage. (i) Protein–Protein Correlation: with this module, users can identify pairwise protein correlations for each cell line lineage, such as a positive correlation between PDL1 and CD49B in uterine cell lines (Figure 6C); (ii) Protein–Mutation Correlation: given a mutated gene of interest, users can identify proteins differentially expressed between the WT and mutant cell lines such as the higher PDL1 expression in CCDC50 mutant cell lines than WT cell lines (Figure 6D); and (iii) Protein–Drug Correlation: users can explore the correlations between protein expression and drug sensitivity through volcano plots such as the correlations of PDL1 with pyrazolanthrone (Figure 6E). The module “Visualization” provides two ways to examine the global patterns of protein expression: (i) Protein–Protein Network shows the correlations of a protein expression with its interacting partners in protein interaction networks derived from databases such as HPRD and STRING (Stelzl et al., 2005; Szklarczyk et al., 2015) (the interacting neighbors of PDL1 is shown in Figure 6F); and (ii) Dynamic Heatmap allows users to navigate, magnify and explore the clustering patterns of cell lines or proteins in an interactive heatmap as well as to identify proteins expressed in particular cell lines (Figure 6G). The “Data sets” module describes in detail the datasets curated in MCLP. Each dataset can be easily downloaded through a tree-view interface. Collectively, MCLP provides a protein-centered web platform that enables researchers to explore, analyze and visualize RPPA data and other associated data on MCLP cell lines in an intuitive and efficient manner.
Figure 6. Utility illustration of the MCLP web platform through the example of PDL1.

(A) Overview. (B) The PDL1 protein expression across lineages. (C) A positive correlation between PDL1 expression and CD49B. (D) The differential expression of PDL1 protein between the mutant and wild-type groups based on the mutation status of CCDC50. (E) Volcano plot of PDL1. (F) The co-expression pattern of PDL1 and its interacting partners in a protein–protein network view. (G) A snapshot of dynamic heatmap of the RPPA dataset.
Discussion
Recent large cancer genome projects such as TCGA have revealed great molecular diversity among tumors across and within cancer types. Understanding the functional consequence of this diversity on treatment response is a central task for implementing precision cancer medicine. It is therefore essential to characterize the comprehensive molecular profiles of a large number of human cancer cell lines in order to capture the diversity observed in patient tumors and elucidate the complex relationships between molecular aberrations, cancer phenotypes and therapeutic response. Using the same RPPA platform employed for TCGA, we generated protein expression profiles of 651 independent cell lines, a comprehensive cell line protein expression dataset. This study greatly expands our understanding of cancer cell lines by adding information on protein expression, including total and posttranslationally modified proteins, which are arguably the most crucial molecules in the cell and, importantly, the target of most drugs. Together with recent efforts that have systematically characterized cancer cell lines at the DNA and RNA levels as well as drug responses, our study provides a rich resource for the research community to use to investigate tumor behaviors in a quantitative and efficient way.
As major model systems, cell lines allow us to investigate cancer mechanisms and drug response in a simplified, well-controlled environment, thereby identifying the most compelling candidates or hypotheses for further investigation. Through straightforward, side-by-side comparisons, we showed that our MCLP data could largely recapitulate the protein expression patterns associated with frequently mutated pathways that are observed in TCGA patient cohorts; and that RPPA-based protein markers are powerful predictors of drug response providing information that cannot be obtained solely from analysis of corresponding mRNAs. Although many of the predicted drug responses were expected, others were not initially but could be justified by literature review. We further validated some cases through training-and-test approaches across different data sets or independent experiments in our laboratory. This suggests that the protein-drug sensitivity analysis resource can be used to discover associations and therapeutic markers, and highlights the potential clinical utility of our MCLP project.
Our RPPA platform also has some limitations. First, compared with recent mass spectrometry studies of cell lines or patient samples (∼10,000 detectable proteins)(Mertins et al., 2016; Tyanova et al., 2016; Zhang et al., 2014; Zhang et al., 2016), the number of RPPA protein markers (including phosphorylated proteins) that can be effectively monitored by the RPPA technology is much smaller. However, the increased sensitivity (particularly for some key proteins and phosphoproteins) and cost make RPPA a practical platform for the analysis of the large number of cell lines available. Second, the RPPA readout of a protein is largely dependent on the antibody availability and quality. Further, as other high-throughput technologies, there is relatively high technical measurement error on individual samples, so that interesting observations from the RPPA platform should be confirmed by further in-depth investigations.
To help the broader research community to capitalize on our protein expression data as well as other associated data on MCLP cell lines, we have provided an interactive, user-friendly web platform through which biomedical researchers can explore, visualize, and analyze these data in an intuitive and convenient way. We expect this tool to greatly reduce the barriers researchers face in mining complex genomic and proteomic data, directly facilitating the translation of these data into clinical knowledge and utility.
Experimental Procedures
Cell line source and RPPA profiling
We collected cancer cell lines or proteins through the CCSG supported Cell Line Characterization Core facility (Houston, TX) and from a number of outside collaborations. All lines prepared at the MD Anderson Cancer Center (MDACC) were confirmed by short tandem repeat (STR) analysis in the core per institutional policy. The cell lines and STR are routinely “cleaned” by comparison with the “Database of Cross-Contaminated or Misidentified Cell Lines” (http://iclac.org/databases/cross-contaminations/). The outside collaborators also routinely confirm cell lines by STR analysis. In the most cases we were able to confirm the identity of proteins or lines from outside collaborators by comparing RPPA results from multiple runs of the same cell line from several groups. For RPPA experiments, cell line samples were prepared and antibodies were validated as previously described (Hennessy et al., 2010; Nishizuka et al., 2003; Tibes et al., 2006). RPPA data were generated by the RPPA core facility at MDACC, the same platform used for TCGA patient samples. RPPA slides were first quantified using ArrayPro (Meda Cybernetics) to generate signal intensities, then processed by SuperCurve (Hu et al., 2007) to estimate the relative protein expression level, and were normalized by median polish. RPPA slide quality was assessed by a quality control classifier (Ju et al., 2015) and only those slides above 0.8 (range: 0-1) were retained for further analysis. The cell line samples were run in a total of seven batches, and merged using a replicate-based normalization method (Akbani et al., 2014), in which replicate samples profiled across multiple batches are used to adjust the data for potential batch effects. In total, we generated RPPA data of 706 cell lines and after removing closely related cell derivatives, 651 independent cell lines were used in subsequent analysis (Table S1). See more details in Supplemental Experimental Procedures and Figure S1.
Genomic, gene expression and drug sensitivity data collection
We collected single nucleotide variation, copy number alteration, and gene expression data from four major cell line resources: CCLE (http://www.broadinstitute.org/ccle), COSMIC Cell Line Project (http://cancer.sanger.ac.uk/cell_lines), J.W. Gray Breast Cancer Cell Line Panel (Synapse: syn2346643), and a recent cell line resource generated by Genentech (Klijn et al., 2015). We obtained drug sensitivity data from two pharmacogenomic resources: GDSC (http://www.cancerrxgene.org/) and CTRPv2 (http://www.broadinstitute.org/ctrp.v2/). Annotations of compounds were extracted from previous studies (Garnett et al., 2012; Seashore-Ludlow et al., 2015).
Protein and mRNA expression analysis
For protein and mRNA correlation analysis, we used the CCLE mRNA expression data (Affymetrix microarrays) since it shares the largest number of cell lines with our MCLP dataset. For the 369 cell lines with both protein and mRNA expression data, we analyzed 250 proteins that were measured in >30% of the cell lines. These proteins had matched mRNA expression data from 201 unique genes. We calculated Spearman's rank correlations between the matched protein– mRNA pairs for each of 11 lineages and across all the cell lines, and repeated the analyses after filtering the 20% of protein markers with the lowest coefficient of variation for each lineage. FDR was used to adjust for multiple comparisons. Based on the number of comparisons in which an mRNA and protein pair (n) showed a significant correlation (Rs > 0.5), we classified the proteins into three groups: n = 0, group 1, no correlation; n = 1∼5, group 2, low correlation; and n >5, group 3, high correlation. Based on Spearman's rank correlations of each protein–protein pair across all the cell lines, we constructed a protein co-expression network with |Rs| > 0.6, FDR < 0.001. Then for each protein–protein interaction, we assessed whether the corresponding mRNAs showed a significant co-expression pattern (|Rs| > 0.2). We used the chi-squared test to assess whether phosphoproteins were enriched in a specific protein or interaction group. We performed a similar analysis for the mRNA co-expression network.
Protein expression clustering analysis
We performed consensus clustering analysis on 651 cell lines based on >200 most commonly shared proteins across cell lines, and used the chi-squared test to assess the correlations of the resulting cell line clusters with cell line lineages or mutated cancer genes or breast cancer subtypes. We calculated the RPPA-based pathway scores (Akbani et al., 2014) and used the analysis of variance to assess the correlations of the resulting cell line clusters with the pathway scores.
Mutation–protein analysis
We performed mutation–protein analysis on our MCLP cell lines and TCGA patient sample tumors. For the cell lines with available mutation data from CCLE, we focused on the 6 lineages with >10 cell lines available. Since the RPPA data of acute myeloid leukemia were not available in TCGA, blood cell lines were removed from the comparison. For patient cohorts, we retrieved level-3 mutation data and replicate-based normalized RPPA data from the corresponding 5 TCGA cancer types (BRCA, COAD, LUSC/LUAD, OV, and UCEC) from synapse (syn4924181) and The Cancer Proteome Atlas (Li et al., 2013). To identify frequently mutated pathways (or subnetwork), we obtained 16 frequently mutated pathways (Leiserson et al., 2015), among which only 4 pathways had >10% mutation frequencies in at least one of the five cancer types. Given a pathway of interest, we used Student's t-test to assess whether a protein was differentially expressed between the WT and mutated groups. To assess global similarity, for the cell line lineages with >10 differentially expressed proteins (FDR < 0.05), we used Spearman's rank correlation to assess the similarity of fold changes across different proteins between MCLP cell lines and TCGA patient samples.
Drug sensitivity data analysis
We analyzed the drug sensitivity data over MCLP cell lines using two approaches. First, we implemented the waterfall method to categorize sensitive and resistant cell lines as previously described (Barretina et al., 2012; Haibe-Kains et al., 2013), and applied Student's t-test to identify individual protein and mRNA markers significantly associated with a specific drug. We identified individual features (total/phospho-proteins or mRNAs) at FDR = 0.1 between the two sensitive and resistant groups. To compare the power of the classifiers of differentially expressed proteins or mRNAs, we first employed an elastic net to construct multiple-marker classifiers to predict sensitive/resistant cell lines using the CTRPv2 data as the training set and optimized the parameters through cross-validation. Then we applied the classifiers to the corresponding drugs in the GDSC datasets (the test set), and assessed the classifier performance based on the AUC score in the ROC. Second, to examine the relationships of individual proteins with a drug, we visualized their patterns by volcano plots.
Drug sensitivity assays
Trametinib was 3-fold serial diluted for 7 dilutions in DMSO at 1,000× concentration stocks. Aliquots of the diluted stocks were stored in -20°C. The cancer cell lines involved in this assay were verified by the STR analysis at MD Anderson Core. They were maintained in their optimal growth medium (with 5% FBS) and seeded in 96-well plate at 2,500 cells/100ul/well for 24 hr incubation prior to being changed into the medium containing 2% FBS for overnight incubation (for serum deprivation). Serial diluted drug stocks were added to each well to make 1/1,000 final concentration for additional 72 hr incubation. DMSO at 0.1% without any drugs was used as controls (basal level). Triplicates were performed for each concentration. Cell viability was determined at the end-point by Cell Titer Blue Cell Viability Assay (5uL of the reagent/well) based on the ability of living cells to convert redox dye (resazurin) into a fluorescent product (resorufin) to be measured at 530Ex / 604Em. Cellular responsibility was defined by GI50 and EC50 concentration calculated according to the cell viability curve.
Web platform development
All RPPA, genomic, mRNA expression and drug sensitivity data accompanying the pre-calculated analytic results were stored in a CouchDB database. We generated all the analytic results in R before loading them into the database. We implemented a user-friendly and interactive web interface in JavaScript. Specifically, tabular results were generated by DataTables; box and scatter plots were generated by HighCharts; and interactive network views were implemented by Cytoscape.js library.
Supplementary Material
Significance.
Protein expression profiling offers a powerful approach for investigating cancer mechanisms and therapies. Using reverse-phase protein arrays, we systematically characterized the expression levels of key cancer-related total and phosphorylated proteins in a large set of human cancer cell lines, many of which are linked to high-quality DNA, RNA and drug screening data. These proteins can recapitulate mutational patterns relevant to cancer patients and show robust ability to predict drug sensitivity. We developed an integrated web platform for community-based investigation of proteomic data.
Acknowledgments
This study was supported by the National Institutes of Health (CA168394, CA098258 and U24CA143883 and U54HG008100 to G.B.M., CA175486 to H.L., CA209851 to H.L. and G.B.M., Cancer Center Support Grant CA016672; CA176284 and CA70907 to A.F.G. and J.D.M.); the R. Lee Clark Fellow Award from The Jeanne F. Shelby Scholarship Fund; a grant from the Cancer Prevention and Research Institute of Texas (RP140462 to H.L.); the Lorraine Dell Program in Bioinformatics for Personalization of Cancer Medicine (to H.L.); and the Adelson Medical Research Foundation (to G.B.M.). We thank the MDACC high-performance computing core facility for computing, and LeeAnn Chastain for editorial assistance. G.B.M. has sponsored research support from AstraZeneca and is on the Scientific Advisory Board for AstraZeneca, ImmunoMet, Nuevolution and Precision Medicine.
Footnotes
Author Contributions: G.B.M. and H.L. conceived of and supervised the project. J.L., W.Z., R.A., W.L., Z.J., S.L., C.P.V., Y.L., G.B.M., and H.L. contributed to the data analysis. Q.Y., A.K.E., L.B., M.D., W.D., Y.N.V.G., G.C., E.M.V.E., D.S., D.C., J.V.H, A.F.G., J.D.M., J.N.M., Y.L., G.B.M. contributed to the experiments. J.L. and P.R. implemented the web portal. J.L., W.Z., G.B.M. and H.L. wrote the manuscript, with input from other authors.
References
- Akbani R, Ng PK, Werner HM, Shahmoradgoli M, Zhang F, Ju Z, Liu W, Yang JY, Yoshihara K, Li J, et al. A pan-cancer proteomic perspective on The Cancer Genome Atlas. Nature communications. 2014;5:3887. doi: 10.1038/ncomms4887. [DOI] [PMC free article] [PubMed] [Google Scholar]
- Barretina J, Caponigro G, Stransky N, Venkatesan K, Margolin AA, Kim S, Wilson CJ, Lehar J, Kryukov GV, Sonkin D, et al. The Cancer Cell Line Encyclopedia enables predictive modelling of anticancer drug sensitivity. Nature. 2012;483:603–607. doi: 10.1038/nature11003. [DOI] [PMC free article] [PubMed] [Google Scholar]
- Byers LA, Diao L, Wang J, Saintigny P, Girard L, Peyton M, Shen L, Fan Y, Giri U, Tumula PK, et al. An epithelial-mesenchymal transition gene signature predicts resistance to EGFR and PI3K inhibitors and identifies Axl as a therapeutic target for overcoming EGFR inhibitor resistance. Clin Cancer Res. 2013;19:279–290. doi: 10.1158/1078-0432.CCR-12-1558. [DOI] [PMC free article] [PubMed] [Google Scholar]
- Cancer Cell Line Encyclopedia, C., and Genomics of Drug Sensitivity in Cancer, C. Pharmacogenomic agreement between two cancer cell line data sets. Nature. 2015;528:84–87. doi: 10.1038/nature15736. [DOI] [PMC free article] [PubMed] [Google Scholar]
- Cheung LW, Walkiewicz KW, Besong TM, Guo H, Hawke DH, Arold ST, Mills GB. Regulation of the PI3K pathway through a p85alpha monomer-homodimer equilibrium. eLife. 2015;4:e06866. doi: 10.7554/eLife.06866. [DOI] [PMC free article] [PubMed] [Google Scholar]
- Daemen A, Griffith OL, Heiser LM, Wang NJ, Enache OM, Sanborn Z, Pepin F, Durinck S, Korkola JE, Griffith M, et al. Modeling precision treatment of breast cancer. Genome Biol. 2013;14:R110. doi: 10.1186/gb-2013-14-10-r110. [DOI] [PMC free article] [PubMed] [Google Scholar]
- Flaherty KT, Infante JR, Daud A, Gonzalez R, Kefford RF, Sosman J, Hamid O, Schuchter L, Cebon J, Ibrahim N, et al. Combined BRAF and MEK inhibition in melanoma with BRAF V600 mutations. The New England journal of medicine. 2012;367:1694–1703. doi: 10.1056/NEJMoa1210093. [DOI] [PMC free article] [PubMed] [Google Scholar]
- Formisano L, Nappi L, Rosa R, Marciano R, D'Amato C, D'Amato V, Damiano V, Raimondo L, Iommelli F, Scorziello A, et al. Epidermal growth factor-receptor activation modulates Src-dependent resistance to lapatinib in breast cancer models. Breast Cancer Res. 2014;16:R45. doi: 10.1186/bcr3650. [DOI] [PMC free article] [PubMed] [Google Scholar]
- Gao W, Wang M, Wang L, Lu H, Wu S, Dai B, Ou Z, Zhang L, Heymach JV, Gold KA, et al. Selective antitumor activity of ibrutinib in EGFR-mutant non-small cell lung cancer cells. J Natl Cancer Inst. 2014;106 doi: 10.1093/jnci/dju204. [DOI] [PMC free article] [PubMed] [Google Scholar]
- Garnett MJ, Edelman EJ, Heidorn SJ, Greenman CD, Dastur A, Lau KW, Greninger P, Thompson IR, Luo X, Soares J, et al. Systematic identification of genomic markers of drug sensitivity in cancer cells. Nature. 2012;483:570–575. doi: 10.1038/nature11005. [DOI] [PMC free article] [PubMed] [Google Scholar]
- Gygi SP, Rochon Y, Franza BR, Aebersold R. Correlation between protein and mRNA abundance in yeast. Molecular and cellular biology. 1999;19:1720–1730. doi: 10.1128/mcb.19.3.1720. [DOI] [PMC free article] [PubMed] [Google Scholar]
- Haibe-Kains B, El-Hachem N, Birkbak NJ, Jin AC, Beck AH, Aerts HJ, Quackenbush J. Inconsistency in large pharmacogenomic studies. Nature. 2013;504:389–393. doi: 10.1038/nature12831. [DOI] [PMC free article] [PubMed] [Google Scholar]
- Haura EB, Rix U. Deploying ibrutinib to lung cancer: another step in the quest towards drug repurposing. J Natl Cancer Inst. 2014;106 doi: 10.1093/jnci/dju250. [DOI] [PMC free article] [PubMed] [Google Scholar]
- Hennessy BT, Lu Y, Gonzalez-Angulo AM, Carey MS, Myhre S, Ju Z, Davies MA, Liu W, Coombes K, Meric-Bernstam F, et al. A Technical Assessment of the Utility of Reverse Phase Protein Arrays for the Study of the Functional Proteome in Non-microdissected Human Breast Cancers. Clinical proteomics. 2010;6:129–151. doi: 10.1007/s12014-010-9055-y. [DOI] [PMC free article] [PubMed] [Google Scholar]
- Hu J, He X, Baggerly KA, Coombes KR, Hennessy BT, Mills GB. Non-parametric quantification of protein lysate arrays. Bioinformatics. 2007;23:1986–1994. doi: 10.1093/bioinformatics/btm283. [DOI] [PubMed] [Google Scholar]
- Ince TA, Sousa AD, Jones MA, Harrell JC, Agoston ES, Krohn M, Selfors LM, Liu W, Chen K, Yong M, et al. Characterization of twenty-five ovarian tumour cell lines that phenocopy primary tumours. Nature communications. 2015;6:7419. doi: 10.1038/ncomms8419. [DOI] [PMC free article] [PubMed] [Google Scholar]
- Ju Z, Liu W, Roebuck PL, Siwak DR, Zhang N, Lu Y, Davies MA, Akbani R, Weinstein JN, Mills GB, et al. Development of a robust classifier for quality control of reverse-phase protein arrays. Bioinformatics. 2015;31:912–918. doi: 10.1093/bioinformatics/btu736. [DOI] [PMC free article] [PubMed] [Google Scholar]
- Klijn C, Durinck S, Stawiski EW, Haverty PM, Jiang Z, Liu H, Degenhardt J, Mayba O, Gnad F, Liu J, et al. A comprehensive transcriptional portrait of human cancer cell lines. Nat Biotechnol. 2015;33:306–312. doi: 10.1038/nbt.3080. [DOI] [PubMed] [Google Scholar]
- Leiserson MD, Vandin F, Wu HT, Dobson JR, Eldridge JV, Thomas JL, Papoutsaki A, Kim Y, Niu B, McLellan M, et al. Pan-cancer network analysis identifies combinations of rare somatic mutations across pathways and protein complexes. Nat Genet. 2015;47:106–114. doi: 10.1038/ng.3168. [DOI] [PMC free article] [PubMed] [Google Scholar]
- Li J, Lu Y, Akbani R, Ju Z, Roebuck PL, Liu W, Yang JY, Broom BM, Verhaak RG, Kane DW, et al. TCPA: a resource for cancer functional proteomics data. Nat Methods. 2013;10:1046–1047. doi: 10.1038/nmeth.2650. [DOI] [PMC free article] [PubMed] [Google Scholar]
- Mani SA, Guo W, Liao MJ, Eaton EN, Ayyanan A, Zhou AY, Brooks M, Reinhard F, Zhang CC, Shipitsin M, et al. The epithelial-mesenchymal transition generates cells with properties of stem cells. Cell. 2008;133:704–715. doi: 10.1016/j.cell.2008.03.027. [DOI] [PMC free article] [PubMed] [Google Scholar]
- Marcotte R, Sayad A, Brown KR, Sanchez-Garcia F, Reimand J, Haider M, Virtanen C, Bradner JE, Bader GD, Mills GB, et al. Functional Genomic Landscape of Human Breast Cancer Drivers, Vulnerabilities, and Resistance. Cell. 2016;164:293–309. doi: 10.1016/j.cell.2015.11.062. [DOI] [PMC free article] [PubMed] [Google Scholar]
- Mertins P, Mani DR, Ruggles KV, Gillette MA, Clauser KR, Wang P, Wang X, Qiao JW, Cao S, Petralia F, et al. Proteogenomics connects somatic mutations to signalling in breast cancer. Nature. 2016;534:55–62. doi: 10.1038/nature18003. [DOI] [PMC free article] [PubMed] [Google Scholar]
- Moghaddas Gholami A, Hahne H, Wu Z, Auer FJ, Meng C, Wilhelm M, Kuster B. Global proteome analysis of the NCI-60 cell line panel. Cell reports. 2013;4:609–620. doi: 10.1016/j.celrep.2013.07.018. [DOI] [PubMed] [Google Scholar]
- Monti S, Tamayo P, Mesirov J, Golub T. Consensus clustering: A resampling-based method for class discovery and visualization of gene expression microarray data. Mach Learn. 2003;52:91–118. [Google Scholar]
- Nam HJ, Im SA, Oh DY, Elvin P, Kim HP, Yoon YK, Min A, Song SH, Han SW, Kim TY, et al. Antitumor activity of saracatinib (AZD0530), a c-Src/Abl kinase inhibitor, alone or in combination with chemotherapeutic agents in gastric cancer. Mol Cancer Therap. 2013;12:16–26. doi: 10.1158/1535-7163.MCT-12-0109. [DOI] [PubMed] [Google Scholar]
- Nishizuka S, Charboneau L, Young L, Major S, Reinhold WC, Waltham M, Kouros-Mehr H, Bussey KJ, Lee JK, Espina V, et al. Proteomic profiling of the NCI-60 cancer cell lines using new high-density reverse-phase lysate microarrays. PNAS. 2003;100:14229–14234. doi: 10.1073/pnas.2331323100. [DOI] [PMC free article] [PubMed] [Google Scholar]
- Seashore-Ludlow B, Rees MG, Cheah JH, Cokol M, Price EV, Coletti ME, Jones V, Bodycombe NE, Soule CK, Gould J, et al. Harnessing Connectivity in a Large-Scale Small-Molecule Sensitivity Dataset. Cancer Discov. 2015;5:1210–1223. doi: 10.1158/2159-8290.CD-15-0235. [DOI] [PMC free article] [PubMed] [Google Scholar]
- Sheehan KM, Calvert VS, Kay EW, Lu Y, Fishman D, Espina V, Aquino J, Speer R, Araujo R, Mills GB, et al. Use of reverse phase protein microarrays and reference standard development for molecular network analysis of metastatic ovarian carcinoma. Mol & Cell Proteomics. 2005;4:346–355. doi: 10.1074/mcp.T500003-MCP200. [DOI] [PubMed] [Google Scholar]
- Singh A, Settleman J. EMT, cancer stem cells and drug resistance: an emerging axis of evil in the war on cancer. Oncogene. 2010;29:4741–4751. doi: 10.1038/onc.2010.215. [DOI] [PMC free article] [PubMed] [Google Scholar]
- Spurrier B, Ramalingam S, Nishizuka S. Reverse-phase protein lysate microarrays for cell signaling analysis. Nature protocols. 2008;3:1796–1808. doi: 10.1038/nprot.2008.179. [DOI] [PubMed] [Google Scholar]
- Stelzl U, Worm U, Lalowski M, Haenig C, Brembeck FH, Goehler H, Stroedicke M, Zenkner M, Schoenherr A, Koeppen S, et al. A human protein-protein interaction network: a resource for annotating the proteome. Cell. 2005;122:957–968. doi: 10.1016/j.cell.2005.08.029. [DOI] [PubMed] [Google Scholar]
- Szklarczyk D, Franceschini A, Wyder S, Forslund K, Heller D, Huerta-Cepas J, Simonovic M, Roth A, Santos A, Tsafou KP, et al. STRING v10: protein-protein interaction networks, integrated over the tree of life. Nucleic Acids Res. 2015;43:D447–452. doi: 10.1093/nar/gku1003. [DOI] [PMC free article] [PubMed] [Google Scholar]
- Tibes R, Qiu Y, Lu Y, Hennessy B, Andreeff M, Mills GB, Kornblau SM. Reverse phase protein array: validation of a novel proteomic technology and utility for analysis of primary leukemia specimens and hematopoietic stem cells. Mol Cancer Ther. 2006;5:2512–2521. doi: 10.1158/1535-7163.MCT-06-0334. [DOI] [PubMed] [Google Scholar]
- Tyanova S, Albrechtsen R, Kronqvist P, Cox J, Mann M, Geiger T. Proteomic maps of breast cancer subtypes. Nature communications. 2016;7:10259. doi: 10.1038/ncomms10259. [DOI] [PMC free article] [PubMed] [Google Scholar]
- Wu H, Wang A, Zhang W, Wang B, Chen C, Wang W, Hu C, Ye Z, Zhao Z, Wang L, et al. Ibrutinib selectively and irreversibly targets EGFR (L858R, Del19) mutant but is moderately resistant to EGFR (T790M) mutant NSCLC Cells. Oncotarget. 2015;6:31313–31322. doi: 10.18632/oncotarget.5182. [DOI] [PMC free article] [PubMed] [Google Scholar]
- Yang JY, Werner HM, Li J, Westin SN, Lu Y, Halle MK, Trovik J, Salvesen HB, Mills GB, Liang H. Integrative Protein-Based Prognostic Model for Early Stage Endometrioid Endometrial Cancer. Clin Cancer Res. 2015;22:513–523. doi: 10.1158/1078-0432.CCR-15-0104. [DOI] [PMC free article] [PubMed] [Google Scholar]
- Yang JY, Yoshihara K, Tanaka K, Hatae M, Masuzaki H, Itamochi H, Cancer Genome Atlas Research, N. Takano M, Ushijima K, Tanyi JL, et al. Predicting time to ovarian carcinoma recurrence using protein markers. J Clin Invest. 2013;123:3740–3750. doi: 10.1172/JCI68509. [DOI] [PMC free article] [PubMed] [Google Scholar]
- Zhang B, Wang J, Wang X, Zhu J, Liu Q, Shi Z, Chambers MC, Zimmerman LJ, Shaddox KF, Kim S, et al. Proteogenomic characterization of human colon and rectal cancer. Nature. 2014;513:382–387. doi: 10.1038/nature13438. [DOI] [PMC free article] [PubMed] [Google Scholar]
- Zhang H, Liu T, Zhang Z, Payne SH, Zhang B, McDermott JE, Zhou JY, Petyuk VA, Chen L, Ray D, et al. Integrated proteogenomic characterization of human high-grade serous ovarian cancer. Cell. 2016 doi: 10.1016/j.cell.2016.05.069. in press. [DOI] [PMC free article] [PubMed] [Google Scholar]
Associated Data
This section collects any data citations, data availability statements, or supplementary materials included in this article.