Abstract
Conventional sleep analysis relies primarily on electroencephalogram (EEG) waveform features assessed in concert with eye movements, respiration and muscle tone. We explore a complementary “complexity domain” approach based on multiscale entropy (MSE) analysis of EEG signals and discuss its relationships to standard sleep analysis and to that based on electrocardiogram (ECG)-derived cardiopulmonary coupling (CPC). We observe a progressive decrease in complexity associated with decreased arousability, as measured by both conventional sleep scoring and CPC analysis. Furthermore, complexity analysis supports the contention that stage 2 non-REM sleep has distinct sub-phases that map to CPC high- and low-frequency coupled dynamics.
I. Introduction
Sleep analysis is essential both to basic research in brain function and to clinical practice. The paradigm for staging sleep using polysomnographic (PSG) recordings is dominated by the historic Rechtschaffen and Kales (R&K) system [1] from 1968 and subsequent minor modifications. PSG recordings typically include multiple electroencephalographic (EEG) leads, one electrocardiographic (ECG) lead, the electrooculogram (EOG), the electromyogram (EMG), and respiration signals.
The R&K paradigm partitions sleep into rapid eye movement (REM) and non-REM (NREM) phases. The original rules divided NREM sleep into four stages (S1–S4), reflecting progressively decreased arousability/increased sleep depth. This classical approach is based primarily on the frequency content of the signals.
Only a small number of alternative approaches to sleep classification have been proposed over more recent decades. In 2001, Terzano and colleagues [2] described sleep in health and disease in terms of cyclic alternating (CAP) and non-CAP patterns. The former is interpreted as an “unstable” (arousable) stage while the latter is interpreted as a deeper/less arousable sleep. In healthy subjects, CAP (“unstable”) sleep includes S1 and the majority of S2; non-CAP (“stable”) sleep includes predominantly S3 and S4.
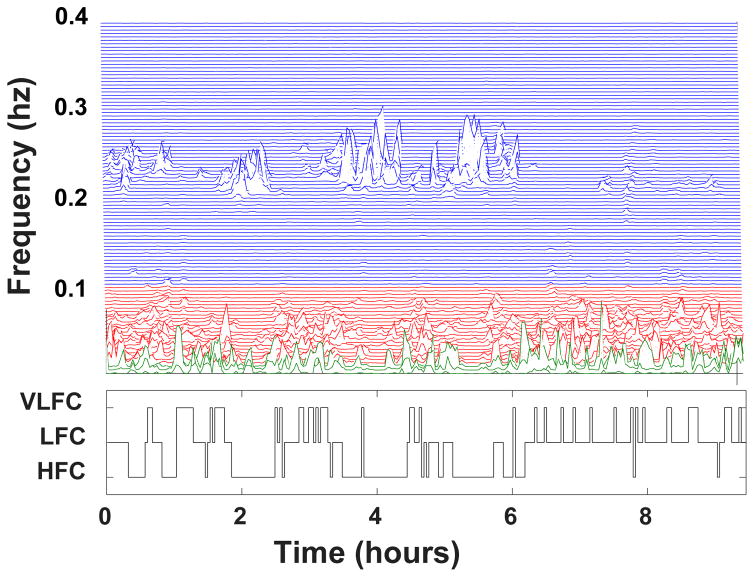
A third approach to sleep analysis is based on cardiopulmonary coupling (CPC). In 2005, Thomas and colleagues proposed the CPC technique [3], which is based solely on the analysis of a continuous ECG signal and estimates the coupling between heart rate dynamics and respiration. The method quantifies the Fourier cross spectral power and coherence between a cardiac interbeat interval time series and an ECG-derived respiratory signal. Fig. 1 shows a display of this information, termed a CPC sleep spectrogram, for one of the study subjects. Three frequency bands of interest are defined: high frequency [0.1–0.4 Hz], low frequency [0.01–0.1] Hz, and very low frequency (VLF) [0–0.01] Hz. Using the analysis of the product of the cross spectral power and coherence described in [3], each 8.5 min time window is classified into one of three regimes: high frequency coupling (HFC) (Fig. 1, blue area), low frequency coupling (LFC) (Fig. 1, red area) and very low frequency coupling (VLFC) (Fig. 1, green area).
Figure 1.
Cardiopulmonary coupling (CPC) spectrogram (top) and sleep state classification (bottom) for a study subject. See text for details.
Previous studies [3,4] have shown that CPC LFC and HFC regimes demonstrate a closer relationship with CAP/non-CAP sleep classification than with R&K staging. Specifically, i) HFC, which is a reflection of vagally-modulated respiratory sinus arrhythmia, correlates with delta power [5] and with non-CAP sleep; ii) LFC correlates with CAP sleep, and iii) VLFC correlates with wakefulness or REM sleep.
Regarding the relationship between R&K and CPC sleep staging, previous studies [3, 4] have shown that: i) wake and REM is highly correlated with VLFC, ii) sleep stage S1 with LFC and iii) sleep stages S3 and S4 with HFC. Sleep stage S2 has been reported to comprise both LFC and HFC regimes [3,5].
Recent studies suggest that entropy measures [6–9], including multiscale entropy (MSE) [10, 11], may be useful in the analysis of sleep EEG signals. Our aim was to expand this line of inquiry to encompass traditional R&K, CPC and complexity domain approaches. We quantified the complexity of the EEG signals, using MSE, in a group of healthy young to middle-aged men, to test the hypotheses that: 1) there is an inverse relationship between the depth of sleep and the complexity of the EEG signal (deeper NREM sleep is less complex than lighter NREM sleep), and that 2) periods of S2 dominated by LFC have higher complexity than those dominated by HFC. These hypotheses were motivated by our conceptual framework that the complexity of physiological signals reflects the capacity of the underlying systems to adapt to internal and external perturbations [12].
II. Materials and Methods
A. Dataset
PSG studies were obtained from 20 healthy young to middle-aged male subjects (median age [range] 36 yrs [25 – 52]) for two consecutive nights. Only the last night studies were used for this retrospective analysis [13]. The PSG protocol included two electrooculograms (EOG), one submental electromyogram (EMG), an electrocardiogram (ECG) and a 19-channel EEG recorded under the International 10–20 Standard, using a montage with reference to the A1 or A2 mastoid lead. The files were stored in EDF format (sampling frequency of 200 Hz). Every 20-second PSG epoch was visually scored according to the R&K guidelines. See [13] and references therein.
B. Denoising
ECG artifacts were removed using the method reported in [14]. Briefly, the locations of the R peaks on the ECG, detected via a modified Pan-Tompkins algorithm [15], were used to derive an estimated artifact signal, which was then subtracted from each EEG lead.
C. Multiscale Entropy (MSE)
MSE comprises three steps: 1) construction of a set of coarse-grained time series, each of which represents the system’s dynamics on a different time scale, s. The coarse-grained time series for scale s is obtained using a non-overlapping moving average window of length s. 2) Quantification of the degree of irregularity of each of the coarse-grained time series using the sample entropy (SampEn) algorithm. SampEn is a conditional probability measure quantifying the likelihood that sequences of m consecutive data points [(xi, xi+1, …, xi+m−1) and (xj, xj+1, …, xj+m−1)] matching each other within a tolerance r, will still match when their length increases from m to m + 1 data points. 3) Calculation of the complexity index (CI, unitless) by summing the SampEn values over a pre-defined range of time scales [16].
We analyzed all the EEG leads in non-overlapping windows of the same length (20 s) as those used for clinical scoring of sleep stages in this study. The parameters m and r were set to 2 and 15% of the original time series’ standard deviation, respectively. It has been shown that the effect of the time series length on the SampEn is relatively small for time series of 750 or more samples [17]. Thus, given that the 20-second segments comprised 4000 samples, we coarse-grained each segment up to scale 5, obtaining a set of derived signals whose lengths varied between 800 (scale 5) and 4000 (scale 1) data points.
Next, the CI for each 20 second segment was calculated as the sum of the SampEn values for scales 1 to 5, yielding the so-called CI time series for a given EEG signal. Of note, the CI time series were subsequently filtered, using the method described in [18].
Finally, in order to derive a global CI time series, for each 20-sec window (epoch), we averaged the CI values obtained from the analysis of the 19 EEG leads.
D. Cardiopulmonary Coupling (CPC) Analysis
CPC analysis was performed for all subjects, as described above in [3] on the single-channel continuous ECG signal obtained as part of the PSG study.
E. Stage 2 Segmentation
Epochs classified as S2 by R&K and HFC by CPC were named stage 2 HFC. Similarly, epochs classified at S2 by R&K and LFC by CPC were named stage 2 LFC. This segmentation was designed to test the hypothesis that the complexity of stage 2 HFC was lower than that of stage 2 LFC given the fact that the former represents deeper sleep.
F. Statistical Analysis
We employed the generalized estimating equations (GEE) method [19] to compare the complexity of different sleep regimes. Specifically, we analyzed: 1) differences in the complexity of different R&K sleep stages (Wake/REM, S1, S2, S3, S4), 2) differences in the complexity of different CPC regimes (VLFC, LFC, HFC) and 3) differences between the complexity of stage 2 LFC and stage 2 HFC.
Significance was defined as p<0.05 for the estimate of the model coefficients (against the null hypothesis that each coefficient was equal to zero) and for the comparison between the complexity of different sleep stages (against the null hypothesis of equal group means).
III. Results
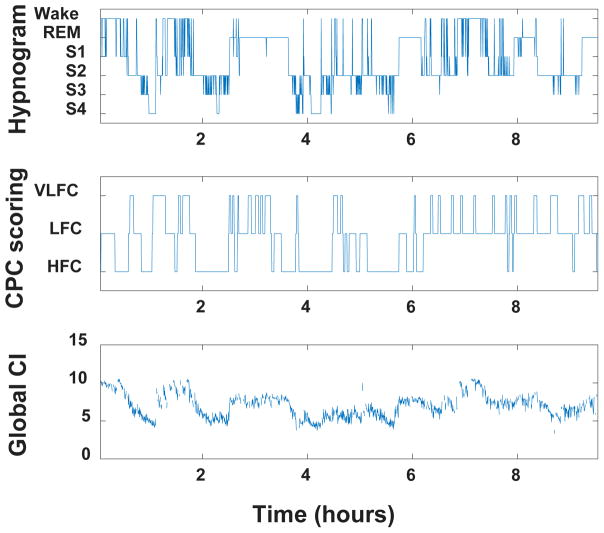
For a representative subject, Fig. 2 shows the R&K hypnogram, the CPC scoring and the global CI time series.
Figure 2.
Hypnogram (top), CPC sleep stage scoring (middle) and global complexity index (CI) time series (bottom) for a representative subject.
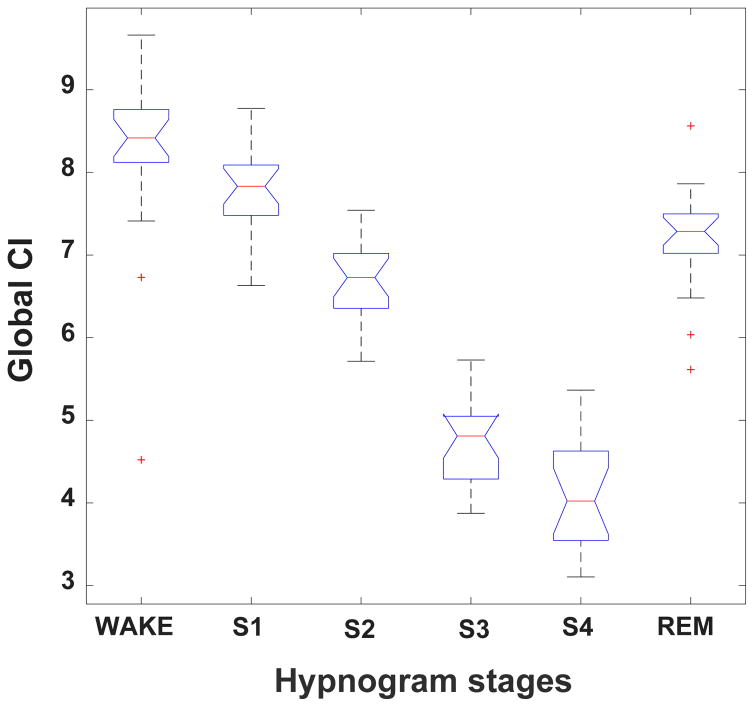
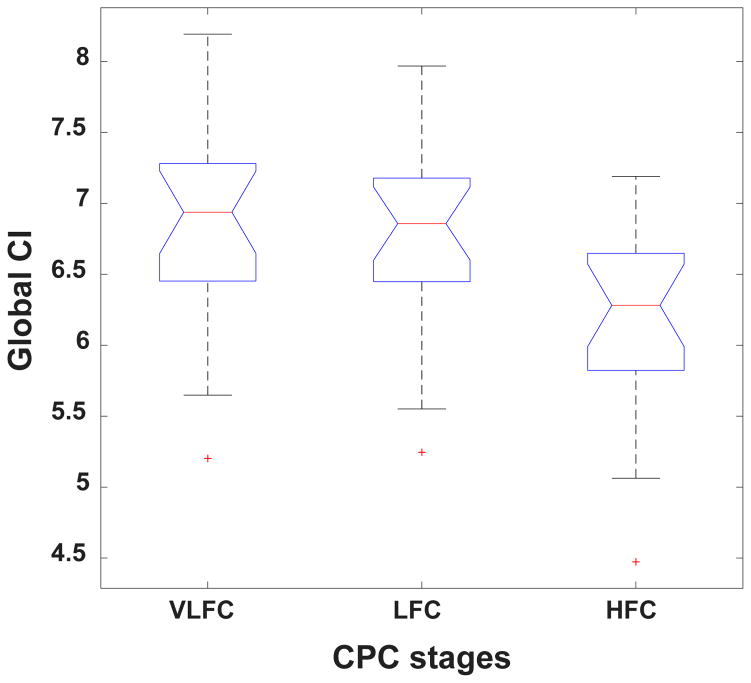
Figs. 3 and 4 show complexity group summary data, using boxplots, for the R&K and CPC stages, respectively. With respect to the R&K staging, the highest complexity values were observed during wake and REM and the lowest during stages S3 and S4; intermediate values were seen with S1 and S2. Similarly, with respect to the CPC scoring, the highest complexity values were observed during wake and REM and the lowest during HFC; intermediate values were seen with LFC. In general, complexity decreased with increasing sleep depth.
Figure 3.
Boxplot of group global CI values per R&K sleep stage. The red line represents group median values. The box encompasses values between the 25th and 75th percentiles. The red crosses indicate outlier values. The bars indicate the minimum and maximum values of the global CI for each sleep stage excluding outliers.
Figure 4.
Boxplot of group global CI values per CPC sleep stages. See caption of Fig. 3 for the meaning of the box-and-whisker plots.
Table 1 and Table 2 show the p-values, computed using the GEE model, for the comparisons between the global CI values of different sleep stages. The difference between any two R&K sleep stages was statistically significant. The differences between the global CIs of VLFC and HFC, and between LFC and HFC were also significant. However, the difference between the global CIs of VLFC and LFC stages did not reach statistical significance.
Table 1.
P-values obtained for the comparison of global CI values of different R&K sleep stages.
| Stage 1 | Stage 2 | Stage 3 | Stage 4 | REM | |
|---|---|---|---|---|---|
| Wake | 0.0003 | 0.0008 | <0.0001 | 0.0002 | 0.0002 |
| Stage 1 | -- | <0.0001 | <0.0001 | <0.0001 | <0.0001 |
| Stage 2 | -- | -- | <0.0001 | 0.0006 | 0.0032 |
| Stage 3 | -- | -- | -- | 0.0012 | <0.0001 |
| Stage 4 | -- | -- | -- | -- | 0.0003 |
Table 2.
P-values obtained for the comparison of global CI values of different CPC stages.
| HFC | LFC | |
|---|---|---|
| VLFC | 0.0002 | 0.0760 |
| HFC | -- | 0.0001 |
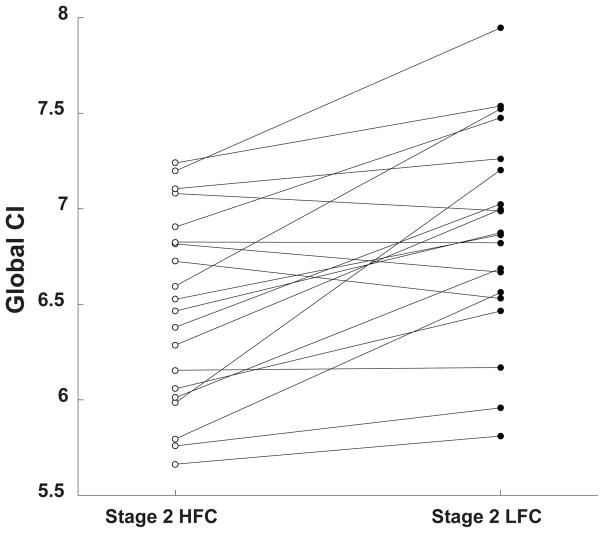
Fig. 5 shows the CI values obtained from the analysis of stage 2 HFC and stage 2 LFC windows for individual subjects. The group median, 25th and 75th percentiles of the percent difference between sleep stage 2 HFC and stage 2 LFC complexity values were 5.4%, 1.7% and 9.6%, respectively.
Figure 5.
Median global CI values of EEG signals in stage 2 HFC and stage 2 LFC for each subject.
For 16 out of the 20 subjects in this study, the complexity of stage 2 HFC was between 0.2 and 16.9% lower than the complexity of stage 2 LFC. For the other 4 subjects, the complexity of stage 2 HFC was between 0.06 and 2.98% higher than the complexity stage 2 LFC. The p-value against the null hypothesis that there was no difference between the mean values of CIs for the LFC and HFC regimes was < 0.001.
IV. Discussion
We analyzed sleep EEG in the complexity domain, using MSE, and compared the results with the R&K and CPC sleep stage classifications. The latter, based solely on analysis of the ECG signal, has been previously correlated with CAP and non-CAP classification. We found that the complexity of NREM sleep EEG signals increased with increasing arousability assessed by both R&K and CPC methods: wakefulness had the highest complexity, which then decreased with sleep depth.
This finding is consistent with the association of higher complexity with higher adaptive capacity and responsiveness to perturbations.
Furthermore, in this group of subjects, the complexity of REM sleep was between that of S1 and S2 stages. This finding differs from that of Liang et al. [10] who did not observe a statistically significant difference between the complexity of REM and S1 stages. The reason for this difference remains to be determined. Finally, our results support the point of view that S2 comprises two sub-states [3, 20]: the one in which HFC predominates is less complex than the one in which LFC predominates. These results in our small retrospective study of healthy male adults require confirmation in a larger, more diverse group of subjects.
V. Conclusion
This study reports the results of complexity analysis of sleep EEG in a group of healthy men. The comparison between these results and those of traditional R&K and CPC analyses indicates an inverse relationship between depth of sleep and EEG signal complexity. Furthermore, the study also supports the contention that stage 2 non-REM sleep has distinct sub-phases that map to CPC high- and low-frequency coupled dynamics. Ultimately, a sleep classification system that integrates a non-invasive assessment of cortical and subcortical dynamics will more accurately reflect underlying biological mechanisms.
Acknowledgments
Research supported by the Wyss Institute, the James S. McDonnell Foundation, the G. Harold & Leila Y. Mathers Foundation, the National Institutes of Health Grants R24HL114473; R00AG030677 and R01GM104987 and the Belgian Fonds de la Recherche Scientifique.
Contributor Information
Sara Mariani, Division of Sleep and Circadian Disorders, Department of Medicine, BWH, Boston, MA, USA.
Ana F. T. Borges, Department of Integrative Neurophysiology, Center for Neurogenomics and Cognitive Research, VU University Amsterdam, Netherlands
Teresa Henriques, Center for Anesthesia Research and Excellence (CARE) and Rey Institute of Nonlinear Dynamics in Physiology and Medicine, BIDMC, Boston.
Robert J. Thomas, Division of Pulmonary, Critical Care and Sleep Medicine, Department of Medicine, BIDMC, Boston
Samuel J. Leistedt, Sleep Laboratory, Department of Psychiatry, Hopital Erasme, Université Libre de Bruxelles, Brussels, Belgium
Paul Linkowski, Sleep Laboratory, Department of Psychiatry, Hopital Erasme, Université Libre de Bruxelles, Brussels, Belgium.
Jean-Pol Lanquart, Sleep Laboratory, Department of Psychiatry, Hopital Erasme, Université Libre de Bruxelles, Brussels, Belgium.
Ary L. Goldberger, Margret and H.A. Rey Institute of Nonlinear Dynamics in Physiology and Medicine, BIDMC, Boston, MA, USA
Madalena D. Costa, Margret and H.A. Rey Institute of Nonlinear Dynamics in Physiology and Medicine, BIDMC, Boston, MA, USA
References
- 1.Rechtschaffen A, Kales A. A Manual of Standardized Terminology, Techniques and Scoring System for Sleep Stages of Human Subjects. Washington, DC: US GPO, US Public Health Service; 1968. [Google Scholar]
- 2.Terzano MG, Parrino L, Sherieri A, et al. Atlas, rules, and recording techniques for the scoring of cyclic alternating pattern (CAP) in human sleep. Sleep Med. 2001;2:537–553. doi: 10.1016/s1389-9457(01)00149-6. [DOI] [PubMed] [Google Scholar]
- 3.Thomas RJ, Mietus JE, Peng CK, Goldberger AL. An electrocardiogram-based technique to assess cardiopulmonary coupling during sleep. Sleep. 2005;28:1151–1161. doi: 10.1093/sleep/28.9.1151. [DOI] [PubMed] [Google Scholar]
- 4.Thomas RJ, Mietus JE. Mapping sleep using coupled biological oscillations. IEEE-EMBC. 2011:1479–1482. doi: 10.1109/IEMBS.2011.6090361. [DOI] [PubMed] [Google Scholar]
- 5.Thomas RJ, Mietus JE, Peng CK, et al. Relationship between delta power and the electrocardiogram-derived cardiopulmonary spectrogram: possible implications for assessing the effectiveness of sleep. Sleep Med. 2014;15:125–131. doi: 10.1016/j.sleep.2013.10.002. [DOI] [PMC free article] [PubMed] [Google Scholar]
- 6.Nicolaou N, Georgiou J. The use of permutation entropy to characterize sleep electroencephalograms. Clin EEG Neurosci. 2011;42:24–28. doi: 10.1177/155005941104200107. [DOI] [PubMed] [Google Scholar]
- 7.Janjarasjitt S, Scher MS, Loparo KA. Nonlinear dynamical analysis of the neonatal EEG time series: The relationship between sleep state and complexity. Clin Neurophysiol. 2008;119:1812–1823. doi: 10.1016/j.clinph.2008.03.024. [DOI] [PubMed] [Google Scholar]
- 8.Bruce EN, Bruce MC, Vennelaganti S. Sample entropy tracks changes in electroencephalogram power spectrum with sleep state and aging. J Clin Neurophysiol. 2009;26:257–266. doi: 10.1097/WNP.0b013e3181b2f1e3. [DOI] [PMC free article] [PubMed] [Google Scholar]
- 9.Rodríguez-Sotelo JL, Osorio-Forero A, Jiménez-Rodríguez A, Cuesta-Frau D, Cirugeda-Roldán E, Peluffo D. Automatic sleep stages classification using eeg entropy features and unsupervised pattern analysis techniques. Entropy. 2014;16:6573–6589. [Google Scholar]
- 10.Liang S, Kuo C, Hu Y, Pan Y, Wang Y. Automatic stage scoring of single-channel sleep EEG by using multiscale entropy and autoregressive models. IEEE Trans Instrum Meas. 2012;61:1649–1657. [Google Scholar]
- 11.Chung CC, Kang JH, Yuan RY, Wu D, Chen CC, Chi NF, Chen PC, Hu CJ. Multiscale entropy analysis of electroencephalography during sleep in patients with Parkinson disease. Clin EEG Neurosci. 2013;44:221–226. doi: 10.1177/1550059412475066. [DOI] [PubMed] [Google Scholar]
- 12.Goldberger AL. Giles F. Filley lecture: complex systems. Proc Am Thorac Soc. 2006;3:467–471. doi: 10.1513/pats.200603-028MS. [DOI] [PMC free article] [PubMed] [Google Scholar]
- 13.Leistedt S, Dumont M, Lanquart JP, Jurysta F, Linkowski P. Characterization of the sleep EEG in acutely depressed men using detrended fluctuation analysis. Clin Neurophysiol. 2007;118:940–950. doi: 10.1016/j.clinph.2007.01.003. [DOI] [PubMed] [Google Scholar]
- 14.Nakamura M, Shibasaki H. Elimination of EKG artifacts from EEG records: a new method of non-cephalic referential EEG recording. Electroencephalogr Clin Neurophysiol. 1987;66:89–92. doi: 10.1016/0013-4694(87)90143-x. [DOI] [PubMed] [Google Scholar]
- 15.Pan J, Tompkins WJ. A real-time QRS detection algorithm. IEEE Trans Biomed Eng. 1985;32:230–236. doi: 10.1109/TBME.1985.325532. [DOI] [PubMed] [Google Scholar]
- 16.Costa M, Goldberger AL, Peng CK. Multiscale entropy analysis of biological signals. Phys Rev E. 2005;71:021906–021906. doi: 10.1103/PhysRevE.71.021906. [DOI] [PubMed] [Google Scholar]
- 17.Richman JS, Moorman JR. Physiological time-series analysis using approximate entropy and sample entropy. Am J Physiol Heart Circ Physiol. 2000;278:H2039–H2049. doi: 10.1152/ajpheart.2000.278.6.H2039. [DOI] [PubMed] [Google Scholar]
- 18.Mariani S, Borges AF, Henriques T, Goldberger AL, Costa MD. Use of multiscale entropy to facilitate artifact detection in electroencephalographic signals. IEEE-EMBC. 2015:7869–7872. doi: 10.1109/EMBC.2015.7320216. [DOI] [PMC free article] [PubMed] [Google Scholar]
- 19.Hanley JA, Negassa A, Edwardes MD, Forrester JE. Statistical analysis of correlated data using generalized estimating equations: an orientation. Am J Epidemiol. 2003;157:364–375. doi: 10.1093/aje/kwf215. [DOI] [PubMed] [Google Scholar]
- 20.Thomas RJ. Cyclic alternating pattern in the electroencephalogram: what is its clinical utility? Sleep. 2007;30:553–555. doi: 10.1093/sleep/30.5.553. [DOI] [PubMed] [Google Scholar]


