

Abstract
Aboveground and belowground populations of the mosquito Culex pipiens pipiens are traditionally classified as form (f.) pipiens and f. molestus, respectively, and gene flow between forms is thought to be limited. Relatively few f. molestus populations have been found in the United States, which has hindered their study in North America. In this investigation, we used microsatellites to characterize a recently discovered population of f. molestus in Chicago, IL, and compared levels of genetic diversity and differentiation in above-ground and below-ground populations from Chicago and New York City, NY. Levels of genetic diversity were markedly lower in both f. molestus populations. Pairwise FST values between populations indicated that f. molestus populations were highly divergent from each other, as well as from their associated aboveground populations. The most likely number of genetic clusters depended on the number of loci used; we began with a set of 8, and reanalyzed the specimens with 17. Using a panel of 17 loci, there were 4 clusters, 1 for each below-ground population, and 1 for each pair of above-ground populations. Our findings are supportive of the hypothesis that f. molestus populations in Chicago and New York City arose from local aboveground populations.
Keywords: population genetics, Culex pipiens, Culex pipiens form molestus, microsatellites, genetic structure
INTRODUCTION
Members of the Culex pipiens complex are difficult to distinguish morphologically. Found in more tropical areas, Culex pipiens quinquefasciatus Say can produce interfertile hybrids with the temperate Culex pipiens pipiens (Kothera et al. 2009). Culex p. pipiens is composed of 2 forms: form molestus Forskål, and form pipiens L. Although morphologically identical, the 2 forms exhibit important biological differences. Form pipiens individuals are anautogenous and undergo seasonal diapause, while f. molestus are autogenous and active all year (Chevillon et al. 1995, 1998; Vinogradova 2000). In the U.S., f. molestus is found underground, mostly in cities, and relatively few populations have been studied to date (Boston, MA, Spielman 1957; New York City, NY, Kent et al. 2007, Huang et al. 2008, Kothera et al. 2010; Marin County, CA, McAbee et al. 2004; Philadelphia, PA, Kilpatrick et al. 2007 and Chicago, IL, Wray 1946, Mutebi and Savage 2009, Kothera et al. 2010). All members of the Culex pipiens complex are efficient vectors of West Nile and other arboviruses (Tahori 1955, Turell et al. 2006, Kramer et al. 2008).
Form molestus populations persist in isolated, enclosed habitats, where presumably there is little migration and therefore a low degree of gene flow. It is possible that European f. molestus populations are the source of f. molestus populations in the U.S. If this is the case, one would expect to observe a high degree of genetic similarity among U.S. f. molestus populations. On the other hand, U.S. populations of f. molestus could be derived from local aboveground f. pipiens populations. Under this scenario, f. molestus populations would be expected to be genetically divergent from one another, each reflecting its own history of colonization, isolation, selection, and drift. Each f. molestus population would also be expected to share alleles with the local above-ground population.
With regard to whether the 2 forms hybridize, 1 well-characterized autogenous population in the U.S. was studied by Spielman (1957, 1964, 1971, 1973). He found limited hybridization between forms and concluded that while the 2 forms are interfertile, behavioral and ecological factors reduce opportunities for hybridization, and thus serve as effective reproductive isolating mechanisms. Huang et al. (2008) and Kothera et al. (2010) also found evidence for low levels of hybridization.
Gene flow tends to make populations homogenous, and there is an inverse relationship between the amount of gene flow between populations and the degree of genetic differentiation observed. Genetic differences are quantified within and between populations using neutral genetic markers, such as microsatellites, which look at changes that result from genetic drift. The 2 kinds of population data that are standard in population genetic studies are concerned with genetic diversity and genetic differentiation. Genetic diversity refers to the variety of alleles and genotypes present in a population (Frankham et al. 2002). It is measured within populations, and often expressed as Expected Heterozygosity (HE), the proportion of loci expected to be heterozygous in an individual, and Allelic Richness, which describes the number of alleles per locus per population. Differentiation portrays the degree of genetic difference between populations, is denoted by the statistic FST, and can range from 0–1. To give a qualitative idea of what constitutes significant amounts of genetic differentiation (and hence restricted gene flow), Wright (1978) stated that values over 0.05 suggested “moderate” genetic differentiation.
In this paper, we use the tools of population genetics to describe a f. molestus population collected from Chicago, Illinois (Mutebi and Savage 2009), and compare above and belowground populations of Cx. p. pipiens from Chicago and New York City, New York. The methods, data analyses and much of the data have been reported in Kothera et al. (2010), but here we include a comparison of the original analyses with additional ones performed with new microsatellite markers.
MATERIALS AND METHODS
In each city, 2 above-ground (f. pipiens) and 1 below-ground (f. molestus) populations were sampled (Table 1; Fig. 1). Originally, each individual was surveyed with a panel of 8 previously-published microsatellite loci. We have since developed an additional 11 loci, and dropped 2 of the original 8 from our assay. The resulting panel consists of 17 loci that we allocated to 2 multiplexes, the details of which are published elsewhere (Molecular Ecology Resources Primer Development Consortium et al. 2012).
Table 1.
Site and population information.
| Site Name | N1 | City | State | Latitude | Longitude | Location2 | Trap Method |
|---|---|---|---|---|---|---|---|
| Chi16 | 46 | Chicago | IL | 42.0317 | −87.7414 | Above | Gravid Trap |
| Chi17A | 50 | Chicago | IL | 41.9825 | −87.7506 | Above | Gravid Trap |
| ChiMolG0 | 50 | Chicago | IL | 41.6633 | −87.6083 | Below | Aspiration, Dippers |
| NYMolG0 | 20 | New York | NY | 40.7833 | −73.9500 | Below | CDC Light Trap |
| NYFT | 47 | New York | NY | 40.7900 | −73.7808 | Above | CDC Light Trap |
| NYGC | 34 | New York | NY | 40.6574 | −73.9862 | Above | CDC Light Trap |
Number of individuals sampled.
Above-or below-ground.
Fig. 1.

Map of sites sampled in this study. Maps of individual cities are shown at the same scale.
Specimens were collected in the winter where possible, so the presence or absence of diapause could be noted and the collection of the correct form confirmed. The exception was the sampling of the above-ground populations in Chicago, which were collected as part of another study. Autogeny or anautogeny was confirmed by colonizing the Chicago and New York City f. molestus populations, as well as the above-ground f. pipiens populations from New York City. The above-ground specimens from Chicago were presumed to be anautogenous.
Data analysis was the same as Kothera et al. (2010). Briefly, specimens were examined morphologically and screened with the ITS assay to confirm membership in the Cx. pipiens complex (Savage et al. 2007). After multiplexed polymerase chain reaction (PCR) with fluorescently labeled forward primers, fragments were visualized on a Beckman Coulter (Fullerton, CA) CEQ8000 sequencer, and a multilocus genotype was generated for each individual. Individuals missing more than 3 of the 17 loci were not included in the analyses. Convert (Glaubitz 2004) was used to format the data for analysis in Arlequin 3.1 (Excoffier et al. 2005) which was used for HE and FST calculations, FSTAT 2.9.3 (Goudet 1995) which was used for the calculation of Allelic Richness, and Structure (Pritchard 2000, Falush et al. 2003) which was used to determine the most likely number of genetic clusters in the data. Distruct (Rosenberg 2004) was used to visualize the Structure results. The program Bottleneck (Piry et al. 1999) was used to determine whether any of the populations showed evidence of a recent reduction in effective population size (Ne). Microsatellite Analyzer (MSA; Dieringer and Schlotterer 2003) was used to generate a matrix of percent shared alleles between pairs of populations. Phylip was used to generate a neighbor-joining tree from the resulting matrix (Felsenstein 1993).
RESULTS
Table 2 shows a comparison of genetic diversity measures, using 8 and 17 loci, for each of the 6 populations in this study. For both sets of loci, the genetic diversity in the below-ground populations is lower than in the above-ground ones. The allelic richness, which is adjusted to account for the smallest sample size, ranged from 2.616 in the ChiMolG0 population with 17 loci to 7.291 in the NYFT population with 8 loci. The average HE followed a similar trend, ranging from 0.383 for 8 loci in the NYMolG0 population to 0.670 in both the Chi16 and NYGC populations for 8 loci.
Table 2.
Among-population genetic diversity measures using 8 loci (top panel) and 17 loci (bottom panel) for 3 populations (2 above-ground, 1 below-ground) each from Chicago, IL and New York City, NY.
See Table 1 for site description.
| Chi16 | Chi17A | ChiMolG0 | NYMolG0 | NYFT | NYGC | |
|---|---|---|---|---|---|---|
| Average Allelic Richness | 6.958 | 6.526 | 2.742 | 3.533 | 7.291 | 7.214 |
| Average Expected Heterozygosity | 0.670 | 0.654 | 0.427 | 0.383 | 0.665 | 0.670 |
|
| ||||||
| Chi16 | Chi17A | ChiMolG0 | NYMolG0 | NYFT | NYGC | |
|
| ||||||
| Average Allelic Richness | 5.075 | 5.097 | 2.616 | 3.156 | 5.531 | 5.283 |
| Average Expected Heterozygosity | 0.642 | 0.624 | 0.445 | 0.448 | 0.655 | 0.653 |
Table 3 shows pairwise FST values between populations using 8 and 17 loci. For this measurement, there was a difference in the significance of the results when more loci were used. For example, with 8 loci none of the 4 above-ground populations are statistically significantly differentiated from each other. However, with 17 loci, the 2 above-ground populations in each city were differentiated from the above-ground populations in the other city. Regardless of which panel was used, the 2 belowground populations were highly differentiated from each other (FST = 0.394 and 0.248 for 8 and 17 loci, respectively), as well as from each above-ground population. Similarly, for either number of loci, the above-ground populations from each city were not statistically significantly differentiated from each other (FST range 0.000–0.006).
Table 3.
Pairwise FST values for pairs of populations in this study using 8 (top panel) and 17 (bottom panel) loci.
| Chi161 | Chi17A | ChiMolG0 | NYMolG0 | NYFT | |
|---|---|---|---|---|---|
| Chi17A | 0.001 | ||||
| ChiMolG0 | 0.2152 | 0.240 | |||
| NYMolG0 | 0.169 | 0.174 | 0.394 | ||
| NYFT | 0.003 | 0.003 | 0.232 | 0.152 | |
| NYGC | 0.007 | 0.004 | 0.253 | 0.158 | 0.003 |
|
| |||||
| Chi16 | Chi17A | ChiMolG0 | NYMolG0 | NYFT | |
|
| |||||
| Chi17A | 0.006 | ||||
| ChiMolG0 | 0.207 | 0.195 | |||
| NYMolG0 | 0.179 | 0.174 | 0.248 | ||
| NYFT | 0.044 | 0.049 | 0.217 | 0.137 | |
| NYGC | 0.031 | 0.029 | 0.215 | 0.129 | 0.000 |
See Table 1 for site descriptions.
Bold values are significant, P < 0.05.
Table 4 shows results from the Bottleneck program. With 8 loci, 1 population, ChiMolG0, exhibited a signature of a genetic bottleneck, having a significant Wilcoxon Test P-value, and a mode shift in allele frequency. When 17 loci were used, all populations had a significant Wilcoxon Test P-value, and 4 of 6 displayed a mode shift.
Table 4.
Results from the program Bottleneck for 8 (top panel) and 17 (bottom panel) loci.
| Population | Expected Het. Excess1 | Observed Het. Excess2 | Wilcoxon P-value3 | Mode shift4 |
|---|---|---|---|---|
| Chi16 | 4.61 | 3 | 0.84400 | NO |
| Chi17A | 4.62 | 3 | 0.84400 | NO |
| ChiMolG0 | 4.27 | 6 | 0.02000* | YES |
| NYMolG0 | 4.36 | 6 | 0.25000 | YES |
| NYFT | 4.60 | 5 | 0.31300 | NO |
| NYGC | 4.65 | 4 | 0.84400 | NO |
|
| ||||
| Population | Expected Het. Excess | Observed Het. Excess | Wilcoxon P-value | Mode shift |
|
| ||||
| Chi16 | 8.71 | 15 | 0.00004* | YES |
| Chi17A | 9.10 | 14 | 0.00042* | NO |
| ChiMolG0 | 7.59 | 14 | 0.00314* | YES |
| NYMolG0 | 8.68 | 13 | 0.01161* | YES |
| NYFT | 9.06 | 16 | 0.00003* | YES |
| NYGC | 8.96 | 15 | 0.00034* | NO |
Expected number of loci showing heterozygote excess.
Observed number of loci showing heterozygote excess.
One-tailed Wilcoxon’s test * P < 0.05.
Whether a shift in allele frequency distribution occurred.
The neighbor-joining tree produced from the matrix of percent shared alleles (using 17 loci) between pairs of populations is shown in Fig. 2. Trees for 8 and 17 loci were virtually identical. The configuration of the tree is consistent with the pairwise FST results between populations, with the 2 below-ground f. molestus populations highly diverged from the above-ground ones. In addition, the above-ground populations form a larger group, with each city’s f. pipiens populations in closest proximity.
Fig. 2.

Neighbor-joining tree of 6 populations based on proportion of shared alleles. See Table 1 for site descriptions.
The program Structure was used to determine the most likely number of genetic clusters represented by the data. Figure 3 shows results using 8 loci. The top panel shows the most likely number of clusters (K = 3) with the 2 belowground populations each occupying their own cluster, and the 4 above-ground populations in 1 cluster. The middle and bottom panels of Fig. 3 illustrate the stability of assignments of the 2 below-ground clusters. As the number of clusters is arbitrarily increased (K = 4, K = 5), the belowground population clusters remain intact, and the 1 above-ground cluster is further subdivided. Figure 4 shows Structure results using 17 loci. When additional loci are used, there is sufficient discriminating power to divide the single aboveground cluster seen with 8 loci into 2 clusters, 1 for each city.
Fig. 3.
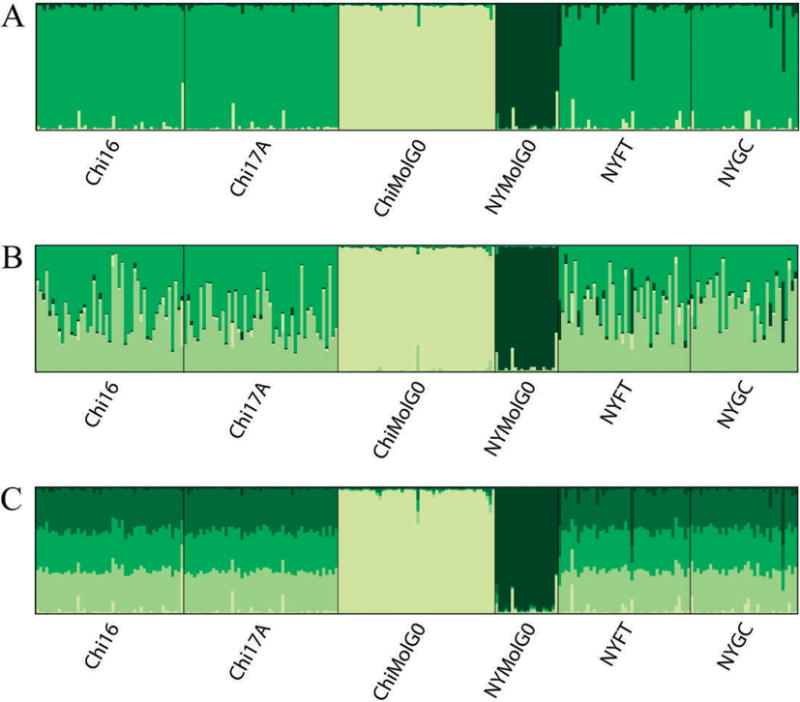
Results from Structure analysis, with 8 loci, default settings and no prior population information. Panel A shows individual assignments for the most likely number of clusters, K = 3. B and C illustrate the stability of assignments to the 2 f. molestus clusters when K is arbitrarily set at K = 4 and K = 5, respectively.
Fig. 4.
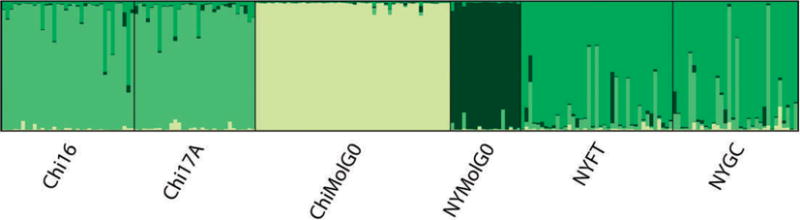
Results from Structure analysis with 17 loci, showing K = 4. Additional loci allow the program to discriminate between the 2 pairs of above-ground populations.
DISCUSSION
In general, the use of additional loci further elucidated genetic relationships within and among populations in this study. Several lines of evidence suggest that the f. molestus populations experience low amounts of gene flow, which has resulted in them showing low genetic diversity and a high degree of genetic differentiation. First, the values for HE and Allelic Richness are markedly lower for the f. molestus populations compared to the above-ground f. pipiens populations. The HE, for example, was approximately a third less in the f. molestus populations. Reduced genetic diversity can result from a genetic bottleneck, and there was evidence of a genetic bottleneck in several populations when 17 loci were used. Genetic bottlenecks reduce genetic diversity by reducing the Ne in the population (Nei et al. 1975).
If there was periodic gene flow from the aboveground populations, it would have a homogenizing effect, and the above- and below-ground populations would not be expected to exhibit a high degree of differentiation. Instead, significant FST values were found between all pairs of populations except each city’s pair of above-ground f. pipiens. Although the below-ground populations share alleles with the local above-ground populations (Kothera et al. 2010), these results reinforce the idea that the below-ground populations are largely reproductively isolated from the local aboveground populations.
The clustering program Structure was useful in illustrating the degree of divergence among populations. Using 8 or 17 loci, both analyses resulted in the 2 below-ground populations occupying their own cluster, and there was a high degree of stability with regard to assignments of individuals to these clusters. One difference that resulted from using additional loci was an ability to obtain a finer resolution on differences among the f. pipiens populations. With 8 loci, all of the f. pipiens populations occupied 1 cluster, while with 17, there was a higher posterior probability associated with having each city’s f. pipiens populations occupy its own cluster. This suggests that additional loci can provide further resolution with populations that share many alleles but are geographically positioned such that there is a low probability of gene flow between them.
In addition to genetically characterizing a recently-discovered f. molestus population (ChiMolG0; Mutebi and Savage 2009), a purpose of this study was to seek evidence in support of a hypothesis regarding the origin of f. molestus in the U.S. The results from this study indicate that the 2 f. molestus populations do not appear to be recently derived from a common ancestor, which should be the case if all of the f. molestus in the U.S. is European in origin. Instead, the 2 f. molestus populations show a very high degree of divergence, although they still share alleles with the associated above-ground populations. For this reason, the results suggest that U.S. f. molestus populations are more likely to be derived from local, above-ground f. pipiens populations that have undergone a reduction in genetic diversity, perhaps as a result of selection for the traits that distinguish f. molestus, namely autogeny and a lack of winter diapause.
Acknowledgments
Staff from the Office of Vector Surveillance and Control in the New York City Department of Health and Mental Hygiene located and provided safe access to specimens. Staff from the Metropolitan Water Reclamation District of Greater Chicago provided assistance with locating and providing safe access to specimens. Several tables and figures in the current manuscript were reproduced exactly from Kothera et al. 2010: Table 1, Figure 1, and Figure 3. In addition, we added data to several tables from Kothera et al. 2010 and presented them in the current manuscript: Table 3, Table 5 and Table 7 in Kothera et al. 2010 have been modified and are presented in this manuscript as Table 2, Table 4 and Table 3, respectively. All reproduced or modified tables and figures are used with permission from the Entomological Society of America.
REFERENCES CITED
- Chevillon C, Eritja R, Pasteur N, Raymond M. Commensalism, adaptation and gene flow–mosquitoes of the Culex pipiens complex in different habitats. Genet Res. 1995;66:147–157. doi: 10.1017/s0016672300034492. [DOI] [PubMed] [Google Scholar]
- Chevillon C, Rivet Y, Raymond M, Rousset F, Smouse PE, Pasteur N. Migration/selection balance and ecotypic differentiation in the mosquito Culex pipiens. Mol Ecol. 1998;7:197–208. [Google Scholar]
- Dieringer D, Schlötterer C. Microsatellite Analyzer (MSA): a platform independent analysis tool for large microsatellite data sets. Mol Ecol Notes. 2003;3:167–169. [Google Scholar]
- Excoffier L, Laval G, Schneider S. Arlequin ver. 3.0: An integrated software package for population genetics data analysis. Evol Bioinform Online. 2005;1:47–50. [PMC free article] [PubMed] [Google Scholar]
- Falush D, Stephens M, Pritchard JK. Inference of population structure using multilocus genotype data: linked loci and correlated allele frequencies. Genetics. 2003;164:1567–1587. doi: 10.1093/genetics/164.4.1567. [DOI] [PMC free article] [PubMed] [Google Scholar]
- Felsenstein J. PHYLIP (Phylogeny Inference Package) version 3.5c Distributed by the author. Department of Genetics, University of Washington; Seattle: 1993. [Google Scholar]
- Frankham R, Ballou JD, Briscoe DA. Introduction to conservation genetics. Cambridge: Cambridge University Press; 2002. [Google Scholar]
- Glaubitz JC. CONVERT: A user-friendly program to reformat diploid genotypic data for commonly used population genetic software packages. Mol Ecol Notes. 2004;4:309–310. [Google Scholar]
- Goudet J. FSTAT (Version 1.2): A computer program to calculate F-statistics. J Hered. 1995;86:485–486. [Google Scholar]
- Huang S, Molaei G, Andreadis TG. Genetic insights into the population structure of Culex pipiens (Diptera: Culicidae) in the northeastern United States by using microsatellite analysis. Am J Trop Med Hyg. 2008;79:518–527. [PubMed] [Google Scholar]
- Kent RJ, Harrington LC, Norris DE. Genetic differences between Culex pipiens f. molestus and Culex pipiens pipiens (Diptera: Culicidae) in New York. J Med Entomol. 2007;44:50–59. doi: 10.1603/0022-2585(2007)44[50:gdbcpf]2.0.co;2. [DOI] [PMC free article] [PubMed] [Google Scholar]
- Kilpatrick AM, Kramer LD, Jones MJ, Marra PP, Daszak P, Fonseca DM. Genetic influences on mosquito feeding behavior and the emergence of zoonotic pathogens. Am J Trop Med Hyg. 2007;77:667–671. [PubMed] [Google Scholar]
- Kothera L, Zimmerman EM, Richards CM, Savage HM. Microsatellite characterization of subspecies and their hybrids in Culex pipiens complex (Diptera: Culicidae) mosquitoes along a north-south transect in the central United States. J Med Entomol. 2009;46:236–248. doi: 10.1603/033.046.0208. [DOI] [PubMed] [Google Scholar]
- Kothera L, Godsey M, Mutebi J-P, Savage HM. A comparison of aboveground and belowground populations of Culex pipiens (Diptera: Culicidae) mosquitoes in Chicago, Illinois, and New York City, New York, using microsatellites. J Med Entomol. 2010;47:805–13. doi: 10.1603/me10031. [DOI] [PubMed] [Google Scholar]
- Kramer LD, Styer LM, Ebel GD. A global perspective on the epidemiology of West Nile virus. Ann Rev Entomol. 2008;53:61–81. doi: 10.1146/annurev.ento.53.103106.093258. [DOI] [PubMed] [Google Scholar]
- McAbee RD, Kang K-D, Stanich MA, Christiansen JA, Wheelock CE, Inman AD, Hammock BD, Cornel AJ. Pyrethroid tolerance in Culex pipiens pipiens var molestus from Marin County, California. Pest Manag Sci. 2004;60:359–368. doi: 10.1002/ps.799. [DOI] [PubMed] [Google Scholar]
- Molecular Ecology Resources Primer Development Consortium. Abreu AG, Albaina A, Alpermann TJ, Apkenas VE, Bankhead-Dronnet S, Bergek S, Berumen ML, Cho C-H, Clobert J, Coulon A, de Feraudy D, Estonba A, Hankeln T, Hochkirch A, Hsu T-W, Huang T-J, Irigoien X, Iriondo M, Kay KM, Kinitz T, Kothera L, le Hénanff M, Lieutier F, Lourdais O, Macrini CMT, Manzano C, Martin C, Morris VRF, Nanninga G, Pardo MA, Plieske J, Pointeau S, Prestegaard T, Quack M, Richard M, Savage HM, Schwarcz KD, Shade J, Simms EL, Solferini VN, Stevens VM, Veith M, Wen M-J, Wicker F, Yost JM, Zarraonaindia I. Permanent genetic resources added to the Molecular Ecology Resources Database 1 October 2011–30 November 2011. Mol Ecol Res. 2012;12:374–376. doi: 10.1111/j.1755-0998.2011.03109.x. [DOI] [PMC free article] [PubMed] [Google Scholar]
- Mutebi J-P, Savage HM. Discovery of Culex pipiens form molestus (Diptera: Culicidae) in Chicago. J Am Mosq Control Assoc. 2009;25:500–503. doi: 10.2987/09-5910.1. [DOI] [PubMed] [Google Scholar]
- Nei M, Maruyama T, Chakraborty R. The bottleneck effect and genetic variability in populations. Evolution. 1975;29:1–10. doi: 10.1111/j.1558-5646.1975.tb00807.x. [DOI] [PubMed] [Google Scholar]
- Piry S, Luikart G, Cornuet JM. BOTTLENECK: A computer program for detecting recent reductions in the effective population size using allele frequency data. J Hered. 1999;90:502–503. [Google Scholar]
- Pritchard JK, Stephens M, Donnelly P. Inference of population structure using multilocus genotype data. Genetics. 2000;155:945–959. doi: 10.1093/genetics/155.2.945. [DOI] [PMC free article] [PubMed] [Google Scholar]
- Rosenberg NA. Distruct: a program for the graphical display of population structure. Mol Ecol Notes. 2004;4:137–138. [Google Scholar]
- Savage HM, Aggarwal D, Apperson CS, Katholi CR, Gordon E, Hassan HK, Anderson M, Charnetzky D, McMillen L, Unnasch EA, Unnasch TR. Host choice and West Nile virus infection rates in bloodfed mosquitoes, including members of the Culex pipiens complex, from Memphis and Shelby County, Tennessee, 2002–2003. Vector-Borne Zoonotic Dis. 2007;7:365–386. doi: 10.1089/vbz.2006.0602. [DOI] [PMC free article] [PubMed] [Google Scholar]
- Spielman A. The inheritance of autogeny in the Culex pipiens complex of mosquitoes. Am J Hyg. 1957;65:404–425. doi: 10.1093/oxfordjournals.aje.a119878. [DOI] [PubMed] [Google Scholar]
- Spielman A. Studies on autogeny in Culex pipiens populations in nature I. Reproductive isolation between autogenous and anautogenous populations. Am J Hyg. 1964;80:175–83. doi: 10.1093/oxfordjournals.aje.a120466. [DOI] [PubMed] [Google Scholar]
- Spielman A. Studies on autogeny in natural populations of Culex pipiens II. Seasonal abundance of autogenous and anautogenous populations. J Med Entomol. 1971;8:555–561. doi: 10.1093/jmedent/8.5.555. [DOI] [PubMed] [Google Scholar]
- Spielman A. Studies on autogeny in natural populations of Culex pipiens III. Midsummer preparation for hibernation in anautogenous populations. J Med Entomol. 1973;10:319–324. doi: 10.1093/jmedent/10.4.319. [DOI] [PubMed] [Google Scholar]
- Tahori AS, Sterk VV, Goldblum N. Studies on the dynamic of experimental transmission of West Nile virus by Culex molestus. Am J Trop Med Hyg. 1955;4:1015–1027. doi: 10.4269/ajtmh.1955.4.1015. [DOI] [PubMed] [Google Scholar]
- Turell MJ, Mores CN, Dohm DJ, Komilov N, Paragas J, Lee JS, Shermuhemedova D, Endy TP, Kodirov A, Khodjaev S. Laboratory transmission of Japanese encephalitis and West Nile viruses by molestus form of Culex pipiens (Diptera: Culicidae) collected in Uzbekistan in 2004. J Med Entomol. 2006;43:296–300. doi: 10.1603/0022-2585(2006)043[0296:ltojea]2.0.co;2. [DOI] [PubMed] [Google Scholar]
- Vinogradova EB. Culex pipiens pipiens mosquitoes: Taxonomy, distribution, ecology, physiology, genetics, applied importance and control. Sofia, Bulgaria: Pensoft; 2000. [Google Scholar]
- Wray FC. Six generations of Culex pipiens without a bloodmeal. Mosq News. 1946;6:71–72. [PubMed] [Google Scholar]
- Wright S. Evolution and the genetics of populations, Vol 4, Variability within and among natural populations. Chicago, IL: University of Chicago Press; 1978. [Google Scholar]