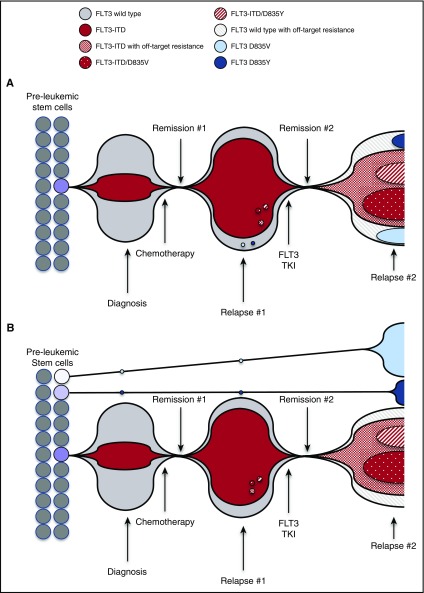
Figure 4.
Models for evolution of polyclonal FLT3-dependent and non-FLT3–dependent resistance after TKI treatment. Schematic representation illustrates proportion of FLT3 mutant and native FLT3 leukemia cell population at treatment time points. (A) At diagnosis, FLT3-ITD+ cells represent a portion of bulk tumor. Debulking after chemotherapy results in Remission #1, but is followed by emergence of chemotherapy-resistant FLT3-dependent leukemia cell populations at the time of Relapse #1. FLT3 TKI treatment induces Remission #2, but at the time of Relapse #2, multiple drug-resistant clones evolve, including FLT3 cells containing ITD and native FLT3 cells. (B) At diagnosis, FLT3-ITD+ cells represent a portion of bulk tumor. FLT3 D835V and D835Y mutations arise on native FLT3 alleles in separate leukemic stem cells, and these clones persist through chemotherapy. Debulking after chemotherapy results in Remission #1 but is followed by the emergence of chemotherapy-resistant FLT3-dependent leukemia cell populations at the time of Relapse #1. FLT3 TKI treatment induces Remission #2, but at the time of Relapse #2, multiple drug-resistant clones arise, including FLT3-ITD–containing clones (D835-mutant and off-target resistant), expansion of TKI-resistant native FLT3 D835–mutant clones, and off-target–resistant native FLT3 clones.

