
Fig. 6. Hyperpolarized action potential threshold and decrease in AHP are associated with persistent increase in MSN excitability.
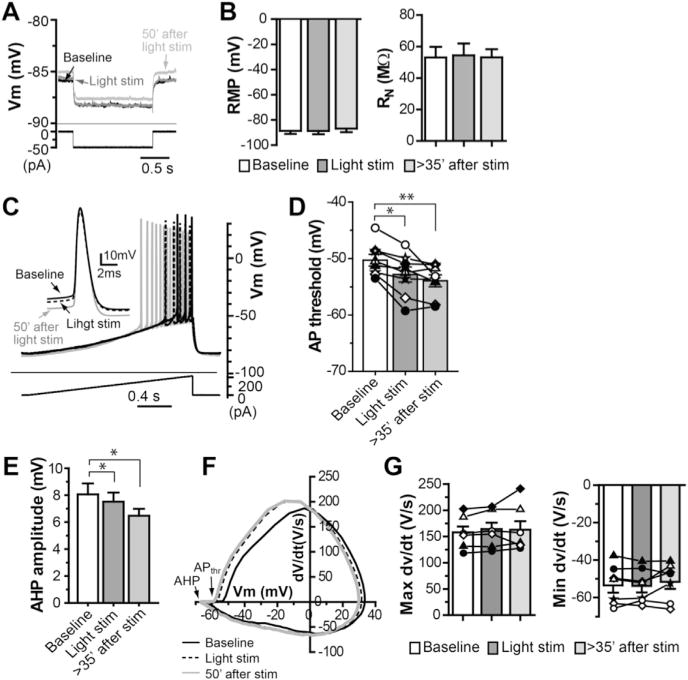
A. Sample traces of membrane potential in response to a hyperpolarization current injection (−50 pA) at resting membrane potential (RMP) to assess input resistance (RN) during baseline, light stimulation and 50 min after light stimulation. B. Summary of RMP and RN during baseline, light stimulation and over 35 min after light stimulation (one-way ANOVA with repeated measures, F(2,26) = 2.64, p > 0.1 for RMP; F(2,20) = 0.11, p > 0.5 for RN). C–E. Sample traces of action potentials (APs) elicited by depolarizing ramp current injection (C, inset: the first APs superimposed under different conditions as indicated), summary of AP threshold (D; one-way ANOVA with repeated measures, F(2,20) = 13.89, p < 0.001, with Dunnett’s post-test, **p < 0.005) and summary of AHP amplitude (E; one-way ANOVA with repeated measures, F(2,20) = 7.27, p < 0.01, with Dunnett’s post-test, *p < 0.01) during baseline, light stimulation and over 35 min after light stimulation. F. The rate of membrane potential change (dV/dt) plotted against membrane potential (phase plot) of APs from a typical experiment, demonstrating the changes of AP threshold (APthr) and AHP amplitude after light stimulation. G. Summary of maximal dv/dt and minimal dv/dt of APs during baseline, light stimulation and over 35 min after light stimulation (one-way ANOVA with repeated measures, F(2, 20) = 0.53, p > 0.5 for maximal dv/dt; F(2, 20) = 1.809, p > 0.1 for minimal dv/dt).