Figure 5.

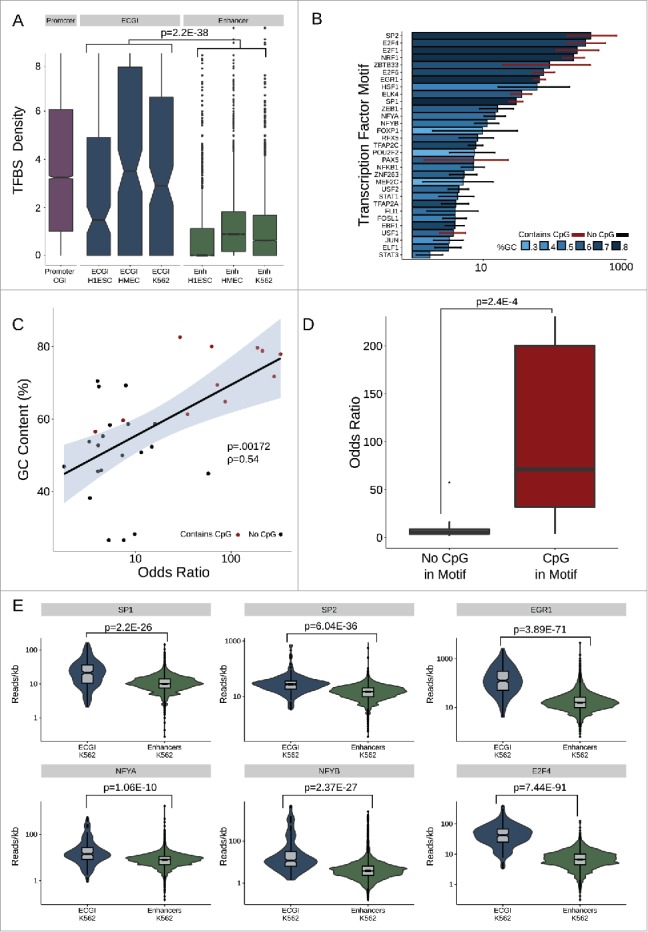
ECGI are enriched in transcription factor binding (A) Distribution of the density (per kb) of transcription factor binding sites (Jaspar database) among promoter CGI vs. ECGI or classical enhancers active in the indicated cell type. (B) Relative enrichment of each transcription factor binding motif in the cumulative pool of ECGI called in HMEC, K562, and H1ESCs relative to that in all classical enhancers from the same cell lines. Shown is the odds ratio (OR) of enrichment of each motif among ECGI vs. that of classical enhancers, +/−95% confidence interval for each motif for which the ratio was >1 (P<0.05, Fisher's exact). The GC content of each motif is indicated by the blue shaded bar color, and the error bar color indicates whether the motif contains a CpG (red, with CpG; black, without CpG). (C) Relationship between GC content of enriched motifs vs. OR of enrichment. Shown is the linear regression of the relationship, with shadows representing the 95% confidence interval. (D) Distribution of Odds Ratios of enrichment for those enriched motifs that contain or do not contain a CpG site. (E) Distribution of the ChIP-seq tag densities (reads/kb) for representative transcription factors whose motifs are enriched in ECGI among genomic loci classified as ECGI or classical enhancers active in K562 cells.
