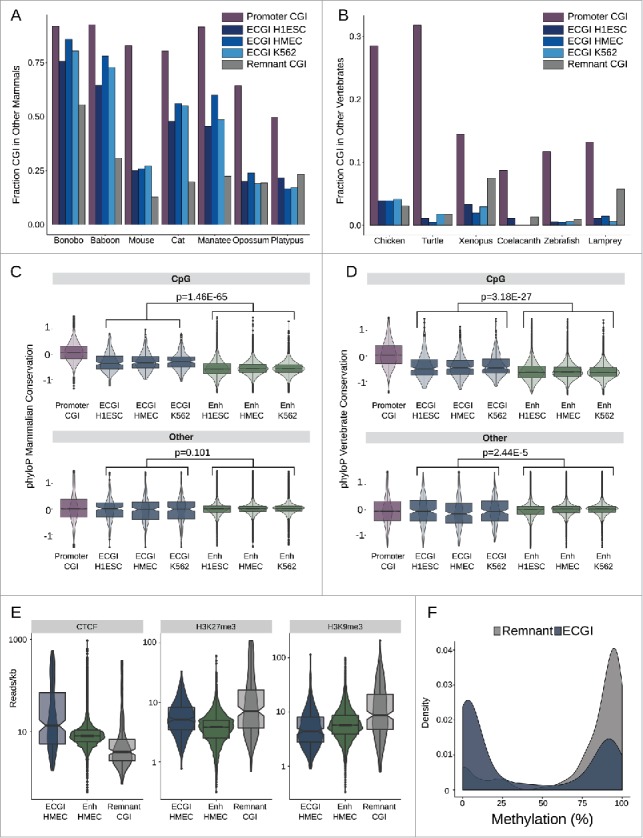
Figure 6.

ECGI CpG density is highly conserved in mammals Genomic coordinates annotated as CGI from each species indicated (UCSC) were lifted over to the human genome (hg19). Shown is the fraction of human CGI in each class that overlapped a CGI in the indicated mammals (A) or other vertebrates (B). Distribution of the average placental mammal (C) or vertebrate (D) phyloP score for CpG dinucleotides (top) or other residues (bottom) among human promoter CGI, ECGI, or classical enhancers active in the indicated cell type. E) Distribution of average ChIP-Seq tag densities (read/kb) for the indicated chromatin feature (CTCF, H3K27me3, H3K9me3) among ECGI, classical enhancers and Remnant CGI as defined in HMEC cells. F) Density of the mean DNA methylation level for ECGI or Remnant CGI as determined from H1ESC whole genome bisulfite sequencing.
