Abstract
Background
Although alcohol risk is heritable, few genetic risk variants have been identified. Longitudinal (EHR) data offer a largely untapped source of phenotypic information for genetic studies, but EHR-derived phenotypes for harmful alcohol exposure have yet to be validated. Using a variant of known effect, we used electronic health record (EHR) data to develop and validate a phenotype for harmful alcohol exposure that can be used to identify unknown genetic variants in large samples. Herein, we consider the validity of three approaches to using the three-item Alcohol Use Disorders Identification Test consumption measure (AUDIT-C) as a phenotype for harmful alcohol exposure.
Methods
First, using longitudinal AUDIT-C data from the Veterans Aging Cohort Biomarker Study (VACS-BC), we compared three metrics of AUDIT-C using correlation coefficients: 1) AUDIT-C closest to blood sampling (closest AUDIT-C), 2) the highest value (highest AUDIT-C), 3) and longitudinal trajectories generated using joint trajectory modeling (AUDIT-C trajectory). Second, we compared the associations of the three AUDIT-C metrics with phosphatidylethanol (PEth), a direct, quantitative biomarker for alcohol in the overall sample using chi-square tests for trend. Lastly, in the sub-sample of African Americans (AAs; n=1,503), we compared the associations of the three AUDIT-C metrics with rs2066702 a common missense (Arg369Cys) polymorphism of the ADH1B gene, which encodes an alcohol dehydrogenase isozyme.
Results
The sample (n=1,851, 94.5% male, 65% HIV+, mean age 52 years) had a median of 7 AUDIT-C scores over a median of 6.1 years. Highest AUDIT-C and AUDIT-C trajectory were correlated r=0.86. The closest AUDIT-C was obtained a median of 2.26 years after the VACS-BC blood draw. Overall and among AAs, all three AUDIT-C metrics were associated with PEth (all p<.05), but the gradient was steepest with AUDIT-C trajectory. Among AAs (36% with the protective ADH1B allele), the association of rs2066702 with AUDIT-C trajectory and highest AUDIT-C were statistically significant (p<.05), and the gradient was steeper for the AUDIT-C trajectory than for the highest AUDIT-C. The closest AUDIT-C was not statistically significantly associated with rs2066702.
Conclusion
EHR data can be used to identify complex phenotypes such as harmful alcohol use. The validity of the phenotype may be enhanced through the use of longitudinal trajectories.
Keywords: Alcohol Use Disorder, AUDIT-C, ADH1B, rs2066702, Arg369Cys, African American, electronic health record data, Trajectory Analyses
Graphical Abstract
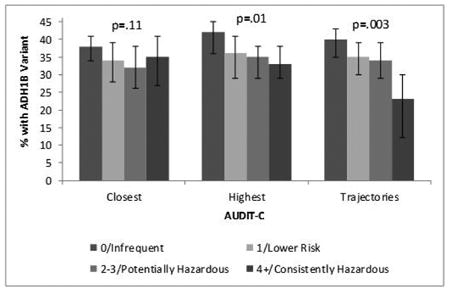
We used AUDIT-C measures recorded in the National VA Healthcare System Electronic Health Record to develop and validate a phenotype of harmful alcohol use for genetic discovery. We found that the strength of association with the common missense (ARG369Cys) polymorphism of the ADH1B gene was substantially enhance using trajectories of AUDIT-C measured over time. Figure 2 from the paper illustrates the association between the ADH1B variant and closest AUDIT-C, highest AUDIT-C, and trajectories of AUDIT-C.
Introduction
Although twin and family-based studies show that about 50% of alcohol dependence (AD) risk is heritable, replicable findings have identified few corresponding genetic variants. Using a known variant, we used electronic health record data to develop and validate a phenotype for harmful alcohol exposure that could be used to identify unknown genetic variants in large samples. Linkage and candidate gene studies have consistently identified risk loci for the genes encoding the alcohol-metabolizing enzymes (Foroud et al., 2010). Similar findings have emerged from genome-wide association studies (GWAS) (Hart and Kranzler, 2015). A major limitation to gene finding for AD is the relatively small sample size of many of the published studies. The largest GWAS of AD to date included a discovery and replication sample of 16,087 subjects (Gelernter et al., 2014). That study confirmed previously identified risk loci mapped to the alcohol-metabolizing enzyme genes ADH1B in both European Americans (Arg48His or rs1229984, P = 1.17 × 10⁻³¹) and African Americans (AAs; Arg369Cys or rs2066702, P = 6.33 × 10⁻¹⁷) and ADH1C in AAs (Thr151Thr or rs2241894, P= 4.94 × 10⁻¹⁰). The study also identified numerous novel significant risk loci, across the ADH gene array region and elsewhere. Because these variants account for only a small percentage of the heritability of AD, large-scale studies to identify additional loci are warranted. The Million Veteran Program (MVP) of the Department of Veterans Affairs is in the process of obtaining phenotypic and genomic data on one million people. One goal of the MVP is to identify genetic variation contributing to AD risk.
A challenge in a large-scale study is the ability to identify a valid AD phenotype efficiently. Because alcohol dependence is a complex trait and comparatively small samples of alcohol dependent subjects have been studied to date using GWAS, it is not surprising that few specific variants have been implicated consistently (Hart and Kranzler, 2015). Electronic health record (EHR) data are a potentially important source of phenotypic information. As MVP investigators, we sought to develop an EHR-based approach that went beyond administrative diagnostic codes for alcohol use disorder, which can be insensitive (McGinnis et al., 2010, McGinnis et al., 2013). Alcohol screening questionnaires, which are increasingly used in routine clinical care, could provide an alternative. One such instrument is the Alcohol Use Disorders Identification Test (Saunders et al., 1993) or AUDIT, a 10-question, self-report screening test for harmful alcohol use. The AUDIT-C, which includes only the first three (quantity and frequency) questions of the AUDIT, is a practical, valid, primary care screening test for heavy drinking and/or active alcohol abuse or dependence. Developed using questionnaire and telephone interview data from 243 patients at three Veterans Affairs (VA) general medical clinics (Bush et al., 1998a), it has become the most popular short version of the AUDIT. The three-item AUDIT-C demonstrated greater accuracy for heavy drinking than the full AUDIT and performed similarly in detecting heavy drinking and/or active alcohol abuse or dependence (Bush et al., 1998a). Since 2007, the AUDIT-C has been a required annual screening test in primary care in the Veterans Affairs Health System (VAHS), where it has high sensitivity and specificity for alcohol use disorders (Barnes et al., 2010, McGinnis et al., 2013). Although the AUDIT-C is widely used, inaccurate reporting could limit its utility in identifying AD genetic variants. In contrast, an alcohol biomarker should provide an unbiased estimate, but is not readily available in large samples.
We first compared three AUDIT-C metrics (closest, highest, trajectory) to each other. Second, we compared the three AUDIT-C metrics to see which demonstrated the strongest association with a direct alcohol biomarker, phosphatidylethanol (PEth). Lastly, we compared the associations of the three AUDIT-C metrics with rs2066702, the Arg369Cys missense polymorphism of the ADH1B gene, which encodes an alcohol dehydrogenase isozyme that is common in African Americans (AA).
Methods
Subjects
The Veterans Aging Cohort Study Biomarker Cohort (VACS-BC) has been described in detail previously (Armah et al., 2012, Freiberg et al., 2016, Justice et al., 2012a). Briefly, it is a smaller sample, nested within a large observational cohort based on data from the national VA EHR that includes all HIV-infected patients in VA care (over 50,000 HIV+ subjects) and uninfected patients (over 100,000) matched on region, age, race/ethnicity, and sex. The biomarker cohort includes 1,525 HIV+ and 843 uninfected individuals who provided a blood sample in 2005-2007 (So-Armah et al., 2014, Armah et al., 2012, Justice et al., 2012b). We used AUDIT-C data collected during routine clinical care from 2007 (when first available from EHR extracts) to 2016; note that AUDIT-C data are from a later timeframe than PEth. In the analyses comparing AUDIT-C metrics to each other and to PEth, we included participants for whom AUDIT-C data were available in the EHR and who had PEth values (n=1,851). The analysis comparing AUDIT-C to presence/absence of the ADH1B 369Cys allele was limited to 1,503 AAs with genotype and AUDIT-C data, as this particular variant is rare in most other racial/ethnic groups. In this sample, the 369Cys allele was present in 36% of AAs, 0.3% of whites, and 6% of all others. A total of 1,342 participants were in both analytic samples.
Measures
AUDIT-C
The three AUDIT-C questions are: 1) How often do you have a drink containing alcohol? (Choices: never, monthly or less, 2-4 times a month, 2-3 times a week; or 4 or more times a week). 2) How many standard drinks containing alcohol do you have on a typical day? (Choices: 1 or 2; 3 or 4; 5 or 6; 7 to 9; or 10 or more). 3) How often do you have six or more drinks on one occasion? (Choice: never; less than monthly; monthly; weekly; daily or almost daily). Responses to each question are assigned 0-4 points, yielding a total score of 0-12. AUDIT-C screening thresholds that maximize sensitivity and specificity for detecting unhealthy alcohol use are ≥4 in men and ≥3 in women, with the likelihood in both sexes of alcohol-related harm increasing as AUDIT-C scores increase (Bradley et al., 2007, Bush et al., 1998).
PEth
Phosphatidylethanol (PEth) assays were run on dried blood spots created from frozen PBMCs stored at -80C. PEth comprises a group of phospholipids formed from phosphatidylcholine by the action of phospholipase D following the ingestion of alcohol (Helander and Zheng, 2009). PEth can be assayed in whole blood or from dried blood spots using liquid chromatography and mass spectrometry. According to the test lab, the United States Drug Testing Laboratories, Inc. (USDTL), the limit of detection is 2 ng/mL and the lower limit of quantitation is 8 ng/mL. The concentration of PEth is linearly related to the volume of alcohol consumed (Aradottir et al., 2006). A cutoff of 20 ng/mL is used for forensic work and levels >100 ng/mL indicate heavy drinking (J. Jones, USDTL, personal communication). PEth concentrations >500 ng/mL are typically seen in individuals with prolonged heavy drinking (Wurst et al., 2015). Because PEth has a half-life of ∼4 days, it can be assayed in the blood of heavy drinkers for up to 3 weeks after alcohol is consumed (Wurst et al., 2015). The sensitivity of PEth has been reported to be 99% (Aradottir et al., 2006), with several studies showing the assay to have perfect specificity, including in the presence of liver disease and hypertension. A major advantage of PEth is that, unlike many other candidate alcohol biomarkers, it does not appear to be “influenced by age, gender, other ingested substances or non alcohol-associated diseases” (Viel et al., 2012).
Arg369Cys
Variation in ADH1B is the most frequently identified molecular genetic risk factor for alcohol dependence. The variant 369Cys allele is associated with reduced risk of alcohol dependence (Gelernter et al. 2014). More than half of the DNA samples in the present study (N = 1291) were genotyped on the Illumina HumanOmniExpress Beadchip containing 980,000 SNPs. Including rs2066702. The rest (N = 955) were genotyped on the Illlumina HumanCoreExome BeadChip containing approximately 550,000 SNPs, which did not include rs2066702. In these samples the SNP was imputed based on 1000 Genomes phase 3 data data (http://www.1000genomes.org/about) using IMPUTE 2 (https://mathgen.stats.ox.ac.uk/impute/impute_v2.html).
Analyses
Using all available EHR AUDIT-C measurements, we created 3 AUDIT-C metrics: 1) a cross-sectional score using the value closest to the date of blood sampling; and two longitudinal measures: 2) the highest AUDIT-C value over the period 2007-2016; and 3) the trajectory of AUDIT-C scores. We differentiated the closest and highest AUDIT-C scores into categories: 0, 1, 2-3, and 4+; the highest category is based on prior work showing AUDIT-C 4+ as maximizing the sensitivity and specificity for identifying unhealthy alcohol use in men (Bradley et al., 2007, Bush et al., 1998b). As previously reported (Marshall et al., 2015), joint trajectory modeling sorts each participant's AUDIT-C values into “clusters” and estimates distinct trajectories. We used age as the time scale to account for decreased alcohol use with age. The procedure calculates each individual's probability of belonging to each trajectory and assigns the individual to the trajectory with the highest probability of membership. We used a zero-inflated Poisson model (Jones et al., 2001) and evaluated 3-, 4- and 5-group models. For maximum precision, trajectories were developed in the full VACS sample.
First, we compared the three AUDIT-C metrics (closest, highest, and trajectory) using the following pairwise comparisons: closest vs highest; closest vs trajectory; and highest vs trajectory. We also generated Spearman correlation coefficients between the three AUDIT-C metrics. Next, median PEth values were summarized and categorized by cutoff values (>8, >20, >100 ng/mL). The associations of the three AUDIT-C metrics with PEth were tested using non-parametric tests for trend for continuous PEth values and chi-square tests for trend for dichotomous PEth variables. Among AAs, the associations of AUDIT-C metrics with rs2066702 were tested using chi-square tests for trend.
Results
Both the AUDIT-C and PEth sample and the AUDIT-C and ADH1B variant subset were mostly male (95%), with a median age of 52 years at blood sampling, and about 65% were HIV+ (Table 1). Nearly three-fourths of the overall sample were AA. Agreement between self-report and genetic markers for race (kappa=0.85) and sex (kappa=0.98) was excellent.
Table 1. Characteristics of Participants by Study Subset.
| All Races AUDIT-C and PEth (n=1851) |
African Americans AUDIT-C and ADH1B (n=1501) |
|
|---|---|---|
| HIV+ | 64% | 65% |
| Male | 95% | 94% |
| Age*, mean (SD) | 52 (9) | 52 (8) |
| Race/Ethnicity | n/a | |
| African-American | 72% | |
| White | 21% | |
| Hispanic/other | 7% | |
| Years from PEth to AUDIT-C, median (IQR) | 2.3 (1.7-2.8) | n/a |
| Closest AUDIT-C | ||
| 0 | 51% | 53% |
| 1 | 19% | 18% |
| 2-3 | 17% | 17% |
| 4+ | 13% | 12% |
| Highest AUDIT-C | ||
| 0 | 27% | 27% |
| 1 | 18% | 17% |
| 2-3 | 26% | 26% |
| 4+ | 29% | 31% |
| Trajectory AUDIT-C | ||
| Infrequent | 38% | 39% |
| Lower Risk | 34% | 33% |
| Potentially Hazardous | 22% | 23% |
| Consistently Hazardous | 5% | 5% |
Age at time of blood draw
AUDIT C trajectory fit, as measured by the Bayesian Information Criterion (BIC), improved substantially when increasing from 3 to 4 groups, but only slightly between 4 and 5 groups. Lower-level group membership was stable, with differences in assignment occurring only at the higher AUDIT-C levels. In the analytic sample, the highest level of the 4-group model contained 98 people. We chose the 4-group model to avoid unstable estimates that could result from using a 5-group model with even fewer subjects in the highest level. The AUDIT-C trajectory groups were designated as infrequent, lower risk, potentially hazardous and consistently hazardous.
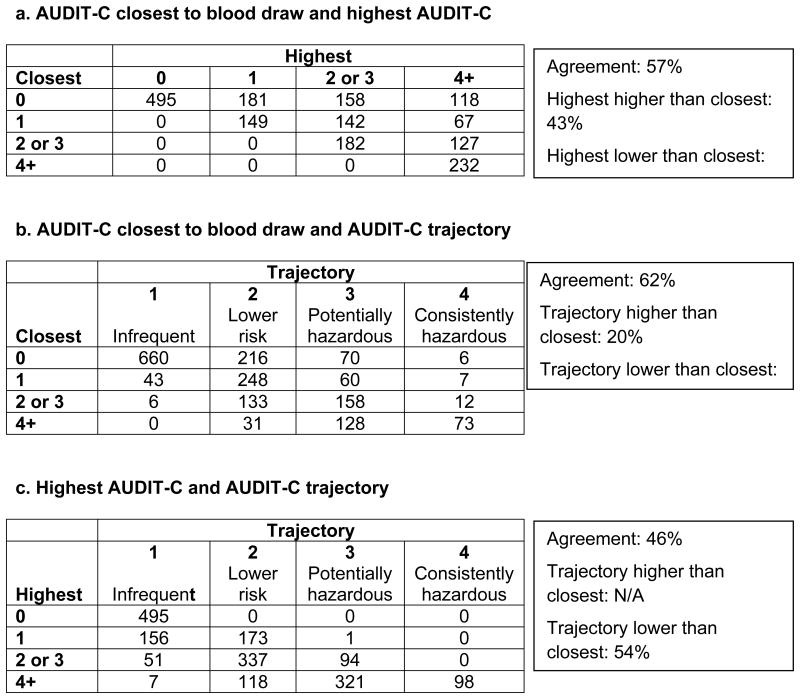
There were differences in how participants were classified using the 3 AUDIT-C metrics. A comparison of groups based on the AUDIT-C closest to the PEth date with groups based on the highest AUDIT-C showed that 43% of subjects were classified in a higher group using the longitudinal metric (Table 2a). Comparing closest AUDIT-C with AUDIT-C trajectory, 38% of subjects were classified differently using the longitudinal metric (Table 2b); 18% to a lower group and 20% to a higher group. Comparing highest AUDIT-C groups with AUDIT-C trajectories (Table 2c), 54% were classified in a lower category with the trajectory metric. Correlation coefficients for the three AUDIT-C metrics were 0.55 for closest and highest, 0.56 for closest and trajectory, and 0.86 for the two longitudinal metrics: highest and trajectory.
Table 2. Comparison of Three AUDIT-C Metrics.
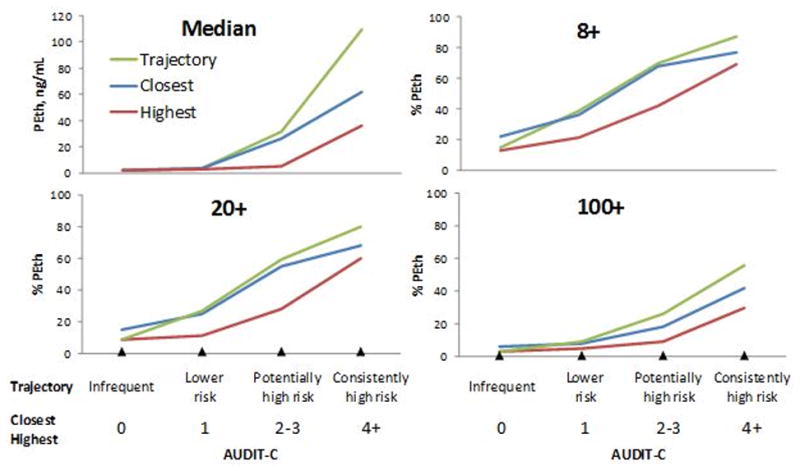
AUDIT-C metrics were associated with PEth values (Figure 1). Median time between PEth and closest AUDIT-C was 2.3 years (IQR=1.7-2.8). All three AUDIT-C metrics (closest, highest, and trajectory) were associated with PEth values (median and PEth thresholds 8+, 20+ and 100+). This was true both when all race/ethnicities were included and when just AAs were included, all p <0.001 (Figures 1a and 1b). AUDIT-C trajectory demonstrated the steepest gradient, followed by closest AUDIT-C, with highest AUDIT-C showing the lowest gradient.
Figure 1a. PEth vs. AUDIT-C Metrics for All Racial/Ethnic Groups (n=1,851).
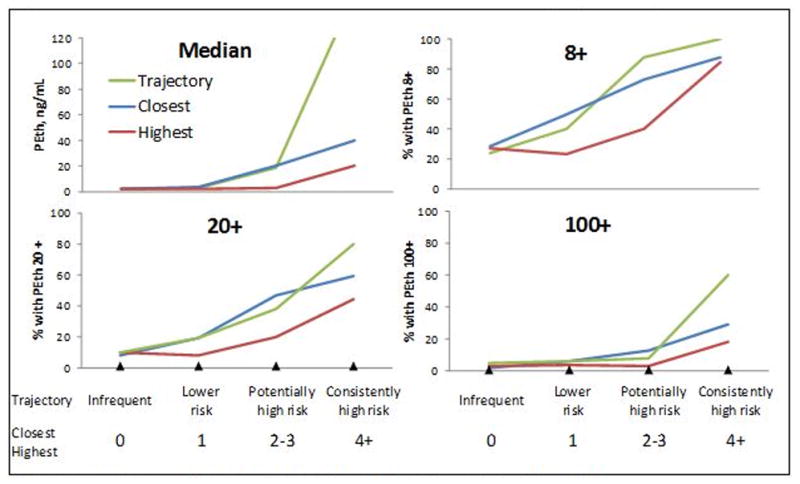
Figure 1b. PEth vs. AUDIT-C Metrics for African Americans (n=1,342).
The proportion of AAs with the 369Cys allele decreased significantly as the highest and trajectory AUDIT-C metrics increased (Figure 2). The closest AUDIT-C was not statistically significantly associated with rs2066702.
Figure 2. Arg369Cys by AUDIT-C in African Americans (n=1503).
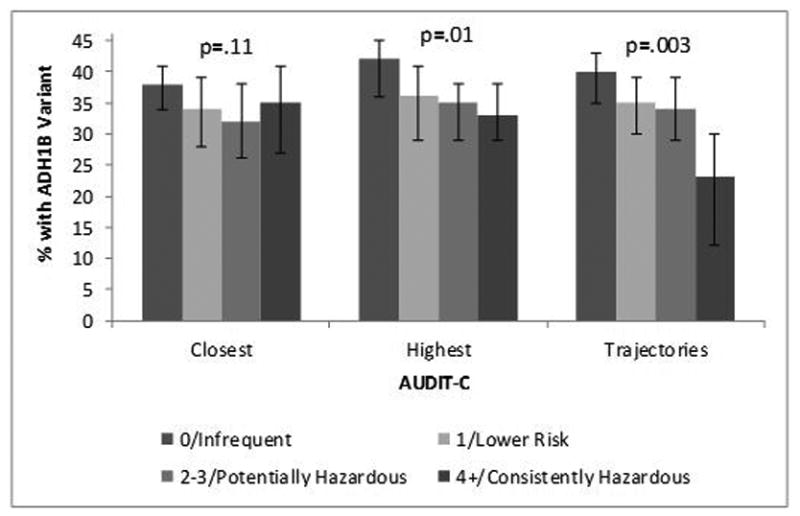
Prevalence of the 369Cys Allele by AUDIT-C Metrics Among African Americans (n=1,503). P-value is from chi-square test for trend
Discussion
We found that EHR data can be used to phenotype a complex condition such as harmful alcohol use. The validity of the phenotype was enhanced when longitudinal data were integrated using trajectories or highest value rather than with a single cross-sectional measure. All three AUDIT-C metrics were associated with PEth concentrations, a highly sensitive and specific measure of heavy drinking (Wurst et al., 2015). Closest AUDIT-C scores were not significantly associated with the most frequently identified molecular genetic risk factor for alcohol dependence, a missense polymorphism in ADH1B, which encodes an alcohol metabolic enzyme. Highest AUDIT-C score was statistically significantly associated with the ADH1B polymorphism, rs2066702. However, AUDIT-C trajectory showed a steeper gradient and a robust and significant association with the variant. This is likely because the trajectory score provides greater information on the pattern of harmful drinking over time than either of the other two AUDIT-C metrics, and is thereby more reflective of typical alcohol exposure than either a single point in time or peak exposure.
A limitation of our study is that there is a gap in time between when AUDIT-C was measured (2005-2007) and when the PEth and ADH1B samples were collected (2007-2016). Similarly, the long-term stability of PEth in frozen blood samples is unknown. Faller et al found no assay loss in samples stored for 30 days at -80C(Faller et al., 2013). We would expect that any bias introduced by the gap between AUDIT-C and sample collection, or possible sample degradation while in storage, would be toward the null. However, we found strong associations between PEth and all three AUDIT-C metrics, similar to those reported by Piano et al(Piano et al., 2015) from samples not subject to lengthy storage. Thus we find the consistency of biomarker results and self- report reassuring. ADH1B genotype does not change over time, so the difference in time between EHR AUDIT-C and ADH1B genotype is not relevant.
Our findings extend the current literature, in which the most common approach to defining a phenotype for harmful alcohol consumption has been the diagnosis of alcohol use disorder based on the Diagnostic and Statistical Manual of Mental Disorders (DSM). While this phenotype has clinical utility, it is time-consuming and costly to obtain, substantially limiting large-scale genetic discovery. Although it may also be tempting to use the International Classification of Diseases (ICD) administrative codes as a phenotype for large-scale discovery, these tend to be highly insensitive measures (McGinnis et al., 2010, McGinnis et al., 2013). By first validating a set of AUDIT-C measures against a direct alcohol biomarker (PEth) and then comparing their association with an established molecular genetic factor that is protective against harmful alcohol use, we were able to demonstrate the superiority of AUDIT-C trajectories over both the highest and closest AUDIT-C metrics.
These findings indicate that useful phenotypes for complex behaviors like alcohol use can be obtained using longitudinal EHR data, but the quality of the phenotype may depend upon the length of the observation period and the statistical approach used to calculate the metric. Our sample had an average of 7 AUDIT-C measurements collected over an average of more than 6 years. While our sample size did not allow us to explore the extent to which the more robust associations with PEth and ADH1B seen with the trajectories depended upon the number of observations or the time interval covered, we were able to demonstrate the superiority of trajectories over both single measure metrics. Of note, while the majority of healthcare systems have adopted EHRs and many use the AUDIT-C to screen for harmful drinking, the VAHS is one of the few healthcare systems that currently have longitudinal data spanning more than 6 years.
Our focus on AAs both strengthened and limited the study. Few prior studies have focused on phenotyping harmful alcohol use for genetic discovery among AAs. However, our sample was large enough to examine the validity of the AUDIT-C only in AAs. Because another ADH1B missense polymorphism, Arg48His, has been shown to be protective from alcohol dependence in Asians (Li et al., 2011) and European Americans (Bierut et al., 2012, Gelernter et al., 2014), the same approach could be used to evaluate the AUDIT-C in these populations. Despite being limited to one population, the findings reported here indicate that longitudinal AUDIT-C data provide a valid metric of harmful alcohol use that may be a useful phenotype for genetic discovery. Because the AUDIT-C is a widely used screening measure, when administered as a repeated metric of harmful drinking, it may provide an important source of phenotypic information for large-scale genetic studies.
Footnotes
Disclosure: Dr. Kranzler has been an advisory board member, consultant, or CME speaker for Indivior and Lundbeck. He is also a member of the American Society of Clinical Psychopharmacology's Alcohol Clinical Trials Initiative, which was supported in the last three years by AbbVie, Alkermes, Ethypharm, Indivior, Lilly, Lundbeck, Otsuka, Pfizer, and XenoPort.
Reference List
- Barnes AJ, Moore AA, Xu H, Ang A, Tallen L, Mirkin M, Ettner SL. Prevalence and correlates of at-risk drinking among older adults: the project SHARE study. J Gen Intern Med. 2010;25:840–846. doi: 10.1007/s11606-010-1341-x. [DOI] [PMC free article] [PubMed] [Google Scholar]
- Bierut LJ, Goate AM, Breslau N, Johnson EO, Bertelsen S, Fox L, Agrawal A, Bucholz KK, Grucza R, Hesselbrock V, Kramer J, Kuperman S, Nurnberger J, Porjesz B, Saccone NL, Schuckit M, Tischfield J, Wang JC, Foroud T, Rice JP, Edenberg HJ. ADH1B is associated with alcohol dependence and alcohol consumption in populations of European and African ancestry. Mol Psychiatry. 2012;17:445–450. doi: 10.1038/mp.2011.124. [DOI] [PMC free article] [PubMed] [Google Scholar]
- Bradley KA, DeBenedetti AF, Volk RJ, Williams EC, Frank D, Kivlahan DR. AUDIT-C as a brief screen for alcohol misuse in primary care. Alcohol Clin Exp Res. 2007;31:1208–1217. doi: 10.1111/j.1530-0277.2007.00403.x. [DOI] [PubMed] [Google Scholar]
- Bush K, Kivlahan DR, McDonell MB, Fihn SD, Bradley KA. The AUDIT alcohol consumption questions (AUDIT-C): an effective brief screening test for problem drinking. Ambulatory Care Quality Improvement Project (ACQUIP). Alcohol Use Disorders Identification Test. Arch Intern Med. 1998a;158 doi: 10.1001/archinte.158.16.1789. [DOI] [PubMed] [Google Scholar]
- Bush K, Kivlahan DR, McDonell MB, Fihn SD, Bradley KA. The AUDIT alcohol consumption questions (AUDIT-C): an effective brief screening test for problem drinking. Ambulatory Care Quality Improvement Project (ACQUIP). Alcohol Use Disorders Identification Test. Test Arch Intern Med. 1998b;158:1789–1795. doi: 10.1001/archinte.158.16.1789. [DOI] [PubMed] [Google Scholar]
- Faller A, Richter B, Kluge M, Koenig P, Seitz HK, Skopp G. Stability of phosphatidylethanol species in spiked and authentic whole blood and matching dried blood spots. Int J Legal Med. 2013;127:603–610. doi: 10.1007/s00414-012-0799-y. [DOI] [PubMed] [Google Scholar]
- Foroud T, Edenberg HJ, Crabbe JC. Genetic research: who is at risk for alcoholism. Alcohol research & health : the journal of the National Institute on Alcohol Abuse and Alcoholism. 2010;33:64–75. [PMC free article] [PubMed] [Google Scholar]
- Gelernter J, Kranzler HR, Sherva R, Almasy L, Koesterer R, Smith AH, Anton R, Preuss UW, Ridinger M, Rujescu D, Wodarz N, Zill P, Zhao H, Farrer LA. Genome-wide association study of alcohol dependence:significant findings in African- and European-Americans including novel risk loci. Mol Psychiatry. 2014;19:41–49. doi: 10.1038/mp.2013.145. [DOI] [PMC free article] [PubMed] [Google Scholar]
- Hart AB, Kranzler HR. Alcohol Dependence Genetics: Lessons Learned From Genome-Wide Association Studies (GWAS) and Post-GWAS Analyses. Alcohol Clin Exp Res. 2015;39:1312–1327. doi: 10.1111/acer.12792. [DOI] [PMC free article] [PubMed] [Google Scholar]
- Li D, Zhao H, Gelernter J. Strong association of the alcohol dehydrogenase 1B gene (ADH1B) with alcohol dependence and alcohol-induced medical diseases. Biol Psychiatry. 2011;70:504–512. doi: 10.1016/j.biopsych.2011.02.024. [DOI] [PMC free article] [PubMed] [Google Scholar]
- McGinnis K, Justice AC, Saitz R, Kraemer K, Bryant K, Fiellin D. Measures of unhealthy alcohol use among HIV infected and uninfected patients in the Veterans Aging Cohort Study. Satellite at the 33rd Annual Research Society on Alcoholism Scientific Meeting 2010 [Google Scholar]
- McGinnis KA, Justice AC, Kraemer KL, Saitz R, Bryant KJ, Fiellin DA. Comparing alcohol screening measures among HIV-infected and -uninfected men. Alcohol Clin Exp Res. 2013;37:435–442. doi: 10.1111/j.1530-0277.2012.01937.x. [DOI] [PMC free article] [PubMed] [Google Scholar]
- Piano MR, Tiwari S, Nevoral L, Phillips SA. Phosphatidylethanol Levels Are Elevated and Correlate Strongly with AUDIT Scores in Young Adult Binge Drinkers. Alcohol Alcohol. 2015;50:519–525. doi: 10.1093/alcalc/agv049. [DOI] [PubMed] [Google Scholar]
- Saunders JB, Aasland OG, Babor TF, DeLaFuente JR, Grant M. Development of the alcohol use disorders identification test (AUDIT): WHO collaborative project on early detection of persons with harmful alcohol consumption-II. Addiction. 1993;88:791–804. doi: 10.1111/j.1360-0443.1993.tb02093.x. [DOI] [PubMed] [Google Scholar]
- Viel G, Boscolo-Berto R, Cecchetto G, Fais P, Nalesso A, Ferrara SD. Phosphatidylethanol in blood as a marker of chronic alcohol use: a systematic review and meta-analysis. International journal of molecular sciences. 2012;13:14788–14812. doi: 10.3390/ijms131114788. [DOI] [PMC free article] [PubMed] [Google Scholar]
- Wurst FM, Thon N, Yegles M, Schruck A, Preuss UW, Weinmann W. Ethanol Metabolites: Their Role in the Assessment of Alcohol Intake. Alcohol Clin Exp Res. 2015;39:2060–2072. doi: 10.1111/acer.12851. [DOI] [PubMed] [Google Scholar]


