

Abstract
Objective
We used quantitative genetic methods to evaluate whether sleep quality, pain, and depression symptoms share a common genetic diathesis, to estimate the genetic and environmental sources of covariance among these symptoms, and to test for possible causal relationships.
Methods
A community sample of 400 twins from the University of Washington Twin Registry completed standardized self-report questionnaires. We used biometric modeling to assess genetic and environmental contribution to the association between sleep quality measured by the Pittsburgh Sleep Quality Index (PSQI), pain measured by the Brief Pain Inventory (BPI), and depression symptoms measured by the Brief Symptom Inventory (BSI-dep). Trivariate Cholesky structural equation models were used to decompose correlations among the phenotypes.
Results
Heritability was estimated at 37% (95% CI: 20, 51%) for sleep quality, 25% (9, 41%) for pain, and 39% (22, 53%) for depression. Non-shared environmental influences accounted for the remaining variance. The genetic correlation between sleep quality and pain was rg = 0.69 (95%CI: 0.33, 0.97), rg = 0.56 (0.55, 0.98) between pain and depression, and rg = 0.61 (0.44, 0.88) between depression and sleep quality. Non-shared environmental overlap was present between pain and sleep quality and depression and sleep quality.
Conclusions
The link between sleep quality, pain, and depression was primarily explained by shared genetic influences. The genetic factors influencing sleep quality and pain were highly correlated even when accounting for depression. Findings support the hypothesis of a genetic link between sleep quality and pain and potential causality for the association of sleep quality with pain and depression.
Keywords: sleep, pain, depression, genetics, twins
Introduction
A good night’s sleep is an elusive goal for many. A third of the adult population reports at least occasional problems with sleep quality and as many as two-thirds of primary care patients cite it as a presenting concern (1, 2). Sleep quality represents a complex phenomenon which includes quantitative aspects such as duration and number of arousals, as well as subjective aspects such as “depth” and “restfulness” of sleep (3). Poor sleep quality has significant daytime consequences including fatigue, cognitive impairment, mood disturbances (4) and carries with it a significant economic burden (5). Extensive co-occurrence between sleep quality and other physical and mental health conditions is frequently reported in both epidemiological and clinical samples (1, 6–9) with two of the most significant comorbid conditions being chronic pain and depression.
Chronic pain is one of the most common comorbidities of sleep problems (10) and these two domains have been shown to interact such that changes in sleep quality predict changes in pain; and to a lesser degree, changes in pain predict changes in sleep (11). Unlike acute pain, which is a response to potential or actual tissue damage, chronic pain is characterized by altered function of the central nervous system in which tissue injury is not required for pain perception (12, 13). Over 40% of individuals with sleep problems report chronic pain, and more than 50% of individuals with chronic pain report difficulty sleeping (14). Recent studies also have implicated depression as a prominent comorbidity of both chronic pain (15) and sleep problems (16). Indeed, a diagnosis of Major Depressive Disorder (MDD) requires the presence of either depressed mood or anhedonia, and at least four other symptoms that may include sleep disturbance. Approximately 20% of people with sleep disturbance report clinically significant depression (17), and pain symptoms occur in approximately 65% of people with depression (18).
Although these three conditions – poor sleep quality, chronic pain, and depression – frequently co-occur, only a handful of studies have examined them together (19–21). Those who have, demonstrate positive associations among all three conditions and generally worse outcomes and higher impairment with each additional problem. Individuals with chronic pain and depression, for example, have a higher prevalence of insomnia than chronic pain patients alone (19). Mediation among the three conditions has also been documented, with depressed mood mediating the relationship between sleep and pain (20), and sleep problems mediating the relationship between pain and symptoms of depression (21). When sleep problems are present in the context of another physical or mental health condition, treatment outcomes are improved when both sleep and the comorbid condition are addressed rather than the comorbid condition alone (22, 23). Taken together, these results indicate an interaction among chronic pain, poor sleep quality, and depression with each increasing risk of negative outcomes.
The causal order of these relationships remains vague and is difficult to elucidate. Findings from cross-sectional and prospective studies show complicated interactions among these three problems (20, 21), but the underlying mechanism of their associations cannot be discerned by these study designs. Clearly, a complicated interplay exists in which the presence of one of the three conditions results in increased risk for the others, and increased impairment with each additional condition. This observation has generated theories of different neurobiological and psychosocial paths to explain these relationships (24–26) but no clear mechanism has yet been demonstrated.
Twin studies provide a unique method to test the importance of neurobiological and psychosocial paths through their ability to quantify the relative influence of common genetic and environmental factors. Twin studies are also able to elucidate the degree to which a phenotypic association is due to shared genetic or environmental factors. Understanding the extent to which various etiological factors contribute to the co-occurrence among conditions has several important implications. If the same genes are found to contribute, a phenomenon known as genetic pleiotropy, their co-occurrence may lend support for a common biological predisposition or pathway and would have significant implications for studies attempting to identify specific genes involved in these conditions. If, on the other hand, the association among sleep, pain, and depression is due primarily to environmental reasons, prevention and intervention efforts would have to focus on appropriate strategies. These two scenarios represent two theoretical extremes with a more likely scenario involving both genetic and environmental influences. Multivariate twin analysis also allows for a non-experimental test of causal hypotheses against the hypothesis of pleiotropic genetic effects. For example, if pain causally influences variation in sleep quality, then both genetic and environmental factors influencing pain will also influence sleep quality. This hypothesis can be tested by evaluating the genetic and environmental correlations between two observed phenotypes (27). The presence of significant genetic and environmental correlations between two variables would be consistent with a potentially causal relationship while the presence of only significant genetic correlations would be more consistent with a pleiotropic explanation for the association.
Previous twin research has demonstrated moderate levels of heritability in all three conditions, suggesting that genetic factors play a significant role in the development of these problems independently. Sleep problems have been shown to be moderately heritable across the lifespan with genetic factors accounting for approximately 14–38% of the variance (28). Depending on the condition (i.e., back pain, fibromyalgia), estimates of heritability for chronic pain have ranged from 25–68% (29), and the heritability of depression has been estimated at 31%–42% (30). Furthermore, recent work has suggested genetic contribution to the relationship between chronic pain and sleep quality (31) but was not able to evaluate the extent of this relationship. Overlap in the genetic factors contributing to sleep quality and depression has also been demonstrated (32) suggesting a shared etiology between these two phenotypes.
Despite the knowledge that all three conditions are genetically influenced, the literature provides no information on the extent to which genetic influences are common or unique to these three phenotypes, as the extent of the genetic overlap among them has not been fully evaluated in a single study. Whether these three conditions are influenced by the same genetic and environmental factors is an important question. The aim of the current study was to use biometric modeling methods with data from a genetically informative sample of healthy community twins to evaluate potential genetic and environmental sources of comorbidity and possible causality in these common set of health symptoms. On the basis of previous behavioral genetic studies, we expected that a moderate portion of the variance in each phenotype would be genetically influenced. Furthermore, we hypothesized that the covariation between sleep quality, pain, and depression was in part the result of common genetic factors associated with the etiology of these phenotypes, and that a substantial portion of this covariation would likely stem from a common set of genes. We made no predictions regarding the causal relationship among these phenotypes.
Methods
Participants
Same-sex twin pairs from the University of Washington Twin Registry (UWTR) were recruited specifically for a study to examine the psychosocial, demographic, and clinical factors associated with experimental pain sensitivity. The UWTR is a community-based sample of twins drawn from information gathered by the Washington State Department of Licensing. A detailed description of Registry participant recruitment procedures are described elsewhere (33, 34). Briefly, same-sex twin pairs who were 18 to 65 years old were eligible for this study and potential participants were randomly selected from the UWTR. Between August 2010 and March 2012, a total of 767 individuals were screened for participation in the study. Of these, 78 individuals did not meet the inclusion criteria, pain or immune-modulating medications (n = 38), BMI of < 18.5 kg/m2 (n = 14), current or anticipated pregnancy (n = 6), neuropathy (n = 18), and ongoing cancer treatment (n = 2); and 121 were not interested in further participation or had a twin who was excluded. This resulted in 568 eligible individuals (284 eligible twin pairs) of which 84 pairs were unable to participate because of scheduling issues. The final sample consisted of 400 healthy members of the UWTR (200 pairs) with 102 monozygotic (MZ) and 98 dizygotic (DZ) same-sex twin pairs. The participants (63% female) were predominantly young to middle-aged adults (M = 29 years, S.D. = 12 years, range = 19–65 years), with the majority being white (80%).
Zygosity was determined using either the AmpFlSTR Identifiler Plus PCR Amplification Kit or the PowerPlex 16 HS System. The two protocols are nearly identical, and all assays were conducted per manufacturer’s instructions at the University of Washington Center for Clinical Genomics. Informed consent was obtained from participants, and study procedures and protocols were approved by the Institutional Review Board at the University of Washington.
Measures
Sleep quality was assessed using The Pittsburgh Sleep Quality Index (PSQI)(3), a 19-item self-report questionnaire evaluating subjective sleep quality over a one-month interval. The individual items were combined into seven component scores with scores ranging from zero to three, and into a global score ranging from zero to 21, with higher scores indicating worse sleep quality. Psychometric and clinical properties of the PSQI have been evaluated by a number of research groups establishing high internal consistency, reliability, and construct validity (35).
Pain was assessed using The Brief Pain Inventory (BPI)(36), an 11-item self-report questionnaire assessing pain severity and pain interference over the course of the past week. Though originally designed by the Pain Research Group of the World Health Organization for use in cancer populations, the BPI has been widely validated for use in other groups (37, 38). A pain severity score was computed as the average of the pain reported as the “worst,” “least,” “average” over the past week, and “now” on a 0-to-10 rating scale with zero meaning “no pain” and 10 meaning “pains as bad as you can imagine.” A pain interference score was computed as the average of seven ratings (ranging from zero, meaning “does not interfere”, to 10, meaning “interferes completely”) assessing the impact of pain on seven quality of life domains such as general activity, mood, and walking. Pain interference and severity scales were highly correlated with each other (r = 0.72, p < 0.001) and were combined in a single measure of pain disturbance composite (possible range of 0–20). BPI severity and interference subscale scores were highly correlated (r = 0.93, p < 0.001; r = 0.91, p < 0.001, respectively) with the composite pain disturbance score which was used in subsequent analyses.
Depression symptoms were ascertained from the depression subscale of the Brief Symptoms Inventory – 53 (BSI)(39), a 53-item, self-report of overall psychological distress over the past week. Participants were asked to rank the presence of each of the seven depression subscale symptoms on a five-point scale ranging from 0 (“not at all”) to 4 (“extremely”) with a possible range of 0–28 points. The psychometric properties of the BSI-53, and its subscales, are well established for use with a variety of populations (39, 40).
Statistical Analyses
Standard biometric modeling was used to determine the heritability of each phenotype which is defined as the proportion of a phenotype’s total variance attributable to additive genetic effects. The classic twin model (Figure 1) is used to estimate variance components based on the similarities of MZ twins (who are genetically identical) and DZ twin (who share, on average, 50% of their segregating genes). Phenotypic variance can be decomposed into genetic and environmental sources of variance (41). Additive genetic component (A) refers to the additive effect of individual genes summed over loci and are inferred when the MZ correlation is greater than the DZ correlation for a particular trait. Non-additive genetic effects (D) result from the interaction between alleles at the same locus, or from interactions of genes at difference loci and are inferred when the MZ correlation is more than twice the DZ correlation. Shared environmental (C) effects reflect environmental influences that contribute to twin similarity and are inferred when the DZ correlation exceeds half the MZ correlation. Non-shared environmental (E) variance components are due to environmental influences that contribute to twin differences (including measurement error) are inferred when the MZ correlation is less than 1. The univariate Cholesky decomposition provides estimates of genetic and environmental influences, allowing for but not imposing any significant overlap among traits.
Figure 1.

Path diagram of the classic twin design. The twin model decomposes phenotypic variance into genetic and environmental components in monozygotic (MZ) and dizygotic (DZ) twins. P1 represents the phenotype for the first twin and P2 the phenotype for the second twin. Circles represent latent factors hypothesized to account for individual differences: A= additive genetic influences, C= common, or shared, environmental influences, E = non-shared, or unique, environmental influences. Curved, double-headed arrows represent the correlation between twins.
We used a series of trivariate Cholesky decompositions (Figure 2) to delineate the extent to which the genetic and environmental influences are common or specific to each phenotype. These comparisons are used to evaluate the relative importance of genetic and environmental influences on phenotypic covariance and estimate the overlap in genetic and environmental factors underlying the co-occurrence of these three traits. Separate genetic and environmental influences were estimated freely. Furthermore, in multivariate models, the parameterization separates effects common across phenotypes with those effects specific to each. Primary factors (A1 and E1) represent the genetic and environmental influences common to all three phenotypes. Paths leading from the second factors (a22, e22) represent influences that are independent of the first phenotype. The third set of factors captures the influences specific to the third phenotype, and which are unexplained by the preceding factors. Diagonal paths (e.g., a21, a31, a32) represent the genetic or environmental covariance between traits.
Figure 2.
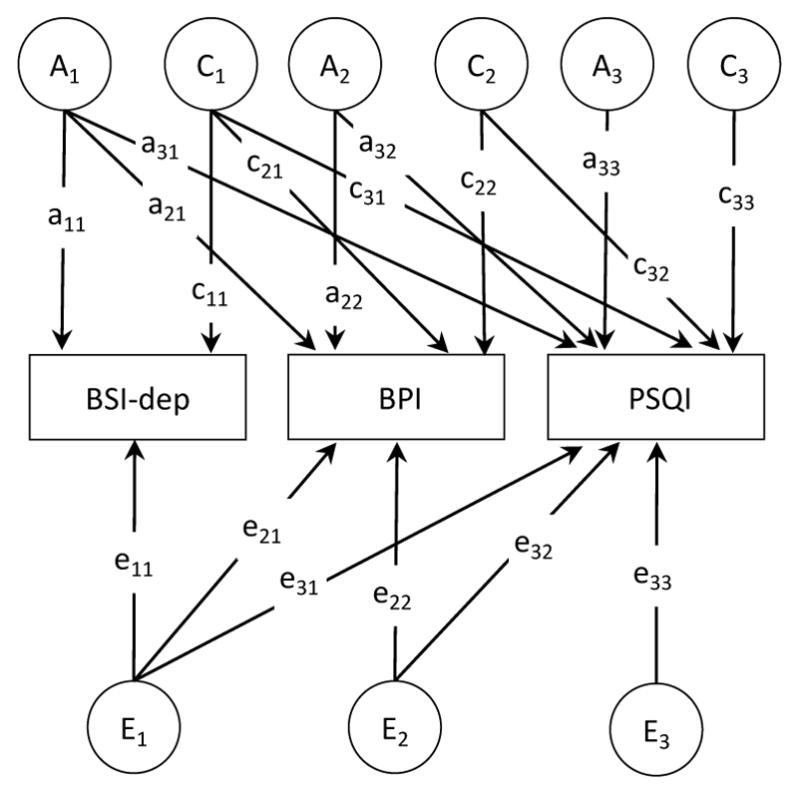
Full Trivariate Cholesky model of additive genetic (A), shared environments (C), and non-shared environmental (E) contributions to depression, pain, and sleep quality. Pain = Brief Pain Inventory; Sleep = Pittsburgh Sleep Quality Index; Depression = Brief Symptom Inventory-53, Depression scale. For simplicity, only one twin of a pair is shown.
The magnitude of genetic overlap among variables, and whether they are likely to share the same genes, can be expressed in terms of a genetic correlation (rg), which is derived by standardizing the genetic covariance on the genetic variance of the two phenotypes. A genetic correlation of 1.0 suggests that the two variables share all of their genetic effects and a genetic correlation of 0 indicates genetic independence. A high genetic correlation suggests that if a gene were identified for one trait, there is a reasonable chance that this gene would also influence the other trait. Non-shared environmental correlations (re) can be estimated using similar analytic procedures. The extent to which genetic, shared, and non-shared environmental influences contribute to the phenotypic correlation between two variables was also estimated. This approach can yield additional information in cases when observed and genetic correlations are low, but the observed association may be strongly genetically influenced. To evaluate possible causal effects of depression, pain, and sleep quality, we assessed whether the genetic and environmental correlations were significantly different from zero as detailed by Moor and colleagues (27). The presence of significant genetic and environmental correlations (at α-level 0.05) would be consistent with the hypothesis of a possible causal relationship between phenotypes, though this finding would not constitute sufficient proof of causality. If one of the genetic or environmental correlations is non-significant, however, then a causal relationship is not likely to be the source of the association, and the results would be more consistent with genetic pleiotropy.
Models were fit to the raw data using full information maximum-likelihood in OpenMx software version 2.3.1 (42, 43) in the software R (44). This approach allows the use of all available information from all cases regardless of missing data and yields less-biased estimates when compared to listwise or pairwise deletion methods (45). Model fit was evaluated by comparing −2 times the natural log likelihood (−2lnL) and Akaike’s Information Criterion (AIC) between nested models. Lower AIC values represent a better balance between goodness of fit and parsimony. The goal is to identify the most parsimonious model that sufficiently describes the data, and models with fewer parameters are preferred if they do not result in a significant deterioration of fit. Parameter significance was tested using the (χ2) difference test, which compares the goodness-of-fit of the reduced model to a fuller model. Variables were age and sex-regressed following standard analytic procedures (46), and log-transformed to better approximate normality.
Results
Characteristics of the Study Population
The average symptom scores were 5.18 points (SD = 2.97, range = 0–16) for PSQI, 2.32 points (SD = 2.47, range = 0–12.6) for BPI composite, and 3.04 points (SD = 0.66, range = 0–20) for BSI-dep. Strong phenotypic correlations were observed between sleep quality and pain scores (r = 0.35, p < 0.001), and sleep quality and depression (r = 0.40, p < 0.001); the phenotypic correlation between pain and depression symptoms (r = 0.29, p < 0.001) was modest but significant.
Univariate Model Fitting
Table 1 presents results of the univariate twin analyses that considered each of the phenotypes separately. Goodness-of-fit values indicate a better fit to the data when AIC values are more negative. For each condition, goodness-of-fit was evaluated for standard ACE, ADE, and AE models. The AE model was the most parsimonious model for sleep quality, pain, and depression indicating no shared environmental influence on any of the variables. Sleep quality (36%) and depression symptoms (40%) were moderately heritable, with the rest of the variance attributable to non-shared environmental influences. Pain, as measured by the BPI, was modestly heritable (23%) with the majority of the variance (77%) attributable no non-shared environmental effects.
Table 1.
Standardized Estimates from Univariate Models.
| Model | Standardized Estimates (95% CI) | Goodness-of-Fit | |||
|---|---|---|---|---|---|
|
| |||||
| a2 | d2 | c2 | e2 | AIC | |
| Sleep Quality | |||||
| ACE | 0.36 (0.00, 0.51) | - | 0.00 (0.00, 0.31) | 0.64 (0.49, 0.81) | 320.08 |
| ADE | 0.21 (0.00, 0.51) | 0.16 (0.00, 0.53) | - | 0.62 (0.47,0.80) | 319.91 |
| AE | 0.36 (0.19, 0.51) | - | - | 0.64 (0.49, 0.81) | 318.08 |
| CE | - | - | 0.25 (0.12, 0.37) | 0.75 (0.63, 0.88) | 321.21 |
| E | - | - | - | 1.00 | 332.09 |
| Pain | |||||
| ACE | 0.23 (0.00, 0.39) | - | 0.00 (0.00, 0.26) | 0.77 (0.61, 0.94) | 8.24 |
| ADE | 0.00 (0.00, 0.38) | 0.25 (0.00, 0.41) | 0.75 (0.59, 0.93) | 7.90 | |
| AE | 0.23 (0.06, 0.39) | - | - | 0.77 (0.61, 0.94) | 6.24 |
| CE | - | - | 0.16 (0.02, 0.29) | 0.84 (0.71, 0.98) | 7.82 |
| E | - | - | - | 1.00 | 11.00 |
| Depression | |||||
| ACE | 0.27 (0.00, 0.54) | - | 0.11 (0.00, 0.40) | 0.62 (0.46, 0.82) | −487.58 |
| ADE | 0.40 (0.00, 0.54) | 0.00 (0.00, 0.50) | - | 0.60 (0.46, 0.77) | −487.25 |
| AE | 0.40 (0.23, 0.54) | - | - | 0.60 (0.46, 0.77) | −489.25 |
| CE | - | - | 0.30 (0.16, 0.41) | 0.70 (0.58, 0.84) | −488.47 |
| E | - | - | - | 1.00 | −472.47 |
Note: a2: additive genetic; d2: dominant genetic; c2: shared environment; e2: non-shared environment; AIC: Akaike information criterion.; CI: confidence interval; Sleep Quality = Pittsburg Sleep Quality Index; Pain = Brief Pain Inventory; Depression = Brief Symptom Inventory-53, Depression scale. Best fitting models in bold. AIC comparisons are made within each condition.
Multivariate Model Fitting
Fit comparisons for the trivariate Cholesky decompositions are presented in Table 2. The first model estimated all ACE components of variance and covariance. We then compared the fit of this model to more restrictive (AE and CE) models, with more negative AIC values indicating better fit to the data. Because the univariate results indicated no shared environmental effects for sleep quality or pain, and only non-significant effects for depression, we evaluated a model (Model 2) with the C component present only for depression. This model showed improved fit when compared to the full ACE model. The AE model contained no shared environmental effects for any variable and was the most parsimonious model that showed the lowest AIC values and improved fit (ΔAIC = −11.56). The path estimates from this model are shown in Figure 3. Consistent with univariate results, this model indicated that shared environmental effects did not contribute significantly to sleep quality, pain, or depression (or their covariance) in this sample; additionally, dropping all genetic effects for all phenotypes in the CE model resulted in a decrease in fit, as did the model containing only the E component. Heritability estimates from the multivariate variance decomposition, which are considered to be more accurate, were consistent with the univariate models. Multivariate models produced heritability estimates of 0.37 (95% CI: 0.20, 0.51) for sleep quality, 0.39 (95% CI: 0.22, 0.53) for depression, and 0.25 (95% CI; 0.09, 0.41) for pain, with the remaining phenotypic variance attributed to non-shared environmental factors.
Table 2.
Fitting of Trivariate Cholesky Structural Equation Models
| Model | −2lnL | df | AIC | Δ-2lnL | Δdf | p | |
|---|---|---|---|---|---|---|---|
| 1 | ACE | 2069.93 | 1169 | −268.07 | |||
| 2 | AE with C for Depression | 2069.99 | 1174 | −278.02 | 0.06 | 5 | > 0.99 |
| 3 | AE | 2070.37 | 1175 | −279.63 | 0.44 | 6 | > 0.99 |
| 4 | CE | 2075.19 | 1175 | −274.81 | 5.26 | 6 | 0.511 |
| 5 | E | 2104.65 | 1181 | −257.35 | 34.72 | 12 | < 0.001 |
Note: ep = estimated parameters; lnL = log-likelihood; df = degrees of freedom; AIC = Akaike information criterion; Depression = Brief Symptom Inventory-53, Depression scale. Δχ2 and Δdf are relative to the base model. The best fitting model is shown in bold.
Figure 3.

Parameters for the best-fitting AE model for the trivariate Cholesky decomposition for depression, pain, and sleep quality. A = additive genetic effects; E = non-shared environmental effects. For simplicity, only one twin of a pair is shown. Pain = Brief Pain Inventory; Sleep = Pittsburgh Sleep Quality Index; Depression = Brief Symptom Inventory-53, Depression scale.
Genetic Correlations
Table 3 provides the additive genetic and nonshared environmental correlations among sleep quality, pain, and depression from the best-fitting AE model. These correlations estimate the degree to which the same genetic (or environmental) factors influence two variables and are more informative than phenotypic correlations by isolating the source of the association. In other words, genetic correlations estimate overlap in genetic signal rather than all sources of variance and covariance. The genetic correlation between sleep quality and pain scores was rg = 0.69 (95% CI: 0.33, 0.97) indicating that the genetic factors associated with pain accounted for 48% of the genetic risk associated with sleep quality (this statistic was obtained by squaring the genetic correlation: 0.69 × 0.69 = 0.48 × 100% = 48%). The genetic correlation between sleep quality and depression symptoms was rg = 0.61 (95% CI: 0.44, 0.88), and rg = 0.56 (95% CI: 0.55, 0.98) between pain and depression. These significant genetic correlations indicated a substantial degree of overlap among the genes contributing to the variance within these traits, with the strongest overlap between sleep quality and pain. The corresponding environmental correlations (re) were relatively small suggesting little overlap in environmental effects that influence these phenotypes. Overall, approximately 60% of the phenotypic correlations between these phenotypes was attributable to genetic effects, with the remainder attributable to non-shared environmental effects. As a test of possible causality, models with constrains for each genetic and environmental path were compared to the best fitting (AE) model. None of the genetic correlations could be removed without a deterioration in model fit (p <.01 for all). With the exception of the pain-depression correlation (p = 0.049), dropping the non-shared environmental correlations also resulted in in significant deterioration of model fit.
Table 3.
Phenotypic, Additive Genetic Correlations (rg), and non-shared environmental correlations (re) between the different phenotypes, from the best-fitting trivarate model.
| Proportion of Phenotypic Correlation
|
|||||
|---|---|---|---|---|---|
| Phenotypes | Phenotypic Correlation (95% CI) | Genetic Effects (Actual Value [Relative Value]) | Environmental Effects (Actual Value [Relative Value]) | rg (95% CI) | re (95% CI) |
| Sleep Quality and Pain | 0.36 (0.27, 0.44) | 0.21 (59%) | 0.15 (41%) | 0.69 (0.33, 0.97) | 0.21 (0.05, 0.37) |
| Sleep Quality and Depression | 0.41 (0.32, 0.49) | 0.23 (56%) | 0.18 (44%) | 0.61 (0.44, 0.88) | 0.29 (0.12, 0.44) |
| Pain and Depression | 0.29 (0.20, 0.39) | 0.17 (59%) | 0.12 (41%) | 0.56 (0.55, 0.98) | 0.18 a (0.00, 0.34) |
Note: CI = Confidence Interval; rg = genetic correlation; re = non-shared environmental correlation; Pain = Brief Pain Inventory; Sleep Quality = Pittsburg Sleep Quality Index; Depression = Brief Symptom Inventory-53, Depression scale;
= can be removed without significant deterioration in model fit.
Discussion
Poor sleep quality, pain, and depression are common and significant problems that frequently co-occur. To our knowledge, this is the first twin study to examine the relative importance of genetic and environmental influences on phenotypic covariance among sleep quality, pain, and depression symptoms. Heritability estimates for sleep quality, pain, and depression were consistent with previous research (28–30). Consistent with our hypotheses, we also found that the majority of the covariation among sleep quality, pain, and depression symptoms was attributed to genetic factors, with non-shared environmental factors making a smaller but significant contribution to these relationships. The pattern of genetic and non-shared environmental correlations was compatible with a potential causal association between sleep quality and pain, and sleep and depression, but not between pain and depression which was more consistent with genetic pleiotropy.
Our results show a strong overlap in the genes influencing these three conditions, represented by the genetic correlations. This finding suggests that shared genetic influences contribute significantly to the covariation among these conditions, and lends support to theories of possible common causal or biological influences. These results are consistent with previous findings. Gregory et al. (32), for example, reported a similar genetic correlation between sleep quality and depression (rg = 0.69). Though our data suggest that genetic influences largely contribute to their overlap, each phenotype also had unique genetic influences.
The sizable genetic correlations among these phenotypes suggest that the same set of genetic factors may contribute to expression of three distinct but related set of symptoms. Some have proposed that problems in sleep quality, pain, and depression pathology are the result of dysfunction in the mesolimbic dopamine (DA) system (24) which includes projections from the ventral tegmental area to the nucleus accumbens. The authors hypothesize that abnormalities in DA function may trigger the dysfunction in these conditions that can further promote further DA dysregulation resulting in a bidirectional process. More research is needed to understand the underlying brain connectivity, DA activity and function across various receptors, DA regulation, and possible environmental factors such as early trauma and stress (24). Genetic studies of candidate genes implicated in DA function, such as the variable number tandem repeat polymorphism on the D4 receptor gene or a single nucleotide polymorphism on the catechol-O-methyltransferase gene may be useful (24). Others have proposed that the association between sleep quality and pain is due to the activation of inflammatory processes (26), a physiological response that has also been shown to trigger symptoms of depression (47). Elevation in C-reactive protein, increased plasma levels of interleukin-6, and other cytokines have been implicated in sleep, pain, and depression but the genetic nature of this association remains unclear (48). It should be noted that causal effects can also induce genetic overlap. For example, if higher pain sensitivity causes low sleep quality, any genetic factors affecting pain will also affect sleep. Reverse causation is also possible, with genetic factors contributing to poor sleep quality also appearing to influence pain in the context of a causal relationship. Further research into how these processes relate to the phenotypes in the context of genetic and environmental influences is warranted.
The present findings also suggest that the non-shared environmental factors show far less overlap, possibly because environmental influences contributing to these phenotypes and their covariation are not the same. One logical interpretation is that a wide variety of environmental experiences may contribute to the development of sleep dysfunction, pain, and depression, and that the diversity of these experiences reduces twin similarity. In keeping with this interpretation, our findings also do not speak to potential gene-environment interaction or gene-environment correlation. Genetic factors could, however, influence what are frequently considered behavioral domains such as physical activity, sleep hygiene, and vocational and residence choices which could in turn affect the prevalence and course of sleep problems, pain and depression — a sequence of events that would fit with our findings of substantial genetic influence on the phenotypes. Further investigation into the gene-environment interplay related to these phenotypes is important.
We found significant genetic and environmental correlations between sleep quality and pain, and sleep quality and depression, which is suggestive of potentially causal relationships among these phenotypes rather than a pleiotropic explanation. It is important to note, however, that these results do not constitute proof of causality, but rather do not exclude it or pleiotropy as a possible explanation. The direction of these relationships cannot be evaluated in the current cross-sectional study and longitudinal data are needed to reveal the direction of causality. On the other hand, the non-significant environmental correlation between depression and pain, suggests genetic pleiotropy in the absence of causality. The hypothesis that pain could be viewed as a symptom of depression has been proposed by previous research (18, 49) and is further supported by our results. In line with this view, the comorbidity of pain and depression may not be due to a causal relationship but to a common underlying pathology such as an inflammatory or mesolimbic DA process.
Our findings lend support to clinical efforts that address sleep quality, pain and depression symptoms together rather than in isolation. Research has shown that the treatment of one of these conditions can reduce the symptoms in another. Addressing sleep quality can be helpful in the treatment and prevention of chronic pain; increased sleep time and reduced sleepiness as a result of extended bedtime, for example, has also reduced pain sensitivity (50). Cognitive behavioral therapy has been shown effective in the treatment of all three conditions separately, but the crossover benefits of these treatments or the efficacy of combined intervention, remain uninvestigated. Further research into measuring all three outcomes in longitudinal studies focused on any of these problem areas is recommended to answer some of these questions.
The current study extended prior research on the association of sleep quality, pain, and depression symptoms by evaluating the contribution of genetic and environmental factors and possible causality to their co-occurrence using a community sample of twins. The strengths of this study lie in the use of twin data to address questions about the common etiology of sleep quality, pain, and depression. The use of community twins, as opposed to a clinical sample, provides valuable information about the variability of these conditions in non-clinical populations. Despite these substantial strengths, the study also is subject to some limitations. First, data were self-reported and from a relatively small sample of twins; future replication of findings in larger samples with the addition of objective measures of sleep quality and pain is important. Second, though we controlled for the effects of sex, we were unable to compare results across sex, which could yield potentially interesting insights into the role of sex in the link between these phenotypes. Third, the use of a relatively healthy set of twins potentially limits our data interpretation to non-clinical samples. Future research can further examine these objectives using a sample with more severe clinical pathology. Fourth, because our data were contemporaneous rather than prospective, we were unable to draw firm conclusions about the causal nature of the associations. While our findings do not rule out the possibility of causality between sleep quality and pain, and sleep quality and depression, they are not able to provide definitive proof of these effects. Evaluation of these relationships across the lifespan and greater severity of symptoms could provide a clearer understanding of their interplay. Nonetheless, this work makes an important contribution to understanding of the potential mechanisms underlying the link between sleep quality, pain, and depression symptoms.
In conclusion, much of the co-occurrence of these three phenotypes is due to common genetic and environmental factors. Based on the pattern of these results, we conclude that a mechanism based solely on pleiotropy is unlikely to explain the association between sleep quality and pain, and sleep quality and depression while the relationship between depression and pain does appear pleiotropic. The modest heritability of sleep quality, pain, and depression symptoms in generally healthy adults and the overlap of genetic and environmental factors between these three phenotypes highlight the need for further longitudinal biometric and molecular genetic research into these associations. Future investigations can further examine the common biological mechanisms responsible for these frequently co-morbid conditions, and direction and mechanisms of causality. Additional studies should also explore the potential change in the influence of genes over the life course as well as the interplay of genetic and environmental factors that may serve as factors protective against the development of sleep quality, pain, and depression.
Acknowledgments
Source of Funding.
This research was supported by National Institutes of Health award RC2HL103416. We wish to thank the twins for taking part in the University of Washington Twin Registry and for their time and enthusiasm for this project
Acronyms used in text
- AIC
Akaike information criterion
- BPI
Brief Pain Inventory
- BSI-dep
Brief Symptom Inventory-53
- CI
Confidence Interval
- DZ
dizygotic
- MDD
Major Depressive Disorder
- MZ
monozygotic
- PSQI
Pittsburgh Sleep Quality Index
- UWTR
University of Washington Twin Registry
Footnotes
Conflicts of Interest.
No conflicts of interest to disclose.
References
- 1.Taylor DJ, Mallory LJ, Lichstein KL, Durrence H, Riedel BW, Bush AJ. Comorbidity of chronic insomnia with medical problems. Sleep. 2007;30:213–8. doi: 10.1093/sleep/30.2.213. [DOI] [PubMed] [Google Scholar]
- 2.Ancoli-Israel S, Roth T. Characteristics of insomnia in the United States: results of the 1991 National Sleep Foundation Survey. I. Sleep. 1999;22(Suppl 2):S347–53. [PubMed] [Google Scholar]
- 3.Buysse DJ, Reynolds CF, Monk TH, Berman SR, Kupfer DJ. The Pittsburgh Sleep Quality Index: a new instrument for psychiatric practice and research. Psychiatry Research. 1989;28:193–213. doi: 10.1016/0165-1781(89)90047-4. [DOI] [PubMed] [Google Scholar]
- 4.Buysse DJ, Thompson W, Scott J, Franzen PL, Germain A, Hall M, Moul DE, Nofzinger EA, Kupfer DJ. Daytime symptoms in primary insomnia: a prospective analysis using ecological momentary assessment. Sleep Medicine. 2007;8:198–208. doi: 10.1016/j.sleep.2006.10.006. [DOI] [PMC free article] [PubMed] [Google Scholar]
- 5.Daley M, Morin CM, LeBlanc M, Gregoire J-P, Savard J. The economic burden of insomnia: direct and indirect costs for individuals with insomnia syndrome, insomnia symptoms, and good sleepers. Sleep. 2009;32:55–64. [PMC free article] [PubMed] [Google Scholar]
- 6.Buysse DJ, Angst J, Gamma A, Ajdacic V, Eich D, Rossler W. Prevalence, course, and comorbidity of insomnia and depression in young adults. Sleep. 2008;31:473–80. doi: 10.1093/sleep/31.4.473. [DOI] [PMC free article] [PubMed] [Google Scholar]
- 7.McBeth J, Wilkie R, Bedson J, Chew-Graham C, Lacey RJ. Sleep disturbance and chronic widespread pain. Current Rheumatology Reports. 2015;17:1–10. doi: 10.1007/s11926-014-0469-9. [DOI] [PubMed] [Google Scholar]
- 8.Schur EA, Afari N, Furberg H, Olarte M, Goldberg J, Sullivan PF, Buchwald D. Feeling bad in more ways than one: comorbidity patterns of medically unexplained and psychiatric conditions. Journal of General Internal Medicine. 2007;22:818–21. doi: 10.1007/s11606-007-0140-5. [DOI] [PMC free article] [PubMed] [Google Scholar]
- 9.Afari N, Buchwald D. Chronic fatigue syndrome: A review. The American Journal of Psychiatry. 2003;160:221–36. doi: 10.1176/appi.ajp.160.2.221. [DOI] [PubMed] [Google Scholar]
- 10.Ohayon MM. Relationship between chronic painful physical condition and insomnia. Journal of Psychiatric Research. 2005;39:151–9. doi: 10.1016/j.jpsychires.2004.07.001. [DOI] [PubMed] [Google Scholar]
- 11.Koffel E, Kroenke K, Bair MJ, Leverty D, Polusny MA, Krebs EE. The bidirectional relationship between sleep complaints and pain: Analysis of data from a randomized trial. Health Psychology. 2016;35:41–9. doi: 10.1037/hea0000245. [DOI] [PMC free article] [PubMed] [Google Scholar]
- 12.Phillips K, Clauw DJ. Central pain mechanisms in chronic pain states–maybe it is all in their head. Best Practice & Research Clinical Rheumatology. 2011;25:141–54. doi: 10.1016/j.berh.2011.02.005. [DOI] [PMC free article] [PubMed] [Google Scholar]
- 13.Apkarian AV, Baliki MN, Geha PY. Towards a theory of chronic pain. Progress in Neurobiology. 2009;87:81–97. doi: 10.1016/j.pneurobio.2008.09.018. [DOI] [PMC free article] [PubMed] [Google Scholar]
- 14.Smith MT, Haythornthwaite JA. How do sleep disturbance and chronic pain inter-relate? Insights from the longitudinal and cognitive-behavioral clinical trials literature. Sleep Medicine Reviews. 2004;8:119–32. doi: 10.1016/S1087-0792(03)00044-3. [DOI] [PubMed] [Google Scholar]
- 15.Goesling J, Clauw DJ, Hassett AL. Pain and depression: an integrative review of neurobiological and psychological factors. Current Psychiatry Reports. 2013;15:1–8. doi: 10.1007/s11920-013-0421-0. [DOI] [PubMed] [Google Scholar]
- 16.Staner L. Comorbidity of insomnia and depression. Sleep Medicine Reviews. 2010;14:35–46. doi: 10.1016/j.smrv.2009.09.003. [DOI] [PubMed] [Google Scholar]
- 17.Taylor DJ, Lichstein KL, Durrence HH, Reidel BW, Bush AJ. Epidemiology of insomnia, depression, and anxiety. Sleep. 2005;28:1457–64. doi: 10.1093/sleep/28.11.1457. [DOI] [PubMed] [Google Scholar]
- 18.Bair MJ, Robinson RL, Katon W, Kroenke K. Depression and pain comorbidity: a literature review. Archives of Internal Medicine. 2003;163:2433–45. doi: 10.1001/archinte.163.20.2433. [DOI] [PubMed] [Google Scholar]
- 19.Wilson KG, Eriksson MY, Joyce L, Mikail SF, Emery PC. Major depression and insomnia in chronic pain. The Clinical Journal of Pain. 2002;18:77–83. doi: 10.1097/00002508-200203000-00002. [DOI] [PubMed] [Google Scholar]
- 20.O’Brien EM, Waxenberg LB, Atchison JW, Gremillion HA, Staud RM, McCrae CS, Robinson ME. Negative mood mediates the effect of poor sleep on pain among chronic pain patients. The Clinical Journal of Pain. 2010;26:310–9. doi: 10.1097/AJP.0b013e3181c328e9. [DOI] [PubMed] [Google Scholar]
- 21.Miró E, Martínez MP, Sánchez AI, Prados G, Medina A. When is pain related to emotional distress and daily functioning in fibromyalgia syndrome? The mediating roles of self-efficacy and sleep quality. British Journal of Health Psychology. 2011;16:799–814. doi: 10.1111/j.2044-8287.2011.02016.x. [DOI] [PubMed] [Google Scholar]
- 22.Fava M, McCall WV, Krystal A, Wessel T, Rubens R, Caron J, Amato D, Roth T. Eszopiclone co-administered with fluoxetine in patients with insomnia coexisting with major depressive disorder. Biological Psychiatry. 2006;59:1052–60. doi: 10.1016/j.biopsych.2006.01.016. [DOI] [PubMed] [Google Scholar]
- 23.Manber R, Edinger J, Gress J, San Pedro-Salcedo M, Kuo T, Kalista T. Cognitive behavioral therapy for insomnia enhances depression outcome in patients with comorbid major depressive disorder and insomnia. Sleep. 2008;31:489–95. doi: 10.1093/sleep/31.4.489. [DOI] [PMC free article] [PubMed] [Google Scholar]
- 24.Finan PH, Smith MT. The comorbidity of insomnia, chronic pain, and depression: dopamine as a putative mechanism. Sleep Medicine Reviews. 2013;17:173–83. doi: 10.1016/j.smrv.2012.03.003. [DOI] [PMC free article] [PubMed] [Google Scholar]
- 25.Yunus M. Fibromyalgia and overlapping disorders: the unifying concept of central sensitivity syndromes. Seminars in Arthritis and Rheumatism. 2007;36:339–56. doi: 10.1016/j.semarthrit.2006.12.009. [DOI] [PubMed] [Google Scholar]
- 26.Landis AC. Sleep and Pain: Milestones and Advances from Research. In: Chokroverty S, Billiard M, editors. Sleep Medicine: A Comprehensive Guide to Its Development, Clinical Milestones, and Advances in Treatment. New York, NY: Springer New York; 2015. pp. 433–42. [Google Scholar]
- 27.De Moor MH, Boomsma DI, Stubbe JH, Willemsen G, de Geus EJ. Testing causality in the association between regular exercise and symptoms of anxiety and depression. Archives of general psychiatry. 2008;65:897–905. doi: 10.1001/archpsyc.65.8.897. [DOI] [PubMed] [Google Scholar]
- 28.Barclay NL, Gehrman PR, Gregory AM, Eaves LJ, Silberg JL. The heritability of insomnia progression during childhood/adolescence: results from a longitudinal twin study. Sleep. 2015;38:109–18. doi: 10.5665/sleep.4334. [DOI] [PMC free article] [PubMed] [Google Scholar]
- 29.Wright LJ, Schur E, Noonan C, Ahumada S, Buchwald D, Afari N. Chronic pain, overweight, and obesity: findings from a community-based twin registry. The Journal of Pain. 2010;11:628–35. doi: 10.1016/j.jpain.2009.10.004. [DOI] [PMC free article] [PubMed] [Google Scholar]
- 30.Sullivan P, Neale M, Kendler K. Genetic epidemiology of major depression: review and meta-analysis. The American Journal of Psychiatry. 2000;157:1552–62. doi: 10.1176/appi.ajp.157.10.1552. [DOI] [PubMed] [Google Scholar]
- 31.Godfrey KM, Strachan E, Mostoufi S, Poeschla B, Succop A, Afari N. Familial Contributions to Self-Reported Sleep and Pain in Female Twins. Pain Medicine. 2016;17:33–9. doi: 10.1111/pme.12894. [DOI] [PMC free article] [PubMed] [Google Scholar]
- 32.Gregory AM, Buysse DJ, Willis TA, Rijsdijk FV, Maughan B, Rowe R, Cartwright S, Barclay NL, Eley TC. Associations between sleep quality and anxiety and depression symptoms in a sample of young adult twins and siblings. Journal of Psychosomatic Research. 2011;71:250–5. doi: 10.1016/j.jpsychores.2011.03.011. [DOI] [PubMed] [Google Scholar]
- 33.Afari N, Noonan C, Goldberg J, Edwards K, Gadepalli K, Osterman B, Evanoff C, Buchwald D. University of Washington Twin Registry: construction and characteristics of a community-based twin registry. Twin Research and Human Genetics. 2006;9:1023–9. doi: 10.1375/183242706779462543. [DOI] [PMC free article] [PubMed] [Google Scholar]
- 34.Strachan E, Hunt C, Afari N, Duncan G, Noonan C, Schur E, Watson N, Goldberg J, Buchwald D. University of Washington Twin Registry: Poised for the next generation of twin research. Twin Research and Human Genetics. 2013;16:455–62. doi: 10.1017/thg.2012.124. [DOI] [PMC free article] [PubMed] [Google Scholar]
- 35.Carpenter JS, Andrykowski MA. Psychometric evaluation of the Pittsburgh sleep quality index. Journal of psychosomatic research. 1998;45:5–13. doi: 10.1016/s0022-3999(97)00298-5. [DOI] [PubMed] [Google Scholar]
- 36.Cleeland C, Ryan K. Pain assessment: global use of the Brief Pain Inventory. Annals of the Academy of Medicine, Singapore. 1994;23:129–38. [PubMed] [Google Scholar]
- 37.Tan G, Jensen MP, Thornby JI, Shanti BF. Validation of the Brief Pain Inventory for chronic nonmalignant pain. The Journal of Pain. 2004;5:133–7. doi: 10.1016/j.jpain.2003.12.005. [DOI] [PubMed] [Google Scholar]
- 38.Keller S, Bann C, Dodd S, Schein J, Mendoza T, Cleeland C. Validity of the brief pain inventory for use in documenting the outcomes of patients with noncancer pain. The Clinical journal of pain. 2004;20:309. doi: 10.1097/00002508-200409000-00005. [DOI] [PubMed] [Google Scholar]
- 39.Derogatis LR, Melisaratos N. The brief symptom inventory: an introductory report. Psychological Medicine. 1983;13:595–605. [PubMed] [Google Scholar]
- 40.Derogatis LR, Rickels K, Rock AF. The SCL-90 and the MMPI: a step in the validation of a new self-report scale. The British Journal of Psychiatry. 1976;128:280–9. doi: 10.1192/bjp.128.3.280. [DOI] [PubMed] [Google Scholar]
- 41.Neale M, Cardon L. Methodology for genetic studies of twins and families. Springer Science & Business Media; 1992. [Google Scholar]
- 42.Neale MC, Hunter MD, Pritikin JN, Zahery M, Brick TR, Kirkpatrick RM, Estabrook R, Bates TC, Maes HH, Boker SM. OpenMx 2.0: Extended structural equation and statistical modeling. Psychometrika. 2015:1–15. doi: 10.1007/s11336-014-9435-8. [DOI] [PMC free article] [PubMed] [Google Scholar]
- 43.Boker S, Neale MC, Maes HH, Wilde MJ, Spiegel M, Brick TR, Estabrook R, Bates TC, Mehta P, von Oertzen T, Gore RJ, Hunter MD, Hackett DC, Karch J, Brandmaier A, Pritikin JN, Zahery M, Kirkpatrick RM. OpenMx 2.3.1 User Guide. 2016. [Google Scholar]
- 44.R Core Team. R: A language and environment for statistical computing. Vienna, Austria: R Foundation for Statistical Computing; 2016. [Google Scholar]
- 45.Allison PD. Missing data techniques for structural equation modeling. Journal of Abnormal Psychology. 2003;112:545–57. doi: 10.1037/0021-843X.112.4.545. [DOI] [PubMed] [Google Scholar]
- 46.McGue M, Bouchard T., Jr Adjustment of twin data for the effects of age and sex. Behavior Genetics. 1984;14:325–43. doi: 10.1007/BF01080045. [DOI] [PubMed] [Google Scholar]
- 47.Dowell NG, Cooper EA, Tibble J, Voon V, Critchley HD, Cercignani M, Harrison NA. Acute changes in striatal microstructure predict the development of interferon-alpha induced fatigue. Biological Psychiatry. 2016;79:320–8. doi: 10.1016/j.biopsych.2015.05.015. [DOI] [PMC free article] [PubMed] [Google Scholar]
- 48.Afari N, Mostoufi S, Noonan C, Poeschla B, Succop A, Chopko L, Strachan E. C-reactive protein and pain sensitivity: findings from female twins. Annals of Behavioral Medicine. 2011;42:277–83. doi: 10.1007/s12160-011-9297-6. [DOI] [PMC free article] [PubMed] [Google Scholar]
- 49.Lépine JP, Briley M. The epidemiology of pain in depression. Human Psychopharmacology: Clinical and Experimental. 2004;19:S3–S7. doi: 10.1002/hup.618. [DOI] [PubMed] [Google Scholar]
- 50.Roehrs TA, Harris E, Randall S, Roth T. Pain sensitivity and recovery from mild chronic sleep loss. Sleep. 2012;35:1667–72. doi: 10.5665/sleep.2240. [DOI] [PMC free article] [PubMed] [Google Scholar]