

Abstract
Formaldehyde (FA) is a reactive signaling molecule that is continuously produced through a number of central biological pathways spanning epigenetics to one-carbon metabolism. On the other hand, aberrant, elevated levels of FA are implicated in disease states ranging from asthma to neurodegenerative disorders. In this context, fluorescence-based probes for FA imaging are emerging as potentially powerful chemical tools to help disentangle the complexities of FA homeostasis and its physiological and pathological contributions. Currently available FA indicators require direct modification of the fluorophore backbone through complex synthetic considerations to enable FA detection, often limiting the generalization of designs to other fluorophore classes. To address this challenge, we now present the rational, iterative development of a general reaction-based trigger utilizing 2-aza-Cope reactivity for selective and sensitive detection of FA in living systems. Specifically, we developed a homoallylamine functionality that can undergo a subsequent self-immolative β-elimination, creating a FA-responsive trigger that is capable of masking a phenol on a fluorophore or any other potential chemical scaffold for related imaging and/or therapeutic applications. We demonstrate the utility of this trigger by creating a series of fluorescent probes for FA with excitation and emission wavelengths that span the UV to visible spectral regions through caging of a variety of dye units. In particular, Formaldehyde Probe 573 (FAP573), based on a resorufin scaffold, is the most red-shifted and FA sensitive in this series in terms of signal-to-noise responses and enables identification of alcohol dehydrogenase 5 (ADH5) as an enzyme that regulates FA metabolism in living cells. The results provide a starting point for the broader use of 2-aza-Cope reactivity for probing and manipulating FA biology.
Introduction
Formaldehyde (FA) is a reactive carbonyl species (RCS) that is widely utilized in industrial applications1 as well as a protein cross-linker for tissue fixation.2 Long classified as a toxin and carcinogen,3 FA exposure can occur through a variety of natural and anthropogenic sources including microbe emission, car exhaust, and building materials.4 While traditionally thought of as detrimental to living organisms, FA is an endogenously produced biological metabolite that is continuously released during essential biological pathways, including epigenetics and one-carbon metabolism.5 For example, lysine and arginine demethylase enzymes such as lysine specific demethylase 16 and JmjC domain-containing proteins7 produce FA during epigenetic regulation of histone tails.8,9 In addition, during one-carbon metabolism, demethylation of choline metabolites en route to production of glycine releases FA as a critical one-carbon unit for the synthesis of important biological building blocks.10 Governed by a complex homeostasis involving many metabolic enzyme systems, FA reaches a steady state level of 50–100 μM in the blood11 and 200–500 μM intracellularly.12 Even higher resting levels of FA have been found in a variety of disease states, including neurodegenerative diseases,13 cancer,14 and asthma.15 To counteract the toxicity of FA, living organisms have developed efficient metabolizing pathways for FA. One predominant FA-metabolizing enzyme is cytosolic alcohol dehydrogenase 5 (ADH5) (also known as FA dehydrogenase and alcohol dehydrogenase 3), which oxidizes FA to formate through a glutathione-dependent reaction.16
The dynamics of FA production and consumption in living systems and its understudied consequences continues to motivate the development of new methods for its detection in biological specimens. Traditional detection methods for FA rely upon mass spectrometry,17,18 high-performance liquid chromotography,19,20 and preconcentration/chemical ionization,21 which are highly sensitive but require harsh conditions that are not suitable for live-specimen detection. In this context, fluorescent probes offer a promising mode of FA detection as they have been widely utilized to detect small-molecule biological metabolites through recognition or reactivity-based approaches.22−25 Indeed, reactivity-based methods have been successfully used to visualize other carbonyl species such as carbon monoxide26−30 and methylglyoxal,31 and our lab32,33 and others34−43 have developed new FA indicators suitable for live-cell and live-animal imaging, based largely on 2-aza-Cope or hydrazine condensation reactions.
These initial reports establish the promise of reactivity-based fluorescent approaches for monitoring biological FA but leave room for significant improvement. One key challenge to address is that only a relatively small number of fluorescent scaffolds have been reported for FA detection, because the vast majority of fluorescent FA probes operate through direct modification of the dye backbone to elicit a fluorescence response. As such, efforts to improve FA reactivity and selectivity tend to simultaneously perturb photophysical properties of the dye. This synthetic limitation restricts the ability to tune excitation/emission profiles, cellular localization, and other properties independently of FA reactivity.
To address this outstanding issue, we now present the development of a general 2-aza-Cope reaction trigger with a self-immolative β-elimination linker that can be installed onto any fluorophore containing a common phenol group, enabling a wider range of fluorescent scaffolds to be functionalized for FA detection. Iterative, rational design of triggers to optimize structure–activity relationships for fast kinetics and fluorophore release on a 4-OMe-Tokyo Green (TG) fluorescent scaffold44 can be expanded to deliver a variety of fluorescent FA indicators with excitation and emission profiles spanning wavelengths across the UV to visible spectrum. We further establish the utility of these FA probes to detect changes in this RCS in living cells. Moreover, the resorufin-based congener, FAP573, gives the highest signal-to-noise response and the most red-shifted excitation/emission profile, enabling visualization of changes in the cellular metabolism of FA mediated by ADH5 using genetic knockout models.
Results and Discussion
Design and Synthesis of a General 2-Aza-Cope Reaction-Based Trigger
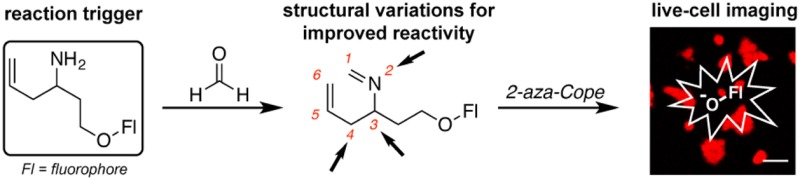
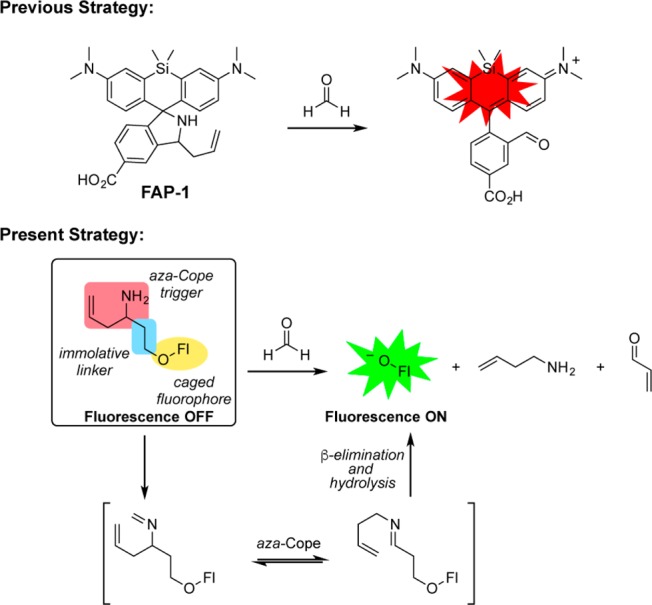
Previous work from our laboratory reported FAP-1, a first-generation reaction-based fluorescent probe for detecting FA through a turn-on response (Scheme 1).32 Specifically, we developed a reactivity-dependent FA indicator through conversion of a homoallyl amine into an aldehyde on a silicon rhodamine scaffold, where control of spirocyclization gives rise to a turn-on fluorescence readout. In attempts to generalize this reaction to develop fluorescent FA probes with a broader range of excitation/emission colors and maintain good insensitivity to pH, we were thwarted by the need to directly functionalize the fluorophore backbone and rely on often complex spirocyclization equilibria to achieve a fluorescence response. We reasoned that separating the dye scaffold and FA-dependent trigger unit into separate, independent pieces might allow for a more general strategy for developing a range of FA-responsive fluorophores. Specifically, we sought to cage phenolic fluorophores with a homoallylamine aza-Cope trigger with a self-immolative linker, envisioning that these O-alkylated fluorophores would react with FA through a 2-aza-Cope rearrangement to the rearranged imine. Subsequent elimination of the two carbon linker via a β-elimination would afford the uncaged phenolate an expected increase in fluorescence in addition to the homoallylamine and acrolein byproducts.45−48 Such a trigger could be applied to phenolic fluorophores or related chemical probes, as well as to amine-based dyes via carbamate linkers.
Scheme 1. Self-Immolative Aza-Cope Strategy for FA-Responsive Fluorescent Probes.
We initiated this study by preparing a general reagent for caging nucleophilic fluorophores via a protected homoallylamine with a β-leaving group. In a first working example, aminoallylation of 4-hydroxybutanone, 1, afforded aminoalcohol 2. Subsequent diazotransfer using Goddard-Borger’s method49 and tosylation afforded the key caging group 3. We explored the caging properties of 3 by appending it to a known fluorescent scaffold, 2-methyl-4-methoxy-Tokyo Green (TG), 4. (Figure 1).44 This derivative has been utilized previously as a platform for reactivity-based bioimaging purposes through masking of its free phenolic group to limit conjugation through the xanthenone portion of the dye.50−55 Accordingly, O-alkylation of the fluorophore with Cs2CO3 and 3, followed by azide reduction using a tin(II) chloride/thiophenol mixture,56 yielded weakly fluorescent, caged TG 6. Upon treatment with FA in aqueous PBS buffer at physiological pH, the anion of 4 is released, resulting in a ca. 10-fold fluorescence increase in response to 100 μM FA within 2 h (Figure 1b). Moreover, the probe also displayed selectivity for FA over other relevant RCS and biological analytes (Figure 1c). Thus, this initial design of a self-immolative 2-aza-Cope reactivity trigger shows a promising approach to convert a phenol-containing fluorophore into a selective FA-responsive fluorescent indicator.
Figure 1.

(a) Reagents and conditions: (i) NH3, MeOH, 0 °C to rt, 30 min, then allyl pinacol boronate, rt, 24 h, 69%; (ii) diazo transfer reagent, CuSO4·5H2O, K2CO3, MeOH, rt, 20 h; (iii) TsCl, Et3N, DMAP, CH2Cl2, rt, 16 h, 27% (2 steps); (iv) 3, Cs2CO3, DMF, 40 °C, 20 h, 62%; (v) SnCl2, PhSH, Et3N, MeCN, rt, 12 h, 91%. (b) Fluorescence response and selectivity of 10 μM probe 6 to 100 μM FA. Data was acquired in 20 mM PBS (pH 7.4) at 37 °C. Emission was collected between 500–600 nm (λex = 488 nm). Lines represent time points taken at 0 (black), 30 (light gray), 60 (gray), 90 (dark gray), and 120 min (red) after addition of 100 μM FA. (c) Fluorescence response of 10 μM probe 6 to RCS or relevant biological analyte. Data was acquired in 20 mM PBS (pH 7.4) at 37 °C. Bars represent relative emission intensity responses to 100 μM analyte after treatment for at 0 (black), 30 (light gray), 60 (gray), 90 (dark gray), and 120 min (red). Analytes were prepared as stated in the Selectivity Tests section of the SI. Legend: (1) PBS, (2) FA, (3) acetaldehyde, (4) acrolein, (5) glucose (1 mM), (6) H2O2, (7) methylglyoxal, (8) dehydroascorbate (9) pyruvate, (10) glucosone, (11) oxaloacetate, (12) 4-hydroxynonenal.
Structure–Activity Studies to Optimize the FA Responses of the Aza-Cope Reaction Trigger
The initial probe 6 established the viability of the aza-Cope reactivity trigger to selectively react with FA to induce a fluorescence response, but the relatively slow conversion of 6 into the uncaged fluorophore presaged potential limitations for its utility in live-cell imaging studies of FA biology. As such, we next explored several synthetic iterations of the trigger structure with the aim of improving aza-Cope reactivity to increase fluorophore signal-to-noise responses. In particular, we targeted systematic modifications to the core trigger structure at the 2, 3, and 4 positions and installed these respective triggers onto the parent TG scaffold (Scheme 2).
Scheme 2. Structural Variation of the Trigger at the 2 Position.

Reagents and conditions: (i) TBSCl, imidazole, CH2Cl2, rt; (ii) 4-nitrotoluenesulfonyl chloride, Et3N, DMAP, CH2Cl2, 0 °C to rt, 73% (3 steps from 1); (iii) MeI, K2CO3, DMF, rt; (iv) TBAF, THF, rt, 95% (2 steps); (v) TsCl, Et3N, DMAP, CH2Cl2, rt, 89%; (vi) 4, Cs2CO3, DMF, 50 °C, 30%; (vii) PhSH, K2CO3, MeCN, 50 °C, 42%; (viii) K2CO3, MeCN, DMF, rt, 20 h, 14%.
Scheme 2 outlines the synthesis of probes 9 and 10, which are modified at the 2 position. The direct monoalkylation of 6 proved surprisingly challenging. An alternative approach used silyl protection and N-nosylation of 2 to yield sulfonamide 7, which can be methylated readily. Conversion of the silyl ether to the tosylate afforded key linker 8. It is noted that judicious choice of protecting group strategies is critical, as attempts to prepare analogues of 8 containing a secondary carbamate or nosylate resulted in rapid intramolecular cyclizations. Conjugation of TG with 8 followed by nosyl group removal with thiophenol provided N-methylated probe 9. An N-trifluoroethylated analogue, 10, could be directly formed through alkylation of 6 with the corresponding triflate.
Probe 14, which possesses a hydrogen at the 3-position in place of the parent methyl group, was synthesized starting from commercially available homoallylamino acid 11. Reduction of the acid and Boc deprotection furnished aminoalcohol 12, which was then converted to azido tosylate 13. Conjugation to the TG fluorophore and azide reduction provided sterically unencumbered variant 14. An alternate trigger modified at the 3-position was constructed beginning with aminoalkylation of ketone 15. The intermediate aminoalcohol was converted to the azide through diazo transfer and then transformed via tosylation to form 16. Fluorophore alkylation and azide reduction then produced caged TG 17, which contains a phenyl group at the 3-position (Scheme 3).
Scheme 3. Structural Variation of the Trigger at the 3 Position.

Reagents and conditions: (i) ethyl chloroformate, Et3N, THF, 0 °C, 30 min, then NaBH4, THF, H2O, rt, 2 h, 72%; (ii) HCl, Et2O, MeOH, 0 °C to rt, 3 h; (iii) diazo transfer reagent, CuSO4·5H2O, K2CO3, MeOH, rt, 14 h; (iv) TsCl, Et3N, DMAP, CH2Cl2, rt, 24 h, 53% (3 steps); (v) 4, Cs2CO3, DMF, 40 °C, 20 h, 58%; (vi) SnCl2, PhSH, Et3N, MeCN, rt, 2.5 h, 33%; (vii) NH3, MeOH, then allyl pinacol boronate; (viii) diazo transfer reagent, CuSO4·5H2O, K2CO3, MeOH, rt, 78% (2 steps); (ix) TsCl, Et3N, DMAP, CH2Cl2, rt, quantitative; (x) 4, Cs2CO3, DMF, 45 °C, 33%; (xi) SnCl2, PhSH, Et3N, MeCN, rt, 74%.
Recent work by Szabó on the addition of sterically hindered allyl boronic acids to ketones57 provided a synthetic route for the installation of alkyl groups at the 4-position of the aza-Cope trigger. In particular, key aminoalcohol intermediate 20, containing gem-dimethyl substitution at the 4-position, was synthesized by treating the imine of 1 with prenyl boronic acid 19 formed in situ. The resulting aminoalcohol was similarly converted to azido tosylate 21. Alkylation and azide reduction yielded caged TG, herein named Formaldehyde Probe 488 (FAP488,Scheme 4) corresponding to its excitation maximum at 488 nm.
Scheme 4. Structural Variation of the Trigger at the 4 Position.

Reagents and conditions: (i) H2PdCl4, tetrahydroxydiboron, DMSO, H2O, rt, 14 h; (ii) 1, NH3, MeOH 0 °C to rt, then 19, CHCl3, rt; (iii) diazo transfer reagent, CuSO4·5H2O, K2CO3, MeOH, rt; (iv) TsCl, Et3N, DMAP, CH2Cl2, rt; (v) 4, Cs2CO3, DMF, 40 °C, 20 h; (vi) SnCl2, PhSH, Et3N, MeCN, rt, 18 h, 11% (2 steps).
Effects of Trigger Modification on FA Probe Sensitivity and Signal-to-Noise Responses
With this family of TG derivatives caged with aza-Cope reactivity triggers modified at the 2, 3, and 4 positions in hand, we compared their relative responses to FA in vitro. Relative probe sensitivity was determined based on the fluorescence response rate of the probe relative to 6. Specifically, compounds 9, 10, 14, 17, and FAP488 were treated with 1 mM FA in PBS buffer, and the change in fluorescence was monitored over time (Figure 2). We observed that modifications at the 2 position (9, 10) resulted in a poorer fluorescence response relative to parent probe 6. We speculate that this decrease in signal-to-noise sensitivity may potentially result from increased steric encumbrance. Additionally, the minimal response of 10 to FA may also be rationalized through decreased nitrogen nucleophilicity due to the inductive effects of the trifluoroethyl group, resulting in a slower initial condensation reaction with FA. Probes modified at the 3 position produced similar (14) or reduced (17) fluorescent responses relative to initial probe 6. In contrast, FAP488, which possesses a gem-dimethyl group at the 4-position, displays greatly enhanced sensitivity to FA, showing an order of magnitude improvement in relative fluorescence response rate compared to the parent trigger that lacks these methyl substituents (Figure 2). We attribute this result to the gem-disubstitution effect, thereby increasing the rate of the aza-Cope reaction.58
Figure 2.

Relative fluorescence response rates of trigger structures appended to TG. Fluorescence response of 10 μM probe to 1 mM FA. Data was acquired in 20 mM PBS (pH 7.4) at 37 °C. Emission was collected between 500–600 nm (λex = 488 nm). Relative fluorescence response rate indicates the linear increase in fluorescence/min at λem (518 nm). Rate was determined by measuring a linear slope of the fluorescence intensity per min before saturation kinetics were observed (Figure S1–S6).
In particular, substitution at the 4-position is anticipated to favor the rearranged imine en route to fluorophore uncaging. The ca. 10-fold fluorescence enhancement displayed by FAP488 relative to parent probe 6 presages that probes derived from aza-Cope trigger piece 21 would yield fluorescent FA indicators with greater signal-to-noise responses and FA sensitivity. As such, this improved aza-Cope trigger provides a starting point for further fluorescent probe development.
Developing a Series of Fluorescent FA probes with Varying Excitation/Emission Profiles with a General Aza-Cope Trigger
With these results in hand, we then used the gem-dimethyl aza-Cope trigger as a general caging group to create a series of homologous FA probes with fluorescence excitation and emission profiles that span the UV through visible spectral regions (Scheme 5). The naming convention for these FA indicators follows as Formaldehyde Probe (FAP) with a number corresponding to its maximal excitation wavelength. For example, we utilized a trifluoromethyl-substituted coumarin with an excitation wavelength of 385 nm to produce FAP385 as a blue-emitting probe. FAP498 is derived from a green-emitting trifluoroethyl rhodol scaffold that exhibits an excitation wavelength of 498 nm. A carbofluorescein scaffold with the carboxylic acid substituted for a trifluoromethyl group was prepared for an orange-emitting FAP555 with an excitation wavelength of 555 nm.59 Finally, the red-emitting FAP573 is based on a resorufin scaffold with a corresponding excitation wavelength of 573 nm.
Scheme 5. Synthesis of a Series of FA-Responsive Fluorescent Probes.

Notably, all four of these probes, along with FAP488, feature distinctly different fluorescent scaffolds with varying excitation/emission profiles but can all be synthesized using the same trigger conjugation strategy. Briefly, treatment of the fluorophore with Cs2CO3 and tosylate 21 allows for the conjugation of the azide-trigger to the parent dye. Reduction of the azide through a tin(II) chloride/thiophenol mixture gives the homoallylamine-trigger conjugated to the fluorophore.
Spectroscopic Responses to FA and FA Selectivity
We next evaluated the fluorescence responses of the FAP series to FA in aqueous solution buffered to physiological pH (Figure 3). FAP385 is initially weakly fluorescent (ϕfl = 0.11, ε385 = 1750 M–1 cm–1) and exhibits a ca. 4.5-fold fluorescence turn-on response to 100 μM FA after 2 h. FAP498 (ϕfl = 0.23, ε480 = 1818 M–1 cm–1) shows only a ca. 2.2-fold response to 100 μM FA after 2 h due to the higher initial fluorescent background signal, which is likely a result of the more favorable equilibrium of the open-form alcohol over the closed-form lactone in aqueous solution at near neutral pH. FAP555 (ϕfl = 0.50, ε573 = 12 175 M–1 cm–1) displays a large bathochromic shift upon elimination of the trigger, leading to a ca. 10-fold increase in fluorescence response to FA after 2 h. Similar to FAP385, FAP573 displays weak initial fluorescence (ϕfl = 0.18, ε573 = 1369 M–1 cm–1) and gives a ca. 4-fold increase in fluorescence response to FA after 2 h. At 10 μM probe after 2 h incubation, all probes display a 10 μM limit of detection for FA (Figure S7). The pseudo first order kinetic plots of FAP498, FAP555, and FAP573 all display similar rate constants of k = 7 × 10⁻⁴ s–1, which can be converted into bimolecular rate constants of k = 0.14(1) M–1 s–1 by taking into account the concentration of FA (5 mM) used in high excess for these experiments (Figure S8).
Figure 3.

Fluorescence responses and selectivities of FA probes. (a–c) Fluorescence responses of 10 μM (a) FAP385, (b) FAP498, (c) FAP555, or (d) FAP573 to 100 μM FA. Data were acquired in 20 mM PBS (pH 7.4) at 37 °C. Emission was collected between (a) 450–535 nm (λex = 385 nm), (b) 505–645 nm (λex = 498 nm), (c) 560–625 nm (λex = 555 nm) or (d) 578–650 nm (λex = 573 nm). Lines represent time points taken at 0 (lightest gray), 30 (light gray), 60 (gray), 90 (dark gray), and 120 min (colored) after addition of 100 μM FA. (e–h) Fluorescence responses of 10 μM probe to RCS or relevant biological analyte. Bars represent emission intensity responses to 100 μM analyte unless otherwise stated for 0 (lightest gray), 30 (light gray), 60 (gray), 90 (dark gray), and 120 (darkest gray) min, except FA, which is shown in colored bars. Analytes were prepared as stated in the Selectivity Tests section of the SI. Legend: (1) PBS, (2) FA, (3) acetaldehyde, (4) glucose (1 mM), (5) 4-hydroxynonenal, (6) dehydroascorbate, (7) glucosone, (8) pyruvate, (9) oxaloacetate, (10) acrolein, (11) methylglyoxal, (12) H2O2, (13) glutathione (5 mM).
The data show that this gem-dimethyl aza-Cope trigger allows for the rational and general functionalization of a wide variety of fluorophores for FA detection by separating the dye scaffold from the FA-reactive cage. As expected from the demonstrated FA specificity of the aza-Cope reaction trigger for FA, FAP385, FAP498, FAP555, and FAP573 all exhibit high selectivity for FA over a panel of biologically relevant RCS such as methylglyoxal, 4-hydroxynonenal, and acetaldehyde. Moreover, these aldehydes do not interfere with the turn-on response of these reagents to FA (Figure S9). The probes also do not respond to addition of reagents that induce higher levels of oxidizing (H2O2) and reducing (glutathione) equivalents in the cell.60 Taken together, the data establish that this 2-aza-Cope reactivity trigger can be generally applied to develop probes with a selective response to FA with varying excitation and emission colors.
Application of FAP Reagents to Turn-on Fluorescence Detection of Changes in FA Levels in Living Cells
After confirming all four FAP probes are responsive and selective for FA in aqueous buffer, we next assessed their capability for detecting changes in FA levels in living cells. Incubation of HEK293T cells with 10 μM FAP385 (Figure S10), 5 μM FAP498 (Figure 4), 10 μM FAP555 (Figure 5), or 10 μM FAP573 (Figure 6) for 30 min at 37 °C in BSS buffer, followed by a wash into fresh buffer to remove excess probe, allowed for initial probe staining of cells with low background. Exogenous additions of 200–1000 μM FA for 30 and 60 min resulted in a linear increase for green, orange, and red intracellular fluorescence for FAP498, FAP555, and FAP573, respectively, establishing the utility of these three indicators for live-cell FA imaging However, cells incubated with FAP385 display a background increase in the surrounding media over the course of the FA treatment, suggesting that the lower fluorescence response for live-cell imaging may be due to poor cellular retention of the probe or its fluorescent product (Figure S10). Flow cytometry experiments were performed to verify probe turn-on in cells (Figure S11–S13). In all cases, nuclear staining and/or flow cytometry experiments confirmed that the cells remain viable throughout the course of the experiment (Figure S14). For the case of FAP555, nuclear staining was not used due to the broad excitation of both the caged (λex = 420 nm) and uncaged probe overlapping with commonly available nuclear dyes.
Figure 4.
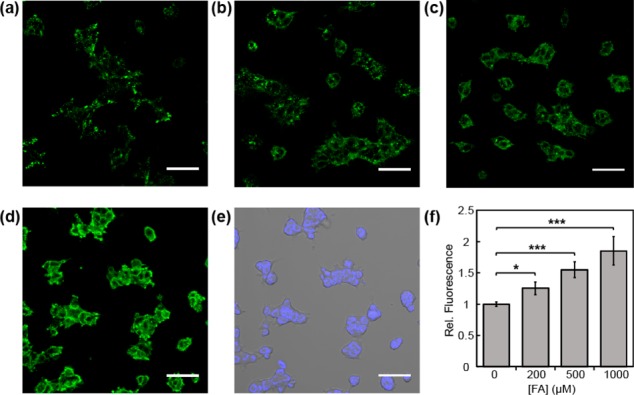
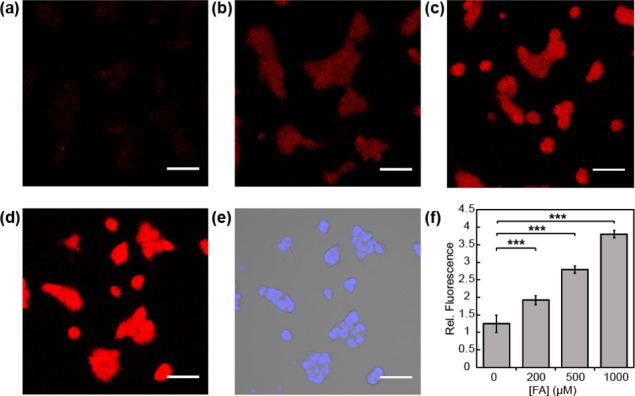
Confocal microscopy images of FAP498 in response to exogenous FA addition in HEK293T cells. Cells were treated with 5 μM FAP498 in BSS buffer for 30 min, exchanged into fresh buffer, and then treated with (a) vehicle, (b) 200, (c) 500, or (d) 1000 μM FA. Images were taken after 60 min. (e) Bright field image of cells in (d) overlaid with 1 μM Hoechst 33342. (f) Mean fluorescent intensities of cells in (a–d) 60 min after addition of FA relative to mean fluorescence intensity before addition of vehicle or FA; error bars denote SEM (n = 3). *P < 5 × 10⁻³, ***P < 5 × 10⁻⁵. Scale bar represents 50 μm in all images.
Figure 5.
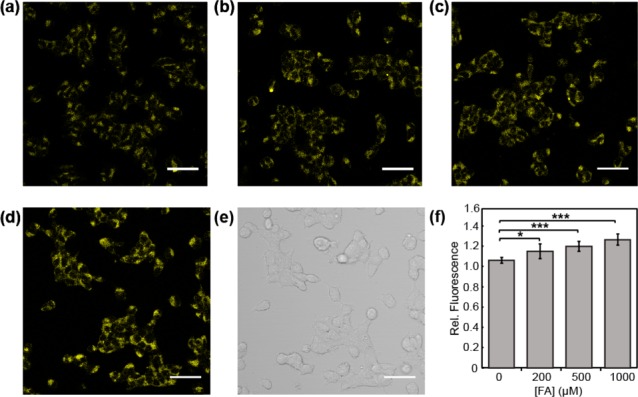
Confocal microscopy images of FAP555 in response to exogenous FA addition in HEK293T cells. Cells were treated with 10 μM FAP555 in BSS buffer for 30 min, exchanged into fresh buffer, and then treated with (a) vehicle, (b) 200, (c) 500, or (d) 1000 μM FA. Images were taken after 60 min. (e) Bright field image of cells in (d). (f) Mean fluorescent intensities of cells in (a–d) 60 min after addition of FA relative to mean fluorescence intensity before addition of vehicle or FA; error bars denote SEM (n = 3). *P < 5 × 10⁻³, ***P < 5 × 10⁻⁵. Scale bar represents 50 μm in all images.
Figure 6.
Confocal microscopy images of FAP573 in response to exogenous FA addition in HEK293T cells. Cells were treated with 10 μM FAP573 in BSS buffer for 30 min, exchanged into fresh buffer, and then treated with (a) vehicle, (b) 200, (c) 500, or (d) 1000 μM FA. Images were taken after 60 min. (e) Bright field image of cells in (d) overlaid with 1 μM Hoechst 33342. (f) Mean fluorescent intensities of cells in (a–d) 60 min after addition of FA relative to mean fluorescence intensity before addition of vehicle or FA; error bars denote SEM (n = 3). ***P < 5 × 10⁻⁵. Scale bar represents 50 μm in all images.
While three probes are capable of detecting changes in intracellular FA levels with exogenously added FA, we observed that FAP498 and FAP555 exhibit a lower fluorescence turn-on response to FA compared to FAP573, which displays the best response to FA in this series owing to its relatively homogeneous staining and good cellular retention throughout the imaging experiments. These properties led us to utilize FAP573 in further experiments to study endogenous FA metabolism in living cells.
FAP573 Enables Detection of FA Fluxes via ADH5 Metabolism
We next sought to establish the potential value of FAP573 for monitoring intracellular metabolism of FA to identify sources and targets of this RCS. In this context, alcohol dehydrogenase 5 (ADH5) is a major enzyme responsible for cellular FA metabolism, and the recent development of two ADH5 knockout (KO) cell lines, mouse endothelial fibroblasts61 (MEF) and near-haploid cells (HAP1) (Figure S15), offers the possibility to directly evaluate whether FAP reagents can monitor potential changes in FA levels regulated by this enzyme in living cells. Along these lines, we reasoned that ADH5 KO cells would exhibit impaired FA clearance compared to wild-type (WT) counterparts. To test this hypothesis, WT and KO MEF (Figure S16) or KO HAP1 (Figure 7) cells were loaded with 10 μM FAP573 in BSS buffer at 37 °C for 30 min. The cells were washed with fresh buffer to remove excess probe, and then incubated with 0 or 100 μM FA for 60 min. Nuclear staining and flow cytometry experiments confirm cell viability during the experiment (Figure S14). Interestingly, FAP573 showed patently higher fluorescence signals in both MEF KO and HAP1 KO cells compared to their WT congeners upon FA incubation by both confocal microscopy and flow cytometry (Figure S17), establishing that FA metabolism is impeded in the KO cells. Moreover, addition of a FA scavenger, NaHSO3,35 showed a lower level of fluorescence under the same conditions, confirming the fluorescence increase due to lower FA metabolism (Figure S18). Furthermore, FAP573 was able to show a higher level of fluorescence to basal levels of FA in KO cells compared to WT and KO cells with NaHSO3 by confocal microscopy and flow cytometry (Figure 8). Elimination of ADH5 results in a loss of a key FA metabolism pathway and excess buildup of this RCS, which has been shown to be a metabolic carcinogen and a hemoatopoietic stem cell genotoxin related to leukemia models. These data provide a unique example of a chemical tool that enables direct visualization of endogenous FA in living systems through fluorescence imaging with identification of a specific molecular source for its metabolism.
Figure 7.
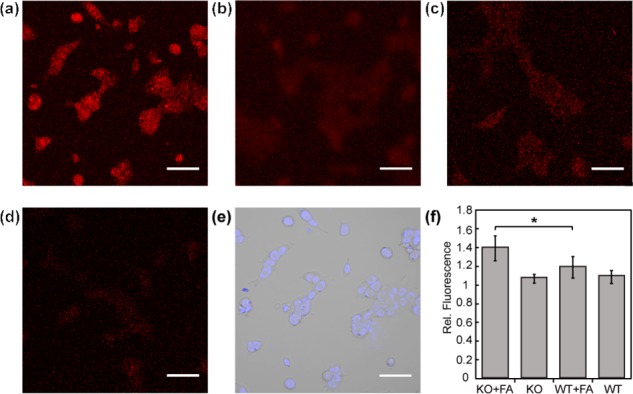
Confocal microscopy images of FAP573 in response to FA metabolism in ADH5 KO (a,b) or WT (c,d) HAP1 cells. Cells were treated with 10 μM FAP573 for 30 min, exchanged into fresh buffer, and then treated with vehicle (b,d) or 100 μM FA (a,c). Images were taken after 60 min. (e) Bright field image of (a) overlaid with 1 μM Hoechst 33342. (f) Mean fluorescent intensities of cells in (a–d) 60 min after addition of FA relative to mean fluorescence intensity before addition of vehicle or FA; error bars denote SEM (n = 3). *P < 5 × 10⁻³. Scale bar represents 50 μm in all images.
Figure 8.
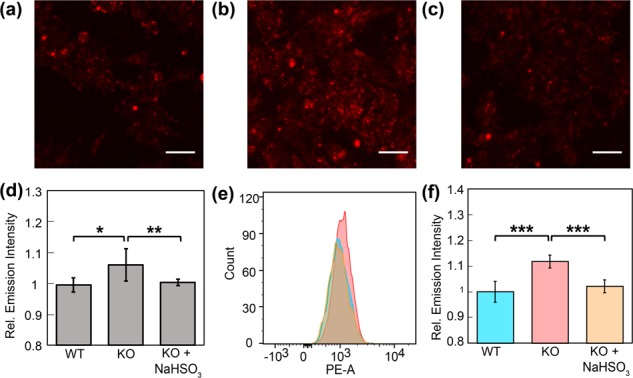
Confocal microscopy images (a–c) and flow cytometry histograms (e) of FAP573 in response to basal FA levels in (a) WT, (b) ADH5 KO, and (c) ADH5 KO HAP1 cells with 200 μM NaHSO3. (a,b) Cells were treated with 1 μM FAP573 for 30 min, then exchanged into fresh buffer. (c) Cells were treated with 200 μM NaHSO3 for 30 min, and then as in (a,b) keeping 200 μM NaHSO3 present in all buffers. Images were taken after 60 min. (d) Mean fluorescent intensities of cells in (a–c) 60 min after addition of FAP573 to mean fluorescence intensity of cells in (a). (e) Representative flow cytometry experiment of 1 μM FAP573 incubated in WT (blue), ADH5 KO (red) or KO cells with NaHSO3 (orange) for 1 h. (f) Mean fluorescence intensity of median PE-A fluorescence relative to fluorescence intensity of median PE-A in the WT cells; error bars denote SEM (n = 3). *P < 5 × 10⁻³, **P < 5 × 10⁻⁴. ***P < 5 × 10⁻⁵. Scale bar represents 50 μm in all images.
Concluding Remarks
We have presented the development of a general 2-aza-Cope reactivity trigger and its application to produce fluorescent probes for imaging FA in living cells. Rational, iterative optimization on a Tokyo Green platform affords a gem-dimethyl derivative bearing a self-immolative β-elimination linker that can be installed onto any fluorescent dye scaffold that bears a phenol functionality. Notably, this relatively modest chemical change enables a ca. 10-fold increase in fluorescence turn-on response over the parent homoallylamine trigger. By separating the FA-reactive cage from the fluorophore backbone, FA responses can be tuned in a dye-independent manner to create a broad range of FA probes in a convergent fashion. We have applied this trigger to produce a set of fluorescent probes for FA detection with high and predictable selectivity and sensitivity for monitoring FA in solution and in cells with excitation and emission colors that span from blue to green to orange to red, either by flow cytometry and/or live-cell imaging. Resorufin-based FAP573 exhibits the best signal-to-noise response and most red-shifted excitation and emission profile enables identification of ADH5 as a key enzyme for endogenous metabolism of FA in living cells using ADH5 KO fibroblast and haploid cell models. Current efforts are underway to further expand the scope of this aza-Cope reactivity trigger for developing FA probes with expanded color palettes, cellular and subcellular targeting capabilities, and application to different chemical strategies for FA imaging and therapeutic applications. Because this trigger is potentially applicable to any alcohol or amine scaffold by a direct connection or through an additional self-immolative linkage, we envision the broader utility of this chemistry in elucidating new sources and targets of FA metabolism in biological pathways related to cell viability and disease state progression, akin to the boronate trigger that has proven useful for studying the chemical biology of hydrogen peroxide.62,63 Of particular interest is identifying and elucidating the contributions of FA in biological stress mechanisms during carcinogenesis, asthma progression, and neurodegenerative disorders.
Experimental Details
Synthetic Materials and Methods
Reactions utilizing air- or moisture-sensitive reagents were performed in oven- or flame-dried glassware under an atmosphere of dry N2. Reagents from commercial sources were used without further purification. 4-Hydroxynonenal solution was purchased from Cayman Chemical (Ann Arbor, MI); 2,2,2-trifluoroethyl trifluoromethanesulfonate was purchased from AK Scientific (Union City, CA); glucosone was purchased from Santa Cruz Biotech (Dallas, TX); thiophenol was purchased from Oakwood Chemical (Estill, SC); 3-((tert-butoxycarbonyl)amino)hex-5-enoic acid was purchased from ChemPep (Wellington, Fl); and all other reagents were purchased from Sigma-Aldrich (St. Louis, MO). 1-(Azidosulfonyl)-1H-imidazol-3-ium chloride (Goddard’s diazo transfer reagent) was prepared according to published procedures.49 Prenylboronic acid solution was prepared through a slightly modified literature procedure.64 3,6-Bis((tert-butyldimethylsilyl)oxy)-10,10-dimethylanthracen-9(10H)-one was prepared according to published procedures.59 (Z)-9-(2-(Hydroxymethyl)phenyl)-3-((2,2,2-trifluoroethyl)imino)-3H-xanthen-6-ol was prepared according to published procedures.65 Silica gel P60 (SiliCycle) was used for all column chromatography purifications and SiliCycle 60 F254 silica gel (precoated sheets, 0.25 mm thick) was used for thin layer chromatography. 1H NMR and 13C NMR spectra were collected in CDCl3 or CD3OD (Cambridge Isotope Laboratories, Cambridge, MA) at 25 °C on Bruker AV-500 and AV-300 (used for 1H NMR only), AVB-400, and AVQ-400 with 13C operating frequencies of 101 MHz at the College of Chemistry NMR Facility at the University of California, Berkeley. Chemical shifts are reported in the standard δ notation of parts per million relative to residual solvent peak at 7.26 (CDCl3) or 3.31 (CD3OD) for 1H and 77.16 (CDCl3) or 49.00 (CD3OD) for 13C as an internal reference. Splitting patterns: br, broad; s, singlet; d, doublet; t, triplet; m, multiplet; dd, doublet of doublets; dt, doublet of triplets; qt, quartet of triplets; ddt, doublet of doublet of triplets. Low-resolution electrospray mass spectral analyses were performed using a LC–MS (Advion Expression-L Compact MS, ESI source). High resolution mass spectral analyses (ESI-MS) were performed at the College of Chemistry Mass Spectrometry Facility at the University of California, Berkeley.
General Synthesis I for Conjugation of FA Trigger to Fluorophores
To an oven-dried 2-neck round-bottomed flask was added phenolic fluorophore (1.2 equiv) and Cs2CO3 (1.2 equiv) dissolved in anyhydrous DMF. The FA trigger (1 equiv) was added dropwise, and the solution was stirred under N2 at 40 °C for 12 h. The DMF was removed under high vacuum, and purification by silica chromatography (EtOAc/hexanes) afforded the fluorophore conjugated to the azido-trigger.
General Synthesis II for Azide Reduction
To an oven-dried 2-neck round-bottomed flask was added SnCl2 (1.5 equiv) and a solution of PhSH (4.5 equiv) and Et3N (4.5 equiv) in MeCN. The reaction mixture was stirred for 15 min at room temperature, then azide-conjugated fluorophore (1 equiv) was added as a solution in MeCN and stirred at room temperature for an additional 12 h. The reaction was concentrated under reduced pressure, diluted in CH2Cl2, and poured into 2 M NaOH. The organic layer was extracted with CH2Cl2, dried over Na2SO4, filtered, and concentrated under reduced pressure. Purification by silica chromatography (EtOAc/hexanes) afforded the formaldehyde probe.
1-((tert-Butyldimethylsilyl)oxy)-3-methylhex-5-en-3-amine (2)
A 2-neck flask was charged with 1 (213 μL, 2.47 mmol), cooled to 0 °C and ammonia was added (5.0 mL, 7.0 M in MeOH). After stirring for 30 min, allyl pinacol boronate (550 μL, 2.96 mmol) was added dropwise, and the resulting solution stirred at room temperature for 24 h. The volatiles were then removed under reduced pressure, and the residue was taken up in 1 M HCl and washed with Et2O (3×). The aqueous layer was then basified with KOH and extracted with CH2Cl2 (3×). The combined organic layer was dried over Na2SO4, filtered and concentrated under reduced pressure to provide 2 as a colorless oil (221 mg, 69%). 1H NMR (400 MHz, CDCl3) δ 5.83 (ddt, J = 17.6, 10.3, 7.5 Hz, 1H), 5.15–5.01 (m, 2H), 3.77 (t, J = 6.7 Hz, 2H), 2.13 (d, J = 7.5 Hz, 2H), 1.96 (s, 2H), 1.61 (t, J = 6.7 Hz, 2H), 1.23 (s, 2H), 1.08 (s, 3H), 0.06 (d, J = 10.8 Hz, 9H). LRMS calcd. for C13H29NOSi (M + H) 244.20, found 244.2.
3-Azido-3-methylhex-5-en-1-ol (2-ii)
To a solution of CuSO4·5H2O (2.0 mg, 7.7 μmol), K2CO3 (53.0 mg, 0.39 mmol), MeOH (4.0 mL) and 2 (100 mg, 0.774 mmol) at room temperature was added Goddard’s diazo transfer reagent (161 mg, 0.929 mmol), resulting in a change in color from blue to teal. The resulting slurry stirred at room temperature for 20 h, after which the volatiles were removed under reduced pressure, and the residue was taken up in 1 M HCl and extracted with EtOAc (3×). The combined organic layer was dried over Na2SO4, filtered, and concentrated to afford crude 2-ii as a colorless oil (crude, 116 mg). 1H NMR (300 MHz, CDCl3) δ 5.81 (ddt, J = 15.3, 11.0, 7.3 Hz, 1H), 5.23–5.10 (m, 1H), 5.01 (s, 1H), 3.92 (s, 1H), 3.79 (t, J = 6.4 Hz, 1H), 3.06 (s, 1H), 1.89–1.65 (m, 1H), 1.29 (d, J = 25.1 Hz, 3H). LRMS calcd. for C7H13N3O (M + H) 155.10, found 155.2.
3-Azido-3-methylhex-5-en-1-yl 4-methylbenzenesulfonate (3)
To a solution of crude 2-ii (116 mg) in CH2Cl2 (3.75 mL) was added TsCl (172 mg, 0.900 mmol), DMAP (9.0 mg, 0.075 mmol), and Et3N (125 μL, 0.900 mmol). After stirring for 16 h at room temperature, the solution was poured into sat. aqueous NH4Cl and extracted with CH2Cl2 (3×). The combined organic layer was dried over Na2SO4, filtered, and concentrated under reduced pressure. Purification via column chromatography (0 → 10% EtOAc/hexanes gradient) afforded 4 as a colorless oil (64 mg, 27% from 2). 1H NMR (300 MHz, CDCl3) δ 7.79 (d, J = 8.1 Hz, 2H), 7.36 (d, J = 8.1 Hz, 2H), 5.85–5.64 (m, 1H), 5.21–5.04 (m, 2H), 4.13 (t, J = 6.9 Hz, 2H), 2.45 (s, 4H), 2.25 (d, J = 7.3 Hz, 2H), 1.83 (t, J = 8.1 Hz, 2H), 1.25 (s, 3H). 13C NMR (75 MHz, CDCl3) δ 162.44, 145.09, 132.91, 132.05, 130.05, 128.04, 119.97, 66.54, 44.45, 37.84, 23.47, 21.81. LRMS calcd. for C14H19N3O3S (M + H) 310.11, found 310.4.
6-((3-Azido-3-methylhex-5-en-1-yl)oxy)-9-(4-methoxy-2-methylphenyl)-3H-xanthen-3-one (5)
Synthesized via general synthesis I described above (46.8 mg, 56%). 1H NMR (400 MHz, CDCl3) δ 7.01 (ddd, J = 38.6, 20.6, 11.2 Hz, 6H), 6.76 (d, J = 6.6 Hz, 1H), 6.58 (d, J = 9.7 Hz, 1H), 6.45 (s, 1H), 5.96–5.72 (m, 1H), 5.29–5.12 (m, 2H), 4.21 (t, J = 6.6 Hz, 2H), 3.89 (s, 3H), 2.38 (d, J = 7.2 Hz, 2H), 2.04 (s, 5H), 1.37 (s, 3H). LRMS calcd. for C28H27N3O4 (M + H) 470.20, found 470.5.
6-((3-Amino-3-methylhex-5-en-1-yl)oxy)-9-(4-methoxy-2-methylphenyl)-3H-xanthen-3-one (6)
Synthesized via general synthesis II described above (6.3 mg, 91%). 1H NMR (400 MHz, MeOD) δ 7.29 (d, J = 2.3 Hz, 1H), 7.27–7.12 (m, 3H), 7.11–6.96 (m, 3H), 6.63 (dd, J = 9.6, 1.9 Hz, 1H), 6.48 (d, J = 1.9 Hz, 1H), 6.01–5.86 (m, 1H), 5.40–5.26 (m, 2H), 4.39 (t, J = 5.8 Hz, 2H), 3.90 (s, 3H), 2.52 (d, J = 7.4 Hz, 2H), 2.23 (t, J = 5.7 Hz, 2H), 2.03 (s, 3H), 1.45 (s, 3H). LRMS calcd. for C28H29NO4 (M + H) 444.21, found 444.2.
N-(1-((tert-Butyldimethylsilyl)oxy)-3-methylhex-5-en-3-yl)-4-nitrobenzenesulfonamide (7)
To a solution of 2 in 13 mL CH2Cl2 in a 50 mL round-bottomed flask was added pyridine (0.22 mL, 2.7 mmol) followed by 4-Nitrobenzenesulfonyl chloride (0.60 g, 2.7 mmol) to form a deep orange solution. After stirring at room temperature for 24 h, the reaction was poured into sat. NH4Cl (50 mL), extracted with CH2Cl2 (3×), dried over Na2SO4, filtered, and concentrated under reduced pressure. Purification via column chromatography (0 → 30% EtOAc/hexanes gradient) afforded 7 as a dark yellow oil (65 mg, 6% from 2). 1H NMR (300 MHz, CDCl3) δ 8.37–8.24 (m, 2H), 8.09–7.98 (m, 2H), 6.78 (s, 1H), 5.65 (ddt, J = 16.4, 10.6, 7.3 Hz, 1H), 5.11–4.97 (m, 2H), 3.82 (pt, J = 6.7, 3.4 Hz, 2H), 2.60–2.39 (m, 2H), 1.78–1.49 (m, 3H), 1.22 (s, 4H), 0.10 (d, J = 10.9 Hz, 8H). LRMS calcd. for C19H32N2O5SSi (M–H) 427.18, found 427.1.
3-Methyl-3-((N-methyl-4-nitrophenyl)sulfonamido)hex-5-en-1-yl 4-methylbenzenesulfonate (8)
A solution of 7 (0.122 g, 0.274 mmol) in 1 mL DMF was added to a 10 mL round-bottomed flask. Then, K2CO3 (0.075 g, 0.55 mmol) was added followed by dropwise addition of methyl iodide (0.025 mL, 0.38 mmol). The reaction was stirred overnight at room temperature. The reaction mixture was partitioned between EtOAc and H2O, washed with H2O (3×), dried over Na2SO4, filtered, and concentrated under reduced pressure.
The concentrated material was resuspended in THF, placed in a 10 mL round-bottomed flask, and cooled to 0 °C. Then, tetra-n-butylammonium fluoride (1.0 M in THF, 0.27 mL, 0.28 mmol) was added dropwise to form a yellow solution that was warmed to room-temperature and stirred for 16 h. The reaction was poured into sat. NH4Cl (20 mL), extracted with CH2Cl2 (3×), dried over Na2SO4, filtered, and concentrated under reduced pressure. Purification via column chromatography (45% EtOAc/hexanes) afforded a yellow oil.
The oil was dissolved CH2Cl2 (1.5 mL) and added to a 10 mL round-bottomed flask. Then, TsCl (43 mg, 0.23 mmol), DMAP (2.5 mg, 0.021 mmol), and Et3N (30 μL, 0.23 mmol). After stirring for 16 h at room temperature, the solution was poured into sat. aqueous NH4Cl and extracted with CH2Cl2 (3×). The combined organic layer was dried over Na2SO4, filtered, and concentrated under reduced pressure. Purification via column chromatography (0 → 35% EtOAc/hexanes gradient) afforded 8 as a colorless oil (91 mg, 9.4% from 2). 1H NMR (300 MHz, CDCl3) δ 8.41–8.21 (m, 2H), 8.00–7.89 (m, 2H), 7.82–7.69 (m, 2H), 7.35 (d, J = 8.0 Hz, 2H), 5.49 (ddt, J = 17.2, 10.2, 7.2 Hz, 1H), 5.13–4.94 (m, 2H), 4.21–3.97 (m, 3H), 2.94 (s, 3H), 2.56 (dd, J = 14.2, 6.8 Hz, 1H), 2.45 (s, 3H), 2.32 (ddt, J = 21.3, 14.1, 6.9 Hz, 3H), 2.04 (s, 1H), 1.96 (dd, J = 14.7, 7.3 Hz, 1H), 1.33 (s, 3H), 1.25 (t, J = 7.1 Hz, 1H).
N-(1-((9-(4-Methoxy-2-methylphenyl)-3-oxo-3H-xanthen-6-yl)oxy)-3-methylhex-5-en-3-yl)-N-methyl-4-nitrobenzenesulfonamide (8-vi)
Synthesized via general synthesis I described above. 1H NMR (300 MHz, MeOD) δ 8.16 (dd, J = 8.9, 2.5 Hz, 2H), 8.04 (d, J = 8.8 Hz, 2H), 7.25–6.98 (m, 5H), 6.90 (t, J = 2.3 Hz, 1H), 6.78 (ddd, J = 8.9, 5.2, 2.4 Hz, 1H), 6.63 (dd, J = 9.6, 2.1 Hz, 1H), 6.49 (t, J = 1.8 Hz, 1H), 5.80 (dtd, J = 15.7, 8.0, 6.1 Hz, 1H), 5.25–5.05 (m, 2H), 3.90 (s, 5H), 3.13 (d, J = 1.2 Hz, 3H), 2.76 (dt, J = 13.8, 6.8 Hz, 1H), 2.59–2.43 (m, 1H), 2.34 (dd, J = 14.2, 7.5 Hz, 1H), 2.09–1.97 (m, 4H), 1.53 (s, 3H), 1.28 (s, 1H), 0.98–0.82 (m, 2H). LRMS calcd. for C35H34N2O8S (M + H) 643.20, found 643.3.
9-(4-Methoxy-2-methylphenyl)-6-((3-methyl-3-(methylamino)hex-5-en-1-yl)oxy)-3H-xanthen-3-one (9)
To a solution of 8-vi (6.0 mg, 9.0 μmol) in MeCN, was added K2CO3 (5.5 mg, 14 μmol) and thiophenol (1.4 μL, 14 μmol). The reaction mixture was heated at 50 °C for 16 h. The reaction was then cooled, and directly purified by column chromatography (0 → 10% MeOH/CH2Cl2) to give a yellow oil (1.75 mg, 42%). 1H NMR (400 MHz, CDCl3) δ 7.11–6.96 (m, 3H), 6.91 (d, J = 10.7 Hz, 2H), 6.78 (d, J = 9.0 Hz, 1H), 6.60 (d, J = 9.7 Hz, 1H), 6.48 (s, 1H), 5.84 (dd, J = 16.8, 8.9 Hz, 1H), 5.28–5.09 (m, 2H), 4.26 (t, J = 6.8 Hz, 2H), 3.90 (s, 2H), 2.45 (s, 2H), 2.36 (d, J = 7.4 Hz, 1H), 2.04 (s, 4H), 1.26 (s, 7H). LRMS calcd. for C29H31NO4 (M + H) 458.22, found 458.3.
9-(4-Methoxy-2-methylphenyl)-6-((3-methyl-3-((2,2,2-trifluoroethyl)amino)hex-5-en-1-yl)oxy)-3H-xanthen-3-one (10)
A solution of 6 in 0.4 mL DMF was added to a dry 5 mL round-bottomed flask. Then, K2CO3 (14.8 mg, 0.107 mmol) was added, followed by 2,2,2-trifluoroethyl trifluoromethanesulfonate (74 μL of a 7 M solution in MeCN, 0.052 mmol). The reaction was stirred for 5 h at room temperature. Additional 2,2,2-trifluoroethyl trifluoromethanesulfonate (74 μL of a 7 M solution in MeCN, 0.052 mmol) was added, and the reaction was stirred for 24 h. The solvent was removed under reduced pressure, and purification via column chromatography (0 → 15% MeOH/CHCl3 gradient) afforded 10 as a yellow solid (5.1 mg, 23%) 1H NMR (400 MHz, CDCl3) δ 7.18–6.86 (m, 5H), 6.78 (dd, J = 8.9, 2.4 Hz, 1H), 6.61 (dd, J = 9.7, 2.0 Hz, 1H), 6.50 (d, J = 1.9 Hz, 1H), 5.80 (ddt, J = 17.5, 10.5, 7.1 Hz, 1H), 5.24–5.11 (m, 2H), 4.37–4.11 (m, 2H), 3.90 (s, 3H), 3.28 (dq, J = 14.4, 9.3 Hz, 1H), 3.12 (dq, J = 14.5, 9.3 Hz, 1H), 2.97 (p, J = 5.8 Hz, 1H), 2.28 (h, J = 7.1, 6.5 Hz, 2H), 2.05 (s, 4H), 1.88–1.68 (m, 5H), 1.26 (s, 2H). LRMS calcd. for C29H28F3NO4 (M + H) 526.21, found 526.0.
1-Hydroxyhex-5-en-3-aminium chloride (12)
A solution of 11 ((S)-3-Boc-amino-5-hexenoic acid) (1.40 g, 6.11 mmol) was dissolved in dry THF (21 mL) and cooled to 0 °C. To the resulting solution was added Et3N (1.70 mL, 12.2 mmol) and ethyl chloroformate (0.70 mL, 7.3 mmol), causing a white precipitate to form, and the reaction was filtered after stirring for 30 min at 0 °C. After cooling the filtrate to 0 °C, NaBH4 (462 mg, 12.2 mmol) and H2O (2 mL) were added, and the resulting mixture stirred for 2 h at room temperature. The reaction was quenched with sat aq NH4Cl, the THF was removed under reduced pressure, and the resulting solution was extracted with EtOAc (3×). The combined organic layer was washed with H2O, 1 M aq NaOH, and brine, then dried over Na2SO4, filtered, and concentrated under reduced pressure. Purification via column chromatography (5 → 20% EtOAc/hexanes) provided 12 as a colorless oil (0.944 g, 72%). 1H NMR (400 MHz, MeOD) δ 5.93–5.72 (m, 1H), 5.33–5.18 (m, 2H), 5.00–4.86 (m, 3H), 3.89–3.66 (m, 2H), 3.42 (t, J = 6.8 Hz, 1H), 3.33–3.27 (m, 1H), 2.55–2.37 (m, 2H), 1.95–1.71 (m, 2H). LRMS calcd. for C6H14ClNO (M + H) 152.07, found 152.1.
3-Azidohex-5-en-1-yl 4-methylbenzenesulfonate (13)
To a solution of CuSO4·5H2O (7.0 mg, 0.03 mmol), K2CO3 (850 mg, 6.16 mmol), MeOH (12 mL) and 12 at room temperature was added Goddard’s diazo transfer reagent (573 mg, 2.74 mmol), resulting in a change in color from blue to teal. The resulting slurry stirred at room temperature for 14 h, after which the volatiles were removed under reduced pressure, and the residue was taken up in 1 M HCl and extracted with EtOAc (3×). The combined organic layer was dried over Na2SO4, filtered, and concentrated under reduced pressure to afford crude 12-iii as a colorless oil that was used directly in the next step.
To a solution of crude 12-iii in CH2Cl2 (10 mL) was added TsCl (625 mg, 3.28 mmol), DMAP (107 mg, 0.876 mmol), and Et3N (457 μL, 3.28 mmol). After stirring for 24 h at room temperature, the solution was poured into sat. aqueous NH4Cl and extracted with CH2Cl2 (3×). The combined organic layer was dried over Na2SO4, filtered, and concentrated under reduced presuure. Purification via column chromatography (0 → 20% EtOAc/hexanes gradient) afforded 13 as a colorless oil (353 mg, 53% from 11-i). 1H NMR (400 MHz, CDCl3) δ 7.79 (d, J = 8.2 Hz, 2H), 7.35 (d, J = 8.1 Hz, 2H), 5.74 (ddt, J = 16.4, 10.6, 7.0 Hz, 1H), 5.21–5.07 (m, 2H), 4.17–4.03 (m, 2H), 3.50 (dtd, J = 10.1, 6.4, 3.7 Hz, 1H), 2.44 (s, 3H), 2.36–2.22 (m, 2H), 1.88 (dddd, J = 14.7, 8.3, 6.3, 3.7 Hz, 1H), 1.62 (ddt, J = 14.6, 9.6, 4.6 Hz, 1H). 13C NMR (101 MHz, CDCl3) δ 145.13, 132.90, 132.75, 130.02, 127.97, 119.10, 67.08, 58.03, 38.82, 33.23, 21.72. LRMS calcd. for C13H17N3O3S (M + H) 296.09, found 296.4.
6-((3-Azidohex-5-en-1-yl)oxy)-9-(4-methoxy-2-methylphenyl)-3H-xanthen-3-one (13-v)
Synthesized via general synthesis I described above (46.3 mg, 58%). 1H NMR (300 MHz, CDCl3) δ 7.15–6.83 (m, 6H), 6.77 (dd, J = 8.9, 2.5 Hz, 1H), 6.57 (dd, J = 9.7, 1.9 Hz, 1H), 6.44 (d, J = 2.0 Hz, 1H), 5.85 (ddt, J = 17.1, 10.2, 7.0 Hz, 1H), 5.29–5.07 (m, 2H), 4.32–4.11 (m, 2H), 3.89 (s, 3H), 3.79–3.55 (m, 1H), 2.53–2.31 (m, 2H), 2.04 (s, 3H), 1.89 (ddt, J = 14.5, 9.6, 4.9 Hz, 1H). LRMS calcd. for C27H25N3O4 (M + H) 456.18, found 456.2.
6-((3-Aminohex-5-en-1-yl)oxy)-9-(4-methoxy-2-methylphenyl)-3H-xanthen-3-one (14)
Synthesized via general synthesis II described above (7.2 mg, 33%). 1H NMR (400 MHz, MeOD) δ 7.15–6.94 (m, 5H), 6.85–6.70 (m, 2H), 6.60 (dd, J = 9.3, 2.2 Hz, 1H), 6.54 (d, J = 2.2 Hz, 1H), 5.87 (ddt, J = 17.2, 10.0, 7.0 Hz, 1H), 5.21–5.01 (m, 2H), 3.95 (s, 1H), 3.89 (s, 3H), 3.73–3.55 (m, 2H), 2.55–2.28 (m, 2H), 2.02 (d, J = 1.3 Hz, 3H), 1.90 (dddd, J = 14.1, 8.0, 6.1, 4.7 Hz, 1H), 1.76 (ddt, J = 14.0, 8.4, 5.4 Hz, 1H). LRMS calcd. for C27H27NO4 (M + H) 430.19, found 430.2.
3-Azido-3-phenylhex-5-en-1-ol (15-viii)
To an oven-dried 25 mL 2-neck round-bottomed flask was added 4 mL of a 7 M NH3 solution in MeOH. The solution was cooled to 0 °C and 15 (0.53 mg, 2.77 mmol) was added. The reaction was warmed to room temperature and stirred for 30 min. The reaction was again cooled to 0 °C, and then allyl pinacol boronate was added as a solution in CHCl3. The reaction mixture was stirred at room temperature for 12 h. The reaction was concentrated under reduced pressure, then diluted in 0.1 M NaOH, and extracted with Et2O (3×). The combined organic layers were washed with brine, dried over Na2SO4, filtered, and concentrated under reduced pressure to afford a light yellow oil.
The oil was dissolved in 12 mL MeOH and added to a 100 mL round-bottomed flask. Then, CuSO4·5H2O (7 mg, 0.03 mmol) and K2CO3 (0.651 g, 4.71 mmol), followed by Goddard’s diazo transfer reagent (0.7 g, 3.32 mmol) was added. After stirring for 12 h, the reaction was concentrated under reduced pressure, partitioned between EtOAc and 1 M HCl, and extracted with EtOAc (3×). The combined organic layers were washed with 1 M HCl, brine, dried over Na2SO4, and concentrated under reduced pressure. Purification by silica gel chromatography (25% EtOAc/hexanes) afforded a clear oil (0.47 g, 78%). 1H NMR (400 MHz, CDCl3) δ 7.41 (d, J = 4.3 Hz, 4H), 7.32 (h, J = 4.2 Hz, 1H), 5.66 (ddt, J = 17.2, 10.2, 7.1 Hz, 1H), 5.26–5.06 (m, 2H), 3.61 (ddd, J = 11.0, 8.0, 6.2 Hz, 1H), 3.46 (ddd, J = 10.9, 8.0, 5.8 Hz, 1H), 2.81 (t, J = 7.3 Hz, 3H), 2.24 (qdd, J = 14.1, 8.0, 6.0 Hz, 2H).
3-Azido-3-phenylhex-5-en-1-yl 4-methylbenzenesulfonate (16)
To an oven-dried 25 mL 2-neck round-bottomed flask was added 3-azido-3-phenylhex-5-en-1-ol (0.240 g, 1.1 mmol) as a solution in 6 mL CH2Cl2, p-Toluenesulfonyl chloride (0.316 g, 1.6 mmol), DMAP (0.068 g, 0.55 mmol), and NEt3 (0.23 mL, 1.6 mmol). The reaction mixture was stirred for 16 h at room temperature. The reaction mixture was concentrated under reduced pressure, and purification by silica column chromatography (5% EtOAc/hexanes) afforded 16 (0.41 g, quantitative). 1H NMR (400 MHz, CDCl3) δ 7.77–7.70 (m, 2H), 7.47–7.25 (m, 7H), 5.58 (ddt, J = 17.2, 10.2, 7.0 Hz, 1H), 5.20–5.07 (m, 2H), 4.10–3.99 (m, 1H), 3.91–3.80 (m, 1H), 2.74 (d, J = 7.1 Hz, 2H), 2.46 (s, 3H), 2.34 (ddd, J = 8.1, 6.5, 1.6 Hz, 2H). 13C NMR (101 MHz, CDCl3) δ 144.85, 139.84, 132.64, 131.39, 129.82, 128.68, 127.80, 127.68, 125.66, 125.60, 119.74, 67.22, 66.26, 44.46, 44.36, 38.08, 21.57. LRMS calcd. for C19H21N3O3S (M + H) 372.13, found 372.2.
6-((3-Amino-3-phenylhex-5-en-1-yl)oxy)-9-(4-methoxy-2-methylphenyl)-3H-xanthen-3-one (17)
Synthesized via general synthesis I (48 mg, 33%) and II (16.8 mg, 74%) described above. 1H NMR (400 MHz, CDCl3) δ 7.79–7.70 (m, 2H), 7.43–7.23 (m, 7H), 5.58 (ddt, J = 17.2, 10.2, 7.0 Hz, 1H), 5.26–5.04 (m, 2H), 4.16–3.96 (m, 1H), 3.93–3.79 (m, 1H), 2.74 (d, J = 7.1 Hz, 2H), 2.46 (s, 3H), 2.34 (ddd, J = 8.1, 6.5, 1.6 Hz, 2H). LRMS calcd. for C33H31NO4 (M + H) 506.23, found 506.2.
3-Amino-3,4,4-trimethylhex-5-en-1-ol (20)
To an oven-dried 250 mL 2-neck round-bottomed flask equipped with a 100 mL addition funnel was cannulated 60 mL of a 7 M NH3 solution in MeOH. The solution was cooled to 0 °C and the ketone (1.7 mL, 20 mmol) was added. The reaction was warmed to room temperature and stirred for 1 h. The reaction was again cooled to 0 °C, and the previously prepared (3-methylbut-2-en-1-yl)boronic acid was added as a solution in CHCl3. The reaction mixture was stirred at room temperature for 24 h. The reaction was diluted in 1 M HCl (100 mL), washed with EtOAc (3×), basified with NaOH, and extracted with DCM (3×). The combined organic layers were dried over Na2SO4, filtered, and concentrated under reduced pressure to afford a clear oil (2.31 g, 74%). 1H NMR (400 MHz, CDCl3) δ 5.71 (dd, J = 17.5, 10.9 Hz, 1H), 4.91–4.69 (m, 2H), 3.68 (t, J = 12.5 Hz, 1H), 3.45 (d, J = 7.8 Hz, 1H), 2.74 (s, 2H), 1.50 (t, J = 15.0 Hz, 1H), 1.23 (d, J = 17.1 Hz, 1H), 0.89 (s, 3H), 0.77 (s, 6H). 13C NMR (101 MHz, CDCl3) δ 144.29, 113.24, 59.62, 43.79, 40.51, 35.12, 21.64, 20.86, 19.60. LRMS calcd. for C9H19NO (M + H) 158.15, found 158.3.
3-Azido-3,4,4-trimethylhex-5-en-1-ol (20-iii)
To an oven-dried 250 mL 2-neck round-bottomed flask was added CuSO4·5H2O (33.9 mg, 0.136 mmol) and K2CO3 (2.82 g, 20.4 mmol) dissolved in MeOH (130 mL). Then, 20 was added as a solution in 10 mL MeOH, followed by Goddard’s diazo transfer reagent (3.41 g, 16.3 mmol). The resulting teal slurry was stirred at room temperature for 18 h. The solvent was removed under reduced pressure. The residue was partitioned between EtOAc (75 mL) and 1 M HCl (75 mL) and extracted with EtOAc (2 × 100 mL). The combined organic layers were dried over Na2SO4, filtered, and concentrated under reduced pressure. Purification by silica column chromatography (20% EtOAc/hexanes) afforded a colorless liquid (720 mg, 29%). 1H NMR (400 MHz, CDCl3) δ 5.92 (dd, J = 17.4, 10.9 Hz, 1H), 5.12–4.94 (m, 2H), 3.73 (qt, J = 10.7, 6.9 Hz, 2H), 2.69 (s, 1H), 1.85 (dt, J = 14.1, 7.0 Hz, 1H), 1.73–1.55 (dt, 1H), 1.29 (s, 3H), 1.04 (s, 6H). 13C NMR (101 MHz, CDCl3) δ 143.81, 113.80, 67.71, 59.26, 45.53, 37.94, 22.37, 22.22, 17.80. LRMS calcd. for C9H17N3O (M + H) 184.14, found 184.3.
3-Azido-3,4,4-trimethylhex-5-en-1-yl 4-methylbenzenesulfonate (21)
To an oven-dried 100 mL 2-neck round-bottomed flask was added 3-Azido-3,4,4-trimethylhex-5-en-1-ol (700 mg, 3.81 mmol) as a solution in 50 mL CH2Cl2, p-Toluenesulfonyl chloride (1.09 g, 5.72 mmol), DMAP (186 mg, 1.52 mmol), and Et3N (0.79 mL, 5.7 mmol). The reaction mixture was stirred for 16 h at room temperature. The mixture was poured into saturated NH4Cl (60 mL) and extracted with CH2Cl2 (3×). The combined organic layers were dried over Na2SO4, filtered, and concentrated under reduced pressure. Purification by silica column chromatography (5% EtOAc/hexanes) afforded a colorless oil (187 mg, 15%). 1H NMR (400 MHz, CDCl3) δ 7.77 (d, J = 8.1 Hz, 2H), 7.33 (d, J = 8.0 Hz, 2H), 5.84 (dd, J = 17.4, 10.9 Hz, 1H), 5.09–4.90 (m, 2H), 4.20–4.04 (m, 2H), 2.42 (s, 3H), 1.81 (ddt, J = 42.9, 14.5, 6.9 Hz, 2H), 1.23 (s, 3H), 0.99 (s, 6H). 13C NMR (101 MHz, CDCl3) δ 144.95, 143.26, 129.91, 127.87, 114.14, 67.42, 66.78, 45.52, 34.63, 22.23, 22.03, 21.60, 17.72. LRMS calcd. for C16H23N3O3S (M + H) 338.15, found 338.2.
FAP488
Synthesized via general synthesis I (11.8 mg, 24%) and II (6.8 mg, 33%) described above. 1H NMR (400 MHz, MeOD) δ 7.65–7.51 (m, 3H), 7.32 (dd, J = 9.3, 2.3 Hz, 1H), 7.24 (dd, J = 8.4, 1.0 Hz, 1H), 7.21–7.11 (m, 3H), 7.07 (dd, J = 8.5, 2.5 Hz, 1H), 6.07 (dd, J = 17.3, 10.8 Hz, 1H), 5.40–5.25 (m, 2H), 4.56 (t, J = 6.2 Hz, 2H), 3.93 (s, 3H), 2.46–2.26 (m, 2H), 2.04 (s, 3H), 1.47 (s, 3H), 1.23 (s, 6H). LRMS calcd. for C30H33NO4 (M + H) 472.24, found 472.2.
FAP385 Azide
Synthesized via general synthesis I described above (21.3 mg, 61%). 1H NMR (400 MHz, CDCl3) δ 7.62 (d, J = 10.7 Hz, 1H), 6.99–6.85 (m, 2H), 6.62 (s, 1H), 5.98 (dd, J = 17.4, 10.9 Hz, 1H), 5.19–5.02 (m, 2H), 4.18 (t, J = 6.8 Hz, 2H), 2.23–1.84 (m, 2H), 1.40 (s, 3H), 1.11 (s, 6H).
FAP385
Synthesized via general synthesis II described above (20.2 mg, 99%). 1H NMR (400 MHz, CDCl3) δ 7.66–7.56 (m, 1H), 6.97–6.86 (m, 2H), 6.60 (s, 1H), 5.99 (dd, J = 17.5, 10.9 Hz, 1H), 5.19–4.98 (m, 2H), 4.37–4.15 (m, 2H), 2.08–1.82 (m, 2H), 1.42 (s, 2H), 1.10 (s, 3H), 1.06 (s, 6H). HRMS calcd. for C19H22F3NO3 (M + H) 370.1552, found 370.1621.
FAP498 Azide
Synthesized via general synthesis I described above (50.1 mg, 99%). 1H NMR (400 MHz, CDCl3) δ 7.37 (d, J = 5.5 Hz, 1H), 6.95–6.75 (m, 1H), 6.71 (d, J = 2.5 Hz, 0H), 6.59 (dd, J = 8.9, 2.5 Hz, 0H), 6.52–6.46 (m, 0H), 6.38 (d, J = 8.6 Hz, 0H), 5.85 (ddt, J = 16.1, 10.9, 7.3 Hz, 0H), 5.27 (s, 1H), 5.23–5.13 (m, 1H), 4.11 (t, J = 6.6 Hz, 1H), 3.85–3.71 (m, 1H), 3.54–3.44 (m, 3H), 2.37 (d, J = 7.3 Hz, 1H), 2.09–1.93 (m, 1H), 1.36 (s, 1H), 1.22 (t, J = 7.0 Hz, 4H).
FAP498
Synthesized via general synthesis II described above (20.6 mg, 46%).1H NMR (400 MHz, CDCl3) δ 7.52 (d, J = 13.4 Hz, 2H), 7.40 (d, J = 7.2 Hz, 1H), 7.03 (d, J = 7.3 Hz, 1H), 6.93 (s, 1H), 6.82 (s, 1H), 5.91 (dd, J = 17.3, 10.8 Hz, 1H), 5.35–5.14 (m, 2H), 4.54 (s, 1H), 4.35 (d, J = 20.0 Hz, 2H), 3.96 (s, 2H), 3.62 (s, 1H), 3.44 (s, 7H), 2.07 (dt, J = 14.8, 5.6 Hz, 1H), 1.36 (s, 3H), 1.15 (s, 6H). HRMS calcd. for C31H33F3N2O3 (M + H) 539.2443, found 539.2512.
7-Hydroxy-9,9-dimethyl-10-(2-(trifluoromethyl)phenyl)anthracen-2(9H)-one
To a solution of 1-bromo-2-(trifluoromethyl)benzene in 1 mL anhydrous THF was added tBuLi (0.24 mL, 1.7 M) dropwise at −78 °C and stirred for 1 h at that temperature. 3,6-bis((tert-butyldimethylsilyl)oxy)-10,10-dimethylanthracen-9(10H)-one (50 mg, 0.104 mmol) as a solution in 4 mL THF was added dropwise at −78 °C and the reaction was warmed to room temperature and stirred for 3 h. The reaction was quenched with 10 mL 1 M HCl, stirred for 20 more minutes, and then 25 mL hexanes was added to form dark red crystals (76 mg, 52%). LRMS calcd. for C23H17F3O2 (M + H) 383.38, found 383.4.
FAP555 Azide
Synthesized via general synthesis I described above (10 mg, 18%). 1H NMR (500 MHz, Chloroform-d) δ 7.88 (q, J = 7.3 Hz, 1H), 7.69 (dt, J = 24.5, 7.8 Hz, 2H), 7.28 (s, 3H), 7.19 (dd, J = 6.6, 4.2 Hz, 1H), 6.86–6.59 (m, 4H), 6.31 (d, J = 9.7 Hz, 1H), 5.99 (dd, J = 17.4, 11.0 Hz, 1H), 5.12 (dt, J = 28.4, 11.9 Hz, 2H), 4.37–4.15 (m, 2H), 1.74 (d, J = 13.1 Hz, 3H), 1.58 (s, 3H), 1.27 (s, 3H), 1.15–1.06 (m, 6H).
FAP555
Synthesized via general synthesis II described above (4.4 mg, 46%). 1H NMR (500 MHz, Chloroform-d) δ 7.88 (q, J = 7.3 Hz, 1H), 7.69 (dt, J = 24.5, 7.8 Hz, 2H), 7.28 (s, 3H), 7.19 (dd, J = 6.6, 4.2 Hz, 1H), 6.86–6.59 (m, 4H), 6.31 (d, J = 9.7 Hz, 1H), 5.99 (dd, J = 17.4, 11.0 Hz, 1H), 5.12 (dt, J = 28.4, 11.9 Hz, 2H), 4.37–4.15 (m, 2H), 2.12–1.89 (m, 2H), 1.74 (d, J = 13.1 Hz, 3H), 1.58 (s, 3H), 1.27 (s, 3H), 1.15–1.06 (m, 6H). HRMS calcd. for C32H34F3NO2 (M + H) 522.2541, found 522.2618.
FAP573 Azide
Synthesized via general synthesis I described above (7.0 mg, 20%). 1H NMR (400 MHz, CDCl3) δ 7.72 (d, J = 8.9 Hz, 1H), 7.44 (d, J = 9.8 Hz, 1H), 6.95 (d, J = 8.9 Hz, 1H), 6.84 (d, J = 1.6 Hz, 2H), 6.36 (s, 1H), 5.99 (dd, J = 17.5, 10.9 Hz, 1H), 5.21–5.03 (m, 2H), 4.21 (t, J = 6.8 Hz, 2H), 2.22–1.93 (m, 3H), 1.41 (s, 3H), 1.25 (s, 4H), 1.12 (s, 5H).
FAP573
Synthesized via general synthesis II described above (1.3 mg, 11%). 1H NMR (400 MHz, CDCl3) δ 7.69 (d, J = 8.4 Hz, 1H), 7.41 (d, J = 9.8 Hz, 1H), 6.98 (d, J = 10.2 Hz, 1H), 6.88 (s, 1H), 6.82 (d, J = 11.3 Hz, 1H), 6.31 (s, 1H), 5.92 (dd, J = 17.3, 10.8 Hz, 1H), 5.34–5.18 (m, 2H), 4.29 (s, 2H), 3.36 (s, 1H), 2.34–2.24 (m, 1H), 2.10 (d, J = 8.6 Hz, 1H), 1.38 (s, 3H), 1.17 (s, 5H). HRMS calcd. for C21H24N2O3 (M + H) 353.1787, found 353.1858.
Spectroscopic Materials and Methods
All spectroscopic measurements were performed in 20 mM PBS, pH 7.4. Fluorescence spectra were recorded using a Photon Technology International Quanta Master 4 L-format scan spectrofluorometer equipped with an LPS- 220B 75-W xenon lamp and power supply, A-1010B lamp housing with integrated igniter, switchable 814 photocounting/analog photomultiplier detection unit, and MD5020 motor driver. Samples were contained in 1 cm × 1 cm quartz cuvettes during measurement (1.4 mL volume, Starna).
Quantum Yield Determination
All absorbance spectra were measured with an absorbance below 0.1. Quantum yield for each fluorophore was determined using the equation (ϕ = quantum yield, y = emission intensity versus absorbance, and η = refractive index):
FAP385 quantum yield was determined using harmaline in 0.005 M H2SO4 (ϕ = 0.32) as a reference according to published procedures.66FAP498 quantum yield was determined using fluorescein in 0.1 M NaOH (ϕ = 0.91) as a reference according to published procedures.67FAP555 and FAP573 quantum yield was determined using rhodamine 6G in ethanol (ϕ = 0.94) as a reference according to published procedures.68
Cell Culture Procedures
HEK293T cells were maintained in exponential growth as a monolayer in Dulbecco’s Modified Eagle Medium, high glucose, (DMEM, Invitrogen) supplemented with glutamax (Gibco), 10% fetal bovine serum (FBS, Hyclone) and 1% nonessential amino acids (NEAA, Gibco), and incubated at 37 °C in 5% CO2. One day before imaging, the cells were passaged and plated in DMEM with glutamax (phenol red-free) supplemented with 10% FBS on poly d-lysine-coated 4-well Lab Tek borosilicate chambered coverglass slides (Nunc) at 1.8 × 10⁵ per well.
ADH5 knockout HAP1 and genetically matched WT HAP1 cells were maintained in exponential growth as a monolayer in Iscove’s Modified Dulbecco’s Medium, high glucose, (IMDM, Invitrogen) supplemented with 10% FBS and incubated at 37 °C in 5% CO2. One day before imaging, the cells were passaged and plated in DMEM with glutamax (phenol red-free) supplemented with 10% FBS on poly d-lysine-coated 4-well Lab Tek borosilicate chambered coverglass slides at 75% confluence.
ADH5 knockout MEF and genetically matched WT MEF cells were maintained in exponential growth as a monolayer in DMEM supplemented with 10% FBS and incubated at 37 °C in 5% CO2. One day before imaging, the cells were passaged and plated in DMEM with glutamax (phenol red-free) supplemented with 10% FBS on poly d-lysine-coated 4-well Lab Tek borosilicate chambered coverglass slides at 75% confluence.
Confocal Fluorescence Imaging Experiments
Confocal fluorescence imaging studies were performed with a Zeiss laser scanning microscope 710 with a 20× objective lens using Zen 2009 software (Carl Zeiss). FAP573 was excited using a 561 diode (for experiments in Figure 8) or 594 nm HeNe laser (for all other experiments with FAP573), and emission was collected using a META detector between 573 to 682 nm. The 561 nm laser was utilized on a Zeiss laser scanning microscope 710 located in the Molecular Imaging Center at UC Berkeley. FAP555 was excited using a 543 nm HeNe laser, and emission was collected using a META detector between 560 to 669 nm. FAP498 was excited using a 488 nm HeNe laser, and emission was collected using a META detector between 493 to 630 nm. FAP385 was excited with a 405 nm diode laser, and emission was collected using a META detector between 450 and 540 nm. Hoechst 33342 was excited with a 405 nm diode laser, and emission was collected using a META detector between 400 and 450 nm. BSS (136.9 mM NaCl, 5.37 mM KCl, 1.26 mM CaCl2, 0.81 mM MgSO4, 0.44 mM KH2PO4, 0.335 mM Na2HPO4, 10 mM PIPES; pH to 7.2 with NaOH) was used as the imaging buffer for all confocal experiments. The cells were imaged at 37 °C throughout the course of the experiment. Image analysis and quantification was performed using ImageJ (National Institutes of Health). Quantification of fluorescence intensity was performed using three fields of cells in the same well by generating a region of interest (ROI) around each image. The mean fluorescence intensity of each cell was measured (using “Measure” function) and averaged across the three ROIs. For each condition, multiple wells (reported as n) were analyzed using this process, and the values were averaged across independent experiments for statistical analysis. Statistical analyses for multiple comparisons were performed using one-way ANOVA with the Bonferroni correction in the statistical analysis software, R.
Acknowledgments
K.J.B. was partially supported by an NSF graduate fellowship. T.F.B. was partially supported by a Chemical Biology Training Grant from the NIH (T32 GM066698). C.J.C. is an Investigator of the Howard Hughes Medical Institute. We thank Alison Killilea and Carissa Tasto (UC Berkeley Tissue Culture Facility) for expert technical assistance.
Supporting Information Available
The Supporting Information is available free of charge on the ACS Publications website at DOI: 10.1021/jacs.6b12460.
Experimental details including additional selectivity assays, disruption of ADH5 in HAP1 cells, flow cytometry conditions and experiments, in vitro fluorescence response data of 6, 9, 10, 14, 17, and FAP488, limit of detection, kinetics, cell viability, and NMR spectra (PDF)
Author Present Address
# Department of Chemistry, Ursinus College, 601 E. Main Street, Collegeville, Pennsylvania 19426, United States.
Author Contributions
∇ K.J.B. and R.R.W. contributed equally to this work and are listed in alphabetical order.
The authors declare no competing financial interest.
Supplementary Material
References
- Salthammer T.; Mentese S.; Marutzky R. Chem. Rev. 2010, 110, 2536–2572. 10.1021/cr800399g. [DOI] [PMC free article] [PubMed] [Google Scholar]
- Puchtler H.; Meloan S. N. Histochemistry 1985, 82, 201–204. 10.1007/BF00501395. [DOI] [PubMed] [Google Scholar]
- Liteplo R. G.; Beauchamp R.; Meek M. E.; Chenier R.. Formaldehyde (Concise International Chemical Assessment Documents); World Health Organization: Geneva, 2002. [Google Scholar]
- Tang X.; Bai Y.; Duong A.; Smith M. T.; Li L.; Zhang L. Environ. Int. 2009, 35, 1210–1224. 10.1016/j.envint.2009.06.002. [DOI] [PubMed] [Google Scholar]
- He R. Q.; Lu J.; Miao J. Y. Sci. China: Life Sci. 2010, 53, 1399–1404. 10.1007/s11427-010-4112-3. [DOI] [PubMed] [Google Scholar]
- Shi Y.; Lan F.; Matson C.; Mulligan P.; Whetstine J. R.; Cole P. A.; Casero R. A.; Shi Y. Cell 2004, 119, 941–953. 10.1016/j.cell.2004.12.012. [DOI] [PubMed] [Google Scholar]
- Walport L.; Hopkinson R.; Chowdhury R.; Schiller R.; Ge W.; Kawamura A.; Schofield C. Nat. Commun. 2016, 7, 11974. 10.1038/ncomms11974. [DOI] [PMC free article] [PubMed] [Google Scholar]
- Hou H.; Yu H. Curr. Opin. Struct. Biol. 2010, 20, 739–748. 10.1016/j.sbi.2010.09.006. [DOI] [PMC free article] [PubMed] [Google Scholar]
- Walport L. J.; Hopkinson R. J.; Schofield C. J. Curr. Opin. Chem. Biol. 2012, 16, 525–534. 10.1016/j.cbpa.2012.09.015. [DOI] [PubMed] [Google Scholar]
- Tibbetts A. S.; Appling D. R. Annu. Rev. Nutr. 2010, 30, 57–81. 10.1146/annurev.nutr.012809.104810. [DOI] [PubMed] [Google Scholar]
- Heck H. d. A.; Casanova-Schmitz M.; Dodd P. B.; Schachter E. N.; Witek T. J.; Tosun T. AIHA J. 1985, 46, 1–3. 10.1080/15298668591394275. [DOI] [PubMed] [Google Scholar]
- Tong Z.; Han C.; Luo W.; Wang X.; Li H.; Luo H.; Zhou J.; Qi J.; He R. Age 2013, 35, 583–596. 10.1007/s11357-012-9388-8. [DOI] [PMC free article] [PubMed] [Google Scholar]
- Tulpule K.; Dringen R. J. Neurochem. 2013, 127, 7–21. 10.1111/jnc.12356. [DOI] [PubMed] [Google Scholar]
- Bosetti C.; McLaughlin J. K.; Tarone R. E.; Pira E.; La Vecchia C. Ann. Oncol. 2008, 19, 29–43. 10.1093/annonc/mdm202. [DOI] [PubMed] [Google Scholar]
- Thompson C. M.; Ceder R.; Grafström R. C. Toxicol. Lett. 2010, 193, 1–3. 10.1016/j.toxlet.2009.11.023. [DOI] [PubMed] [Google Scholar]
- Staab C. A.; Hellgren M.; Höög J. O. Cell. Mol. Life Sci. 2008, 65 (24), 3950–3960. 10.1007/s00018-008-8592-2. [DOI] [PMC free article] [PubMed] [Google Scholar]
- Takeuchi A.; Takigawa T.; Abe M.; Kawai T.; Endo Y.; Yasugi T.; Endo G.; Ogino K. Bull. Environ. Contam. Toxicol. 2007, 79, 1–4. 10.1007/s00128-007-9172-0. [DOI] [PubMed] [Google Scholar]
- Li Q.; Sritharathikhun P.; Motomizu S. Anal. Sci. 2007, 23, 413–417. 10.2116/analsci.23.413. [DOI] [PubMed] [Google Scholar]
- Yu P. H.; Cauglin C.; Wempe K. L.; Gubisne-Haberle D. Anal. Biochem. 2003, 318, 285–290. 10.1016/S0003-2697(03)00211-2. [DOI] [PubMed] [Google Scholar]
- Luo W. H.; Li H.; Zhang Y.; Ang C. Y. W. J. Chromatogr., Biomed. Appl. 2001, 753, 253–257. 10.1016/S0378-4347(00)00552-1. [DOI] [PubMed] [Google Scholar]
- Kato S.; Burke P. J.; Koch T. H.; Bierbaum V. M. Anal. Chem. 2001, 73, 2992–2997. 10.1021/ac001498q. [DOI] [PubMed] [Google Scholar]
- Chan J.; Dodani S. C.; Chang C. J. Nat. Chem. 2012, 4, 973–984. 10.1038/nchem.1500. [DOI] [PMC free article] [PubMed] [Google Scholar]
- Lee M. H.; Kim J. S.; Sessler J. L. Chem. Soc. Rev. 2015, 44, 4185–4191. 10.1039/C4CS00280F. [DOI] [PMC free article] [PubMed] [Google Scholar]
- Chen X.; Tian X.; Shin I.; Yoon J. Chem. Soc. Rev. 2011, 40, 4783–4804. 10.1039/c1cs15037e. [DOI] [PubMed] [Google Scholar]
- Yang Y.; Zhao Q.; Feng W.; Li F. Chem. Rev. 2013, 113, 192–270. 10.1021/cr2004103. [DOI] [PubMed] [Google Scholar]
- Wang J.; Karpus J.; Zhao B. S.; Luo Z.; Chen P. R.; He C. Angew. Chem. 2012, 124, 9790–9794. 10.1002/ange.201203684. [DOI] [Google Scholar]
- Michel B. W.; Lippert A. R.; Chang C. J. J. Am. Chem. Soc. 2012, 134, 15668. 10.1021/ja307017b. [DOI] [PubMed] [Google Scholar]
- Zheng K.; Lin W.; Tan L.; Chen H.; Cui H. Chem. Sci. 2014, 5, 3439–3448. 10.1039/C4SC00283K. [DOI] [Google Scholar]
- Chaves-Ferreira M.; Albuquerque I. S.; Matak-Vinkovic D.; Coelho A. C.; Carvalho S. M.; Saraiva L. M.; Romao C. C.; Bernardes G. J. L. Angew. Chem., Int. Ed. 2015, 54, 1172–1175. 10.1002/anie.201409344. [DOI] [PMC free article] [PubMed] [Google Scholar]
- Wilson J. L.; Fayad Kobeissi S.; Oudir S.; Haas B.; Michel B.; Dubois Rande J.-L.; Ollivier A.; Martens T.; Rivard M.; Motterlini R.; Foresti R. Chem. - Eur. J. 2014, 20, 14698–14704. 10.1002/chem.201403901. [DOI] [PubMed] [Google Scholar]
- Wang T.; Douglass E. F.; Fitzgerald K. J.; Spiegel D. A. J. Am. Chem. Soc. 2013, 135, 12429–12433. 10.1021/ja406077j. [DOI] [PubMed] [Google Scholar]
- Brewer T. F.; Chang C. J. J. Am. Chem. Soc. 2015, 137, 10886–10889. 10.1021/jacs.5b05340. [DOI] [PubMed] [Google Scholar]
- Liu W.; Truillet C.; Flavell R. R.; Brewer T. F.; Evans M. J.; Wilson D. M.; Chang C. J. Chem. Sci. 2016, 7, 5503–5507. 10.1039/C6SC01503D. [DOI] [PMC free article] [PubMed] [Google Scholar]
- Roth A.; Li H.; Anorma C.; Chan J. J. Am. Chem. Soc. 2015, 137, 10890–10893. 10.1021/jacs.5b05339. [DOI] [PubMed] [Google Scholar]
- Tang Y.; Kong X.; Xu A.; Dong B.; Lin W. Angew. Chem., Int. Ed. 2016, 55, 3356–3359. 10.1002/anie.201510373. [DOI] [PubMed] [Google Scholar]
- Xu J.; Zhang Y.; Zeng L.; Liu J.; Kinsella J. M.; Sheng R. Talanta 2016, 160, 645–652. 10.1016/j.talanta.2016.08.010. [DOI] [PubMed] [Google Scholar]
- Xie Z.; Ge J.; Zhang H.; Bai T.; He S.; Ling J.; Sun H.; Zhu Q. Sens. Actuators, B 2017, 241, 1050–1056. 10.1016/j.snb.2016.10.039. [DOI] [Google Scholar]
- Li J.-B.; Wang Q.-Q.; Yuan L.; Wu Y.-X.; Hu X.-X.; Zhang X.-B.; Tan W. Analyst 2016, 141, 3395–3402. 10.1039/C6AN00473C. [DOI] [PubMed] [Google Scholar]
- He L.; Xueling Y.; Liu Y.; Kong X.; Lin W. Chem. Commun. 2016, 52, 4029–4032. 10.1039/C5CC09796G. [DOI] [PubMed] [Google Scholar]
- Lee Y. H.; Tang Y.; Verwilst P.; Lin W.; Kim J. S. Chem. Commun. 2016, 52, 11247–11250. 10.1039/C6CC06158C. [DOI] [PubMed] [Google Scholar]
- He L.; Yang X.; Ren M.; Kong X.; Liu Y.; Lin W. Chem. Commun. 2016, 52, 9582–9585. 10.1039/C6CC04254F. [DOI] [PubMed] [Google Scholar]
- Tang Y.; Kong X.; Liu Z.; Xu A.; Lin W. Anal. Chem. 2016, 88, 9359–9363. 10.1021/acs.analchem.6b02879. [DOI] [PubMed] [Google Scholar]
- Liu C.; Jiao X.; He S.; Zhao L.; Zeng X. Dyes Pigm. 2017, 138, 23–29. 10.1016/j.dyepig.2016.11.020. [DOI] [Google Scholar]
- Urano Y.; Kamiya M.; Kanda K.; Ueno T.; Hirose K.; Nagano T. J. Am. Chem. Soc. 2005, 127, 4888–4894. 10.1021/ja043919h. [DOI] [PubMed] [Google Scholar]
- Kim D.; Sambasivan S.; Nam H.; Kim K. H.; Kim J. Y.; Joo T.; Lee K.-H.; Kim K.-T.; Ahn K. H. Chem. Commun. 2012, 48, 6833–6835. 10.1039/c2cc32424e. [DOI] [PubMed] [Google Scholar]
- Aw J.; Shao Q.; Yang Y.; Jiang T.; Ang C.; Xing B. Chem. - Asian J. 2010, 5, 1317–1321. 10.1002/asia.201000025. [DOI] [PubMed] [Google Scholar]
- Bedia C.; Camacho L.; Casas J.; Abad J. L.; Delgado A.; Van Veldhoven P. P.; Fabriàs G. ChemBioChem 2009, 10, 820–822. 10.1002/cbic.200800809. [DOI] [PubMed] [Google Scholar]
- Zhou W.; Valley M. P.; Shultz J.; Hawkins E. M.; Bernad L.; Good T.; Good D.; Riss T. L.; Klaubert D. H.; Wood K. V. J. Am. Chem. Soc. 2006, 128, 3122–3123. 10.1021/ja058519o. [DOI] [PubMed] [Google Scholar]
- Goddard-Borger E. D.; Stick R. V. Org. Lett. 2007, 9, 3797–3800. 10.1021/ol701581g. [DOI] [PubMed] [Google Scholar]
- Miller E. W.; Tulyathan O.; Isacoff E. Y.; Chang C. J. Nat. Chem. Biol. 2007, 3, 263–267. 10.1038/nchembio871. [DOI] [PubMed] [Google Scholar]
- Lavis L. D.; Chao T.-Y.; Raines R. T. Chem. Sci. 2011, 2, 521. 10.1039/C0SC00466A. [DOI] [PMC free article] [PubMed] [Google Scholar]
- Au-Yeung H. Y.; New E. J.; Chang C. J. Chem. Commun. 2012, 48, 5268–5270. 10.1039/c2cc31681a. [DOI] [PubMed] [Google Scholar]
- Kamiya M.; Urano Y.; Ebata N.; Yamamoto M.; Kosuge J.; Nagano T. Angew. Chem., Int. Ed. 2005, 44, 5439. 10.1002/anie.200501542. [DOI] [PubMed] [Google Scholar]
- Kobayashi T.; Urano Y.; Kamiya M.; Ueno T.; Kojima H.; Nagano T. J. Am. Chem. Soc. 2007, 129, 6696. 10.1021/ja070376d. [DOI] [PubMed] [Google Scholar]
- Kamiya M.; Kobayashi H.; Hama Y.; Koyama Y.; Bernardo M.; Nagano T.; Choyke P. L.; Urano Y. J. Am. Chem. Soc. 2007, 129, 3918–3929. 10.1021/ja067710a. [DOI] [PMC free article] [PubMed] [Google Scholar]
- Bartra M.; Romea P.; Urpí F.; Vilarrasa J. Tetrahedron 1990, 46, 587–594. 10.1016/S0040-4020(01)85439-9. [DOI] [Google Scholar]
- Alam R.; Raducan M.; Eriksson L.; Szabó K. J. Org. Lett. 2013, 15, 2546–2549. 10.1021/ol401055m. [DOI] [PubMed] [Google Scholar]
- Jung M. E.; Piizzi G. Chem. Rev. 2005, 105, 1735–1766. 10.1021/cr940337h. [DOI] [PubMed] [Google Scholar]
- Grimm J. B.; Sung A. J.; Legant W. R.; Hulamm P.; Matlosz S. M.; Betzig E.; Lavis L. D. ACS Chem. Biol. 2013, 8, 1303–1310. 10.1021/cb4000822. [DOI] [PMC free article] [PubMed] [Google Scholar]
- Kalapos M. P. Diabetes Res. Clin. Pract. 2013, 99, 260–271. 10.1016/j.diabres.2012.11.003. [DOI] [PubMed] [Google Scholar]
- Pontel L. B.; Rosado I. V.; Burgos-Barragan G.; Garaycoechea J. I.; Yu R.; Arends M. J.; Chandrasekaran G.; Broecker V.; Wei W.; Liu L.; Swenberg J. A.; Crossan G. P.; Patel K. J. Mol. Cell 2015, 60, 177–188. 10.1016/j.molcel.2015.08.020. [DOI] [PMC free article] [PubMed] [Google Scholar]
- Lippert A. R.; Van De Bittner G. C.; Chang C. J. Acc. Chem. Res. 2011, 44, 793–804. 10.1021/ar200126t. [DOI] [PMC free article] [PubMed] [Google Scholar]
- Brewer T. F.; Garcia F. J.; Onak C. S.; Carroll K. S.; Chang C. J. Annu. Rev. Biochem. 2015, 84, 765–790. 10.1146/annurev-biochem-060614-034018. [DOI] [PMC free article] [PubMed] [Google Scholar]
- Raducan M.; Alam R.; Szabó K. J. Angew. Chem., Int. Ed. 2012, 51, 13050–13053. 10.1002/anie.201207951. [DOI] [PMC free article] [PubMed] [Google Scholar]
- Matsuzaki H.; Kamiya M.; Iwatate R. J.; Asanuma D.; Watanabe T.; Urano Y. Bioconjugate Chem. 2016, 27, 973–981. 10.1021/acs.bioconjchem.6b00037. [DOI] [PubMed] [Google Scholar]
- Pardo A.; Reyman D.; Poyato J. M. L.; Medina F. J. Lumin. 1992, 51, 269. 10.1016/0022-2313(92)90077-M. [DOI] [Google Scholar]
- Porrès L.; Holland A.; Palsson L. O.; Monkman A. P.; Kemp C.; Beeby A. J. Fluoresc. 2006, 16, 267. 10.1007/s10895-005-0054-8. [DOI] [PubMed] [Google Scholar]
- Fischer M.; Georges J. Chem. Phys. Lett. 1996, 260, 115. 10.1016/0009-2614(96)00838-X. [DOI] [Google Scholar]
Associated Data
This section collects any data citations, data availability statements, or supplementary materials included in this article.