

Abstract
Purpose
Numerous studies have examined the association of physical, behavioral and social factors with cognitive decline in older adults. Less attention has been placed on factors associated with long-term maintenance of intact cognition even into very old age. A greater understanding of those factors can inform the development of activities for maintaining cognitive strength.
Methods
Using a sample from the Hispanic Established Populations for Epidemiologic Study of the Elderly, a population-based study of non-institutionalized Mexican Americans aged 65 and older from five Southwestern states (N = 2767), latent class mixture models were developed to identify subgroups of cognitive change over time.
Results
Three distinct trajectories of cognitive change were identified and characterized as stable, slow decline and rapid decline. Compared to the rapid decline group, a higher proportion of the stable cognition group were women, had high school education, were married and attended church one or more times per week. Regular church attendance had a significant positive impact in the stable group (β = 0.64, p <0.01), the slow decline group (β = 0.84, p <0.001) and the rapid decline group (β = 2.50, p <0.001). Activity limitations had a consistently negative association with cognition in the stable, slow decline and rapid decline groups (β = −0.37, p <0.001; β = −0.85, p <0.001; and β = −1.58, p <0.001 respectively).
Conclusion
Substantial heterogeneity exists in rates of cognitive decline among older Mexican Americans. Interventions targeting cognitive maintenance may benefit from increased focus on factors associated with continued social engagement.
Keywords: Aging, cognition, cognitive change, hispanic, resilience, social support, trajectory
INTRODUCTION
Poor cognition and dementia are major causes of disability and premature deaths. In the general population the estimated prevalence of cognitive impairment increases substantially at older ages [1]. Data from the Health and Retirement Study in 2002 suggest that 22% of adults 71 years or older have some degree of cognitive impairment [2]. Compared to non-Hispanic Whites, rates of cognitive impairment are proportionally higher in minority populations [3–9]. Higher rates of cognitive impairment at older ages among Hispanics is of particular importance as Hispanics represent the largest and fastest growing minority group in the United States [10].
Many studies have examined socio-demographic and physical function and health predictors of cognitive decline. For example, cardiovascular disease, stroke, metabolic syndrome and diabetes are strongly associated with declines in cognitive function [11–15]. On the other hand, higher levels of educational attainment [1, 16–20] and socioeconomic status [21–23] have been consistently associated with reduced risk and severity of cognitive impairment. However, the association of education with the rate of decline has been questioned [24, 25], and a 14-year longitudinal study of 6,000 older African-Americans and Whites showed association of higher educational attainment with higher baseline cognitive scores but not with rate of cognitive decline [26]. Regular physical activity and other modifiable risk factors have also been associated with reductions in maintenance of cognitive function [18, 27, 28].
However, little emphasis has been placed on understanding factors associated with long-term maintenance of intact cognition even into very old age. Such understanding can inform the development of activities to enhance cognitive resilience. Social networks and social support, lifestyle, and emotional factors have been linked to successful aging, partly via a moderating influence on how individuals manage their vascular risk factors, vis a vis access to care, understanding treatment recommendations, and adherence. In fact, research has found that individuals with more numerous social ties, participation in activities, and emotional support have reduced risk of cognitive impairment [29–34].
Two major challenges in studying predictors of cognitive resilience and long-term good cognition are lack of longitudinal data with repeated measures of cognition and relevant predictors as well as limited data on under-represented minorities. The availability of Hispanic Established Population for the Epidemiological Study of the Elderly (HEPESE), an ongoing 20-year study of older Hispanics, allows us to address some of these challenges with the use of latent class models. These models permit us to identify different subgroups (or classes) of patients with distinct trajectories of cognitive change over time, while at the same time accounting for the unavoidable missing data (e.g. due to death) common to such long-term study. In this research, we describe the psychosocial, health and lifestyle factors associated with maintenance of good cognition in Mexican-origin elders. Our two main hypotheses are: 1) there will be distinct trajectories of cognitive function among older Mexican-origin adults, and 2) the effects of both psychosocial and physical health factors on cognition will vary by trajectory membership.
MATERIALS AND METHODS
Sample
The sample includes participants in the Hispanic Established Populations for Epidemiologic Study of the Elderly (H-EPESE). The H-EPESE is a population-based study of 3,050 non-institutionalized Mexican Americans aged 65 and older at baseline (1993–94) from five Southwestern states (Texas, California, New Mexico, Colorado, and Arizona). Seven waves of data have been collected (1993–94 n = 3,050; 1995–96 n = 2,438; 1998–99 n = 1,981; 2000–01 n = 1,682; 2004–05 n = 1,167; 2007 n = 921; 2010–2011 n = 659). Details regarding the methods have been described elsewhere [35, 36]. Our sample includes all respondents who had complete data for included variables at baseline (N=2767). All research protocols and informed consents were approved by the Institutional Review Board of the University of Texas Medical Branch.
Dependent Variable
Cognitive function was measured using the Mini Mental State Examination (MMSE) [37] during each interview. The MMSE measures responses to a standard battery of memory and reasoning problems that include orientation, attention, short term recall, language and the ability to follow simple instructions. The Spanish version of the MMSE has been used in prior studies of older Hispanics [15, 31, 38–40]. While the MMSE is often dichotomized to reflect impairment levels, we used the MMSE as a continuous scale in order to assess the relative impact of covariates on change over time.
We included major diseases shown to be associated with cognitive decline [11–15]. Hypertension, heart attack, stroke and diabetes were ascertained by asking the respondents (1) “Has a doctor ever told you that you had…” during the baseline interview and (2) “Since we last spoke … told by a doctor that you…” during follow-up. Answers were coded as yes or no. in addition, we included weight category base on body mass index (BMI) [41]: overweight (BMI>=25 and BMI<30), and obese (BMI>=30) compared to normal weight or less (BMI<25). Finally, as a measure of disability we included the total number of Activity of Daily Living limitations (ADLs – e.g., needing help walking, transferring from a bed to a chair, feeding oneself).
Psychosocial Factors
Three psychosocial measures are included. First, we included depressed mood because it is associated with cognitive function [42, 43], and factors often accompanying depression, such as flat affect and disrupted motivation patterns, may affect results of cognitive tests [44, 45]. Depressive symptoms were assessed through the Center for Epidemiologic Studies Depression Scale (CES-D) [46]. This scale ranges from 0–60, with higher scores reflecting greater depressive symptoms. For the current analysis, a cut point of 16 was used to denote probable depression [47]. As a second psychosocial measure, we included weekly church attendance. Research shows that older Mexican origin adults who are infrequent attenders show more cognitive impairment over time [48]. Respondents were asked “About how often do you go to mass?” and were coded 1 if the response indicated one or more times per week. Finally, far less research exists on social support, though one study showed that social support was related to better cognition among adults with Alzheimer’s Disease [49]. In this study, social support was assessed through two questions: (1) “…can you count on at least some of your family…” and (2) “…talk about your deepest problems with at least some of your family or friends.” If the respondent answered “most of the time” to both questions then the variable was coded as 1.
Other Covariates
Covariates included age (continuous), gender (female versus male), marital status (currently married vs. not), language of interview (Spanish vs. English), and nativity (US born vs. foreign born). Financial strain was assessed through the respondent’s reporting a “great deal” of difficulty meeting monthly payments and coded yes or no. Near vision was coded as adequate vs impaired. We tested the inclusion of education as a continuous measure, as well as categorized as none, low (1–4 years), moderate (5–11 years) and high (12 or more years). Results indicated that the primary difference across attainment levels occurred at the 12 year point. Thus, we included high school education as a single measure of attainment.
Statistical Analyses
Initial demographic characteristics were examined in total and by gender. Next, trajectories of cognition over time were developed using latent class mixture models [50–53]. With this approach, the population under study is viewed as a mixture within which a finite number of subgroups (latent classes) can be identified possessing distinct trajectory shapes. Each trajectory is then modeled with its own functional form (e.g., linear, quadratic) and direction simultaneously [54–57]. These models were developed using the user-written Stata procedure for trajectory modeling [53] based on semi-parametric, finite mixture modeling using maximum likelihood. The MMSE score was modeled as a censored normal distribution.
Model selection was determined by comparison of Bayesian information criterion (BIC) between models. A 2× change in BIC approximates the log of the Bayes factor [58] and allowed for the comparison of both the number of trajectory groups and the functional form of each trajectory. We compared models with 1 to 5 trajectories and tested the significance of the functional form the trajectories. Model adequacy was further assessed by examination of the posterior probability of group membership with 70% being acceptable. This approach identified models with three trajectories (one cubic and two linear).
Baseline measures of age, female gender, language of interview, nativity, education, diabetes, over weight and obese (compared to normal or low weight), and hypertension were incorporated into the models as risk factors for trajectory group membership. Acute health events and social factors that have time dependent effects (heart attack, stroke, marital status, financial strain, depressive symptoms, ADLs, church attendance and social support) were incorporated into the analyses as time-varying covariates and contribute directly to the estimate of the MMSE trajectories.
Participant attrition is a particular concern in examining panel data, especially data spanning 18 or more years. Data that are missing at random or missing completely at random are generally tolerated well by most common statistical approaches. Our modeling approach uses maximum likelihood which uses each case available to compute maximum likelihood estimates and produces unbiased parameter estimates for data missing at random. Thus, the basic trajectory model assumes that intermittent missing data are missing at random. Because trajectory group membership may not be independent of attrition (e.g., death), we use a generalization of the trajectory model that allows the probability of dropout to vary as a function of prior observations [59]. Thus, trajectory specific attrition rates were calculated and adjustments to trajectory group membership probabilities made. All analyses were performed using Stata13 mp software (StataCorp. 2013. College Station, TX).
RESULTS
Baseline characteristics of the sample are shown in Table 1. The sample had a mean age of 73 years (SD 6.5) and was mostly female (58.29 %). Fig. (1) presents the plots of MMSE over time for the three distinct trajectory groups. Group 1 starts at an average MMSE of 22 and shows a rapid decline during follow-up. Group 2 starts with an average MMSE of 24 and then shows a slow decline. Group 3 starts with the highest average MMSE [28] and remains relatively stable through follow-up. This figure also displays the overall population mean ranging from an MMSE of 25 at baseline to 20 at last follow-up. The posterior probabilities for group membership were all acceptable ranging from 80% for the rapid and 79% for the slow declining groups to 86% for the stable group. Dropout probabilities varied by trajectory group with the stable group having the lowest probability of dropout (0.17), followed by the steady decline group (0.23) and the rapid decline group (0.37). The dropout probabilities reflect the actual attrition rates for the groups over 20 years of follow-up which were 60% for the stable group, 80% for the steady decline group, and 93% for the rapid decline group. Clearly, attrition was highest in the least robustly healthy groups, the steady decline and rapid decline groups. This is not surprising as the primary reason for attrition was the death of the respondent. Other types of attrition did not vary across groups.
Table 1.
Characteristics of respondents, complete data and no proxy, HEPESE 1993–1994, percent or mean (SD), (N=2767).
| Total Sample | |
|---|---|
| MMSE | 24.83 (4.5) |
| Age | 73.20 (6.5) |
| Female | 58.29 |
| Married | 55.76 |
| High school | 9.72 |
| Vision impairment | 24.50 |
| Depressive | 22.88 |
| Diabetes | 23.38 |
| Hypertension | 40.51 |
| Heart attack | 10.08 |
| Stroke | 5.49 |
| Over weight | 39.86 |
| Obese | 29.31 |
| ADLs | 0.30 (1.1) |
| Strain | 20.49 |
| Church attendance | 51.50 |
| Social Support | 68.38 |
Fig. (1).
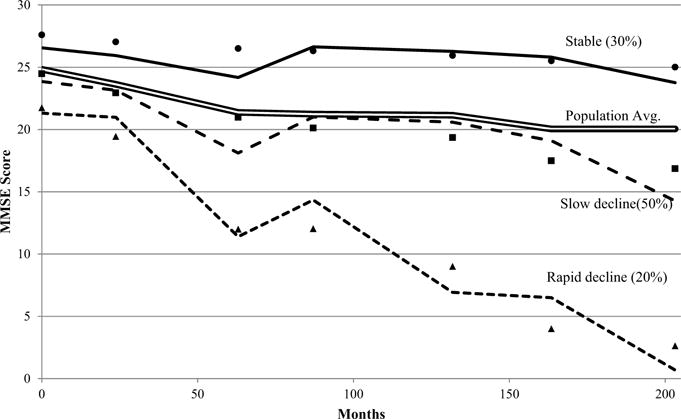
Trajectories of MMSE over time for population average (double line) and the observed (markers) and predicted values for three trajectory groups: stable (solid line), slow decline (dashed line), and rapid decline (dotted line) – HEPESE (1993–2011).
The results of the multinomial logit portion of the latent class analysis are presented in Table 2. The odds ratios describe the odds of membership in the rapid decline and steady decline groups with the stable group as referent. Women had 45% lower odds of being in the group with rapidly declining MMSE and 30% lower odds of being in the steady decline group compared to the stable group group. High school education or higher reduced odds of membership in the rapid decline group by 72% and the slow decline group by 90%. Age was associated with increased odds of membership in the rapid and slow decline trajectory groups compared to the stable group. Baseline visual impairment was associated with a nearly five-fold increase in odds of membership in the rapid decline group and nearly two-fold increase in odd of membership in the slow decline group (OR 4.97, 95% CI 3.09–6.85 and OR 1.99, 95% CI 1.18 – 2.80 respectively).
Table 2.
Latent Class Mixture Models of Trajectories of MMSE from the HEPESE (N = 2767) – Risk Factors for Group Membership, OR (95% CI).
| Group 1: Rapid Decline |
Group 2: Slow decline |
Group 3: Stable |
|||
|---|---|---|---|---|---|
| Age | 1.04 | (1.01 – 1.07) | 1.03 | (1.00 – 1.06) | (ref) |
| Female | 0.55 | (0.38 – 0.72) | 0.70 | (0.50 – 0.90) | |
| High school | 0.28 | (0.15 – 0.41) | 0.10 | (0.05 – 0.15) | |
| Diabetes | 1.05 | (0.67 – 1.43) | 1.13 | (0.76 – 1.50) | |
| Hypertension | 1.03 | (0.72 – 1.34) | 0.90 | (0.65 – 1.15) | |
| Overweight | 0.54 | (0.35 – 0.73) | 0.75 | (0.49 – 1.01) | |
| Obese | 0.40 | (0.24 – 0.56) | 0.67 | (0.42 – 0.92) | |
| Vision Impairment | 4.97 | (3.09 – 6.85) | 1.99 | (1.18 – 2.80) | |
Table 3 shows the association of time varying covariates with MMSE over time for each trajectory group. The results of the time varying covariates describe the average effect of each factor at each time point. For religious attendance in the rapid decline group, an average 2.5 point increase in MMSE at each time point was predicted holding all other variables constant. Heart attack and stroke were each associated with increased MMSE for the slow decline group but not the stable or rapid decline groups over time. ADL limitations were associated with decreases in MMSE for all three groups, and depressive symptoms were associated with decreased MMSE in the slow decline and stable groups over time. In the rapidly declining group, marital status (married) and social support were both associated with increases in MMSE (β = 2.09, p<0.001 and β = 1.89, p<0.001 respectively). In the stable trajectory group, financial strain was associated with reduced MMSE score (β = −0.87, p<0.001). Weekly church attendance was associated with increased MMSE in all three trajectory groups. Wald tests of equality of the linear terms for the stable, steady decline, and rapid decline groups indicated that the slopes of the trajectories were different (Chi Square = 120.64, p < 0.001).
Table 3.
Latent Class Mixture Models of Trajectories of MMSE from the HEPESE (N = 2767) – Time-Varying Covariate Coefficient Estimates.
| Group 1: Rapid Decline |
Group 2: Slow Decline |
Group 3: Stable |
||||
|---|---|---|---|---|---|---|
| Heart Attack | 0.84 | 1.33 | *** | 0.57 | ||
| Stroke | 0.22 | 1.22 | *** | −0.48 | ||
| Married | 2.09 | *** | 0.91 | *** | 0.53 | ** |
| Strain | 1.61 | *** | −0.15 | −0.87 | *** | |
| Depressive | 1.11 | ** | −0.53 | ** | −1.44 | *** |
| ADL limits | −1.58 | *** | −0.85 | *** | −0.37 | *** |
| Social support | 1.89 | *** | 0.25 | 0.35 | ||
| Church attendance | 2.50 | *** | 0.84 | *** | 0.64 | *** |
p<=0.01,
p<0.001
Table 4 presents the characteristics of the sample following trajectory group assignment. The rapid decline group was significantly older (mean 77 SD 7.4) than the steady decline group (mean 73 SD 6.3) or the stable group (mean 71 SD 4.6). Members of this group also had higher rates of stroke and more ADL limitations. Members of the stable group were more likely female, married, high school educated, obese, and attend church at least once a week. The distribution of social support did not vary across groups.
Table 4.
Baseline Characteristics of Trajectory Groups, HEPESE (N = 2767) – percent or mean (SD).
| Rapid Decline | Steady Decline | Stable | ||
|---|---|---|---|---|
| N | 479 | 1538 | 750 | |
| MMSE | 20.63 (5.1) | 24.61 (3.7) | 28.03 (2.5) | *** |
| Age | 77.41 (7.4) | 73.08 (6.3) | 70.73 (4.6) | *** |
| Female | 49.79 | 58.43 | 63.24 | *** |
| Married | 51.67 | 54.78 | 60.7 | ** |
| High school | 5.86 | 1.76 | 28.74 | *** |
| Vision Impairment | 54.81 | 21.73 | 10.83 | *** |
| Depressive | 25.1 | 25.7 | 15.51 | *** |
| Diabetes | 23.22 | 24.14 | 21.66 | |
| Hypertension | 41.21 | 38.71 | 43.45 | |
| Heart attack | 12.76 | 9.76 | 8.82 | |
| Stroke | 7.95 | 5.2 | 4.28 | * |
| Overweight | 38.08 | 40.27 | 40.24 | |
| Obese | 19.25 | 29.6 | 35.29 | *** |
| ADLs | 0.52 (1.5) | 0.32 (1.2) | 0.10 (0.6) | *** |
| Strain | 19.67 | 22.9 | 16.04 | *** |
| Social Support | 69.1 | 68.32 | 68.1 | |
| Church attendance | 43.31 | 51.66 | 56.68 | *** |
p<=0.05,
p<=0.01,
p<0.001
Because cognitive decline may be associated with other declines in higher order functioning, such as IADLs, we performed a sensitivity analysis using a joint trajectory model wherein changes in IADL and MMSE were modeled concurrently. The results of these analyses found that the probability of membership in the stable group conditional upon membership in a stable IADL group was 87.1. However, conditional on membership in the high disability group, probability of membership in the rapid decline MMSE group was 50.5 and membership in the slow decline MMSE group was 42.3. The joint probabilities for all possible combinations suggest the co-occurrence of stable IADL and stable MMSE with less clear connections between declining groups.
DISCUSSION
While many risk factors for declines in cognition have been identified, less attention has been placed on factors associated with cognitive resiliency. We applied latent class mixture models to identify subgroups of cognitive change trajectories in a sample of older Mexican origin adults. While the emphasis of our analyses was on modifiable behaviors potentially beneficial to cognitive maintenance, we also address a range of factors that may contribute to cognitive change in older adults.
Previous report on the HEPESE population found that cognitive decline was associated with increased age, low education (less than high school), marital status (not married), diabetes, stroke, and depression [39]. These risk factors for decline are echoed by our results though not consistently across trajectory groups. For example, our results suggest that depressive symptoms have a negative effect only in the stable and slow declining groups and not in the rapid declining group. Marital status was only beneficial to the rapid and slow declining groups and not the stable group. Such distinction would be difficult to detect in a population average approach.
Cardiovascular risk factors for cognitive decline are well documented [60–63]. The somewhat protective effects of cardiovascular disease in our study were unexpected. The strong positive effect of heart attack on cognition in the steady decline trajectory group may in part reflect a survivor benefit. In a study of 135 patients (mean age, 84) with Alzheimer’s Disease, a history of a coronary artery bypass graft was associated with slower decline in cognition. This association suggests healthy survivors’ effect, with the less health having died off leaving the more cognitively resilient ones behind [64]. It is also possible that the resulting medical intervention had a collateral protective effect on cerebrovascular health. Survival of an acute event such as a heart attack may also lead to lifestyle changes like smoking cessation, improved diet, and medication adherence which may also have a supportive effect on cognitive function. The lack of association of hypertension and cognitive decline may reflect ambiguity in the self-report of the condition.
Our finding of obesity and decreased odds of declining cognition reflects the complexity in the relationship between weight and cognition change. The relationship between weight and late-life cognition depends on whether weight as a predicting variable is measured in middle age or in old age. For example, a 21-year longitudinal study of 1449 subjects (mean base line age=51, mean age at follow up=72) showed that obesity, hypertension and high cholesterol in middle age are associated with increased risk of cognitive decline and dementia in old age [65]. On the other hand, in a 10-year longitudinal study of cognitively-intact 918 subjects aged 65 and older, each one BMI unit gained per year was associated with 40% less cognitive decline over time. An annual loss of one BMI unit was associated with 35% increased risk of cognitive decline [66]. Neuropathological evidence also supports this finding. A 5-year prospective cohort study of 298 adults (mean age 80) showed that those with BMI less than 20 have twice the amount of Alzheimer’s Disease related plaques and tangles in their brains compared to the subjects with BMI > 30 [67].
The persistent association of church attendance with increased cognitive status scores was not surprising. Religious attendance has been associated with reduced cognitive decline in several reports [31, 48, 68, 69]. Religious practice may offer benefits through stimulating activities such as reading, prayer and increased social engagement. This enrichment may further support cognitive resilience and facilitate adaptation to changes in the brain [70]. Alternatively, it is possible that religious attendance itself is an indicator of good health. Thus, religious attendance may be expected to be higher in the stable group and possibly confer less benefit due to the healthier profile of this group.
One of the primary benefits of latent class mixture models is their ability to identify subgroups within a population whose trajectories differ from the population average. We identified three distinct trajectory groups representing stable cognition, a slow decline, and a rapid cognitive decline. The slow decline trajectory most closely approximated the overall population average. While increased age is a strong selector for membership into the rapid declining group, this group also had very low rates of protective social factors (high school education, being married, church attendance) and relatively high rates of deleterious physical factors (depression, diabetes, stroke and ADL limitations). In contrast, the trajectory group that showed stable, resilient cognitive scores over time also had the highest rates of protective social factors and lowest rates of physical factors. It is possible that the participants in the rapid decline group could represent developing dementia (e.g., Alzheimer’s or vascular dementia). However, we cannot ascertain this diagnosis via MMSE (a screening tool for possible dementia) as detailed clinical evaluation is needed to establish such diagnosis. Regardless, a rapidly declining MMSE may encourage clinicians to perform a more detailed review for causes of such decline, with the goal of early interventions to preserve physical and mental functions.
Of particular interest is the substantial magnitude of effect for social support and religious attendance in the rapidly declining cognition group. These factors were each associated with more than a 2 point increase in cognitive assessment. Though we used a continuous scale to measure cognition, a 2 point increase could easily represent the difference between cognitively impaired and cognitively intact in a dichotomous designation. Social support might be increased by family and friends in response to a rapid decline in cognition. Such response may help the cognitively-impaired person compensate for any onset of cognition-related disability. Social support has several domains (e.g. financial, emotional, direct help etc.) and each domain might affect cognition differently [32, 71]. It is important to note that our findings do not represent a causal relationship and could indeed be bidirectional. Because participants in the lowest MMSE category also decline most rapidly, it is possible that the MMSE decline might have predated and contributed to both the impact of social support and financial strain in the rapidly declining group compared to the stable group.
LIMITATIONS
There are several limitations that bear mentioning. Information on health conditions in our study were self-reported and may not accurately reflect the health of the individual respondents. However, self-report has been found to be relatively reliable in other research [72]. We were also unable to assess the severity of any health factor such as stroke, heart attack, hypertension or diabetes. Our results were based on a representative sample of Mexican origin older adults residing in the Southwest. Thus, our findings may not be representative of other Hispanic groups in the United States. Another limitation is the MMSE test itself which has been shown to have both a floor effect, whereby a test is too difficult such that even normal individuals score low, and a ceiling effect whereby both normal and impaired individuals score high. The latter is of concern in the present study as the MMSE may not be sensitive enough to distinguish between normal and mildly impaired individuals. Additionally, the MMSE does not completely capture the full range of verbal fluency or executive functioning, domains that more closely correlate with optimal IADL functioning. Since we have no data on early cognitive functioning or on measure of early-life general intelligence function, we can only speculate that MMSE acts as a crude proxy for overall cognitive functioning.
CONCLUSION
Increased cognitive decline in older Mexican origin adults is associated with the presence of cardiovascular risk factors such as diabetes and stroke. Social factors including being married, having high school education and attending church showed a protective effect on cognition over time. The identification of heterogeneous sub groups highlights the differential effect of predictive factors in groups with different trajectories of cognitive change.
Acknowledgments
This work was supported by grants from the National Institutes of Health (grant numbers R01 AG010939, R01 AG017638).
ABBREVIATIONS
- ADL
Activities of Daily Living
- CESD
Center for Epidemiologic Studies Depression Scale
- CI
Confidence interval
- HEPESE
Hispanic Established Population for the Epidemiological Study of the Elderly
- MMSE
Mini Mental State Examination
- OR
Odds Ratio
- SD
Standard deviation
Biography

M. Kristen Peek
Footnotes
CONFLICT OF INTEREST
The authors confirm that this article content has no conflict of interest.
References
- 1.Rocca WA, Petersen RC, Knopman DS, Hebert LE, Evans DA, Hall KS, et al. Trends in the incidence and prevalence of Alzheimer’s disease, dementia, and cognitive impairment in the United States. Alzheimer’s Dementia. 2011;7(1):80–93. doi: 10.1016/j.jalz.2010.11.002. [DOI] [PMC free article] [PubMed] [Google Scholar]
- 2.Plassman BL, Langa KM, Fisher GG, Heeringa SG, Weir DR, Ofstedal MB, et al. Prevalence of Cognitive Impairment without Dementia in the United States. Ann Intern Med. 2008;148(6):427–34. doi: 10.7326/0003-4819-148-6-200803180-00005. [DOI] [PMC free article] [PubMed] [Google Scholar]
- 3.Fitzpatrick AL, Kuller LH, Ives DG, Lopez OL, Jagust W, Breitner J, et al. Incidence and prevalence of dementia in the Cardiovascular Health Study. J Am Geriatr Soc. 2004;52(2):195–204. doi: 10.1111/j.1532-5415.2004.52058.x. [DOI] [PubMed] [Google Scholar]
- 4.Tang M-X, Cross P, Andrews H, Jacobs D, Small S, Bell K, et al. Incidence of AD in African-Americans, Caribbean hispanics, and caucasians in northern Manhattan. Neurology. 2001;56(1):49–56. doi: 10.1212/wnl.56.1.49. [DOI] [PubMed] [Google Scholar]
- 5.Gurland BJ, Wilder DE, Lantigua R, Stern Y, Chen J, Killeffer EH, et al. Rates of dementia in three ethnoracial groups. Intern J Geriatr Psychiatry. 1999;14(6):481–93. [PubMed] [Google Scholar]
- 6.Demirovic J, Prineas R, Loewenstein D, Bean J, Duara R, Sevush S, et al. Prevalence of dementia in three ethnic groups: the South Florida program on aging and health. Ann Epidemiol. 2003;13(6):472–8. doi: 10.1016/s1047-2797(02)00437-4. [DOI] [PubMed] [Google Scholar]
- 7.Mulgrew CL, Morgenstern N, Shetterly SM, Baxter J, Barón AE, Hamman RF. Cognitive functioning and impairment among rural elderly Hispanics and non-Hispanic whites as assessed by the Mini-Mental State Examination. J Gerontol Series B: Psychol Sci Soc Sci. 1999;54(4):P223–P30. doi: 10.1093/geronb/54b.4.p223. [DOI] [PubMed] [Google Scholar]
- 8.Karlamangla AS, Miller-Martinez D, Aneshensel CS, Seeman TE, Wight RG, Chodosh J. Trajectories of cognitive function in late life in the United States: demographic and socioeconomic predictors. Am J Epidemiol. 2009;170(3):331–42. doi: 10.1093/aje/kwp154. [DOI] [PMC free article] [PubMed] [Google Scholar]
- 9.Black SA, Rush RD. Cognitive and functional decline in adults aged 75 and older. J Am Geriatr Soc. 2009;50(12):1978–86. doi: 10.1046/j.1532-5415.2002.50609.x. [DOI] [PubMed] [Google Scholar]
- 10.Brown A, Patten E. Statistical Portrait of Hispanics in the United States, 2012. Washington, DC: Pew Research Center; 2014. [Google Scholar]
- 11.Yaffe K, Haan M, Blackwell T, Cherkasova E, Whitmer RA, West N. Metabolic syndrome and cognitive decline in elderly latinos: findings from the sacramento area latino study of aging study. J Am Geriatr Soc. 2007;55(5):758–62. doi: 10.1111/j.1532-5415.2007.01139.x. [DOI] [PubMed] [Google Scholar]
- 12.Gorelick PB, Scuteri A, Black SE, DeCarli C, Greenberg SM, Iadecola C, et al. Vascular contributions to cognitive impairment and dementia a statement for healthcare professionals from the American Heart Association/American Stroke Association. Stroke. 2011;42(9):2672–713. doi: 10.1161/STR.0b013e3182299496. [DOI] [PMC free article] [PubMed] [Google Scholar]
- 13.Cheng G, Huang C, Deng H, Wang H. Diabetes as a risk factor for dementia and mild cognitive impairment: a meta-analysis of longitudinal studies. Intern Med J. 2012;42(5):484–91. doi: 10.1111/j.1445-5994.2012.02758.x. [DOI] [PubMed] [Google Scholar]
- 14.Al Hazzouri AZ, Haan MN, Deng Y, Neuhaus J, Yaffe K. Reduced heart rate variability is associated with worse cognitive performance in elderly mexican americans. Hypertension. 2014;63(1):181–7. doi: 10.1161/HYPERTENSIONAHA.113.01888. [DOI] [PMC free article] [PubMed] [Google Scholar]
- 15.Haan MN, Weldon M. The influence of diabetes, hypertension, and stroke on ethnic differences in physical and cognitive functioning in an ethnically diverse older population. Ann Epidemiol. 1996;6(5):392–8. doi: 10.1016/s1047-2797(96)00062-2. [DOI] [PubMed] [Google Scholar]
- 16.Farias ST, Mungas D, Hinton L, Haan M. Demographic, neuropsychological, and functional predictors of rate of longitudinal cognitive decline in hispanic older adults. Am J Geriatr Psychiatry. 2011;19(5):440–50. doi: 10.1097/JGP.0b013e3181e9b9a5. [DOI] [PMC free article] [PubMed] [Google Scholar]
- 17.Reuser M, Willekens F, Bonneux L. Higher education delays and shortens cognitive impairment. A multistate life table analysis of the US Health and Retirement Study. Eur J Epidemiol. 2011;26(5):395–403. doi: 10.1007/s10654-011-9553-x. [DOI] [PMC free article] [PubMed] [Google Scholar]
- 18.Almeida OP, Norman P, Hankey G, Jamrozik K, Flicker L. Successful mental health aging: results from a longitudinal study of older Australian men. Am J Geriatr Psychiatry. 2006;14(1):27–35. doi: 10.1097/01.JGP.0000192486.20308.42. [DOI] [PubMed] [Google Scholar]
- 19.Alley D, Suthers K, Crimmins E. Education and cognitive decline in older americans: results from the AHEAD sample. Res Aging. 2007;29(1):73–94. doi: 10.1177/0164027506294245. [DOI] [PMC free article] [PubMed] [Google Scholar]
- 20.Al Hazzouri AZ, Haan MN, Neuhaus JM, Pletcher M, Peralta CA, López L. Cardiovascular risk score, cognitive decline, and dementia in older Mexican Americans: the role of sex and education. J Am Heart Assoc. 2013;2(2):e004978. doi: 10.1161/JAHA.113.004978. [DOI] [PMC free article] [PubMed] [Google Scholar]
- 21.Sheffield KM, Peek MK. Neighborhood context and cognitive decline in older Mexican Americans: results from the Hispanic established populations for epidemiologic studies of the elderly. Am J Epidemiol. 2009;169(9):1092–101. doi: 10.1093/aje/kwp005. [DOI] [PMC free article] [PubMed] [Google Scholar]
- 22.Haan MN, Al-Hazzouri AZ, Aiello AE. Life-span socioeconomic trajectory, nativity, and cognitive aging in Mexican Americans: the Sacramento Area Latino Study on aging. J Gerontol Ser B: Psychol Sci Soc Sci. 2011;66(1):i102–i10. doi: 10.1093/geronb/gbq071. [DOI] [PMC free article] [PubMed] [Google Scholar]
- 23.Wight RG, Aneshensel CS, Miller-Martinez D, Botticello AL, Cummings JR, Karlamangla AS, et al. Urban neighborhood context, educational attainment, and cognitive function among older adults. Am J Epidemiol. 2006;163(12):1071–8. doi: 10.1093/aje/kwj176. [DOI] [PubMed] [Google Scholar]
- 24.Zahodne LB, Glymour MM, Sparks C, Bontempo D, Dixon RA, MacDonald SW, et al. Education does not slow cognitive decline with aging: 12-year evidence from the Victoria Longitudinal Study. J Intern Neuropsychol Soc. 2011;17(06):1039–46. doi: 10.1017/S1355617711001044. [DOI] [PMC free article] [PubMed] [Google Scholar]
- 25.Schneider ALC, Sharrett AR, Patel MD, Alonso A, Coresh J, Mosley T, et al. Education and Cognitive Change over 15 Years: The Atherosclerosis Risk in Communities Study. J Am Geriatr Soc. 2012;60(10):1847–53. doi: 10.1111/j.1532-5415.2012.04164.x. [DOI] [PMC free article] [PubMed] [Google Scholar]
- 26.Wilson R, Hebert L, Scherr P, Barnes L, De Leon CM, Evans D. Educational attainment and cognitive decline in old age. Neurology. 2009;72(5):460–5. doi: 10.1212/01.wnl.0000341782.71418.6c. [DOI] [PMC free article] [PubMed] [Google Scholar]
- 27.Lee Y, Back JH, Kim J, Kim S-H, Na DL, Cheong H-K, et al. Systematic review of health behavioral risks and cognitive health in older adults. Intern Psychogeriatr. 2010;22(02):174–87. doi: 10.1017/S1041610209991189. [DOI] [PubMed] [Google Scholar]
- 28.Stern C, Munn Z. Cognitive leisure activities and their role in preventing dementia: a systematic review. Int J Evid-Based Healthcare. 2010;8(1):2–17. doi: 10.1111/j.1744-1609.2010.00150.x. [DOI] [PubMed] [Google Scholar]
- 29.Bassuk SS, Glass TA, Berkman LF. Social disengagement and incident cognitive decline in community-dwelling elderly persons. Ann Intern Med. 1999;31(3):165–73. doi: 10.7326/0003-4819-131-3-199908030-00002. [DOI] [PubMed] [Google Scholar]
- 30.Bennett DA, Schneider JA, Tang Y, Arnold SE, Wilson RS. The effect of social networks on the relation between Alzheimer’s disease pathology and level of cognitive function in old people: a longitudinal cohort study. Lancet Neurol. 2006;5(5):406–12. doi: 10.1016/S1474-4422(06)70417-3. [DOI] [PubMed] [Google Scholar]
- 31.Hill TD, Burdette AM, Angel JL, Angel RJ. Religious attendance and cognitive functioning among older mexican americans. J Gerontol Ser B: Psychol Sci Soc Sci. 2006;61(1):P3–P9. doi: 10.1093/geronb/61.1.p3. [DOI] [PubMed] [Google Scholar]
- 32.Seeman TE, Lusignolo TM, Albert M, Berkman L. Social relationships, social support, and patterns of cognitive aging in healthy, high-functioning older adults: MacArthur studies of successful aging. Health Psychol. 2001;20(4):243–55. doi: 10.1037//0278-6133.20.4.243. [DOI] [PubMed] [Google Scholar]
- 33.Holtzman RE, Rebok GW, Saczynski JS, Kouzis AC, Wilcox Doyle K, Eaton WW. Social network characteristics and cognition in middle-aged and older adults. J Gerontol Ser B: Psychol Sci Soc Sci. 2004;59(6):P278–P84. doi: 10.1093/geronb/59.6.p278. [DOI] [PubMed] [Google Scholar]
- 34.Barnes LL, Mendes de Leon CF, Wilson RS, Bienias JL, Evans DA. Social resources and cognitive decline in a population of older African Americans and whites. Neurology. 2004;63(12):2322–6. doi: 10.1212/01.wnl.0000147473.04043.b3. [DOI] [PubMed] [Google Scholar]
- 35.Markides KS, Rudkin L, Angel RJ, Espino DV. Health status of Hispanic elderly. In: National Research Council (US) Committee on Population; Martin LG, Soldo BJ, editors. Racial and ethnic differences in the health of older Americans. USA: National Academic Press; 1997. pp. 285–300. [PubMed] [Google Scholar]
- 36.Markides KS, Stroup-Benham CA, Black SA, Satish S, Perkowski LC, Ostir G. Planning services for minority elders in the 21st century. New York: Springer; 1999. The Health of Mexican American Elderly: Selected Findings from the Hispanic EPESE; pp. 72–90. [Google Scholar]
- 37.Folstein MF, Folstein SE, McHugh PR. “Mini-mental state”: a practical method for grading the cognitive state of patients for the clinician. J Psychiatr Res. 1975;12(3):189–98. doi: 10.1016/0022-3956(75)90026-6. [DOI] [PubMed] [Google Scholar]
- 38.Black SA, Espino DV, Mahurin R, Lichtenstein MJ, Hazuda HP, Fabrizio D, et al. The influence of noncognitive factors on the Mini-Mental State Examination in older Mexican-Americans: Findings from the Hispanic EPESE. J Clin Epidemiol. 1999;52(11):1095–102. doi: 10.1016/s0895-4356(99)00100-6. [DOI] [PubMed] [Google Scholar]
- 39.Nguyen HT, Black SA, Ray LA, Espino DV, Markides KS. Predictors of decline in MMSE Scores Among Older Mexican Americans. J Gerontol Ser A: Biol Sci Med Sci. 2002;57(3):M181–M5. doi: 10.1093/gerona/57.3.m181. [DOI] [PubMed] [Google Scholar]
- 40.Wu JH, Haan MN, Liang J, Ghosh D, Gonzalez HM, Herman WH. Impact of diabetes on cognitive function among older Latinos: a population-based cohort study. J Clin Epidemiol. 2003;56(7):686–93. doi: 10.1016/s0895-4356(03)00077-5. [DOI] [PubMed] [Google Scholar]
- 41.World Health Organization. Obesity: preventing and managing the global epidemic. World Health Organization; 2000. [PubMed] [Google Scholar]
- 42.Raji MA, Reyes-Ortiz CA, Kuo Y-F, Markides KS, Ottenbacher KJ. Depressive symptoms and cognitive change in older Mexican Americans. J Geriatr Psychiatr Neurol. 2007;20(3):145–52. doi: 10.1177/0891988707303604. [DOI] [PubMed] [Google Scholar]
- 43.Raji MA, Ostir GV, Markides KS, Goodwin JS. The Interaction of Cognitive and Emotional Status on Subsequent Physical Functioning in Older Mexican Americans Findings From the Hispanic Established Population for the Epidemiologic Study of the Elderly. J Gerontol Ser A: Biol Sci Med Sci. 2002;57(10):M678–M82. doi: 10.1093/gerona/57.10.m678. [DOI] [PubMed] [Google Scholar]
- 44.Satariano W. Epidemiology of aging: an ecological approach. USA: Jones & Bartlett Learning; 2006. [Google Scholar]
- 45.Forsell Y, Jorm AF, Winblad B. Association of age, sex, cognitive dysfunction, and disability with major depressive symptoms in an elderly sample. Am J Psychiatry. 1994;151(11):1600–4. doi: 10.1176/ajp.151.11.1600. [DOI] [PubMed] [Google Scholar]
- 46.Radloff LS. The CES-D scale a self-report depression scale for research in the general population. App Psychol Meas. 1977;1(3):385–401. [Google Scholar]
- 47.Santor DA, Coyne JC. Shortening the CES–D to improve its ability to detect cases of depression. Psychol Assess. 1997;9(3):233–43. [Google Scholar]
- 48.Reyes-Ortiz CA, Berges IM, Raji MA, Koenig HG, Kuo Y-F, Markides KS. Church attendance mediates the association between depressive symptoms and cognitive functioning among older Mexican Americans. J Gerontol Ser A: Biol Sci Med Sci. 2008;63(5):480–6. doi: 10.1093/gerona/63.5.480. [DOI] [PMC free article] [PubMed] [Google Scholar]
- 49.Zuelsdorff ML, Engelman CD, Friedman EM, Koscik RL, Jonaitis EM, La Rue A, et al. Stressful events, social support, and cognitive function in middle-aged adults with a family history of Alzheimer’s Disease. J Aging Health. 2013;25(6):944–59. doi: 10.1177/0898264313498416. [DOI] [PMC free article] [PubMed] [Google Scholar]
- 50.Jones BL, Nagin DS, Roeder K. A SAS procedure based on mixture models for estimating developmental trajectories. Soc Met Res. 2001;29(3):374–93. [Google Scholar]
- 51.Jones BL, Nagin DS. Advances in group-based trajectory modeling and an SAS procedure for estimating them. Sociol Methods Res. 2007;35(4):542–71. [Google Scholar]
- 52.Nagin DS. Analyzing developmental trajectories: a semiparametric, group-based approach. Psychol Methods. 1999;4(2):139–57. doi: 10.1037/1082-989x.6.1.18. [DOI] [PubMed] [Google Scholar]
- 53.Jones B, Nagin D. A Stata plugin for estimating group-based trajectory models. 2012 Retrieved. [Google Scholar]
- 54.Cerdá M, Johnson-Lawrence VD, Galea S. Lifetime income patterns and alcohol consumption: Investigating the association between long-and short-term income trajectories and drinking. Soc Sci Med. 2011;73(8):1178–85. doi: 10.1016/j.socscimed.2011.07.025. [DOI] [PMC free article] [PubMed] [Google Scholar]
- 55.Gill TM, Gahbauer EA, Han L, Allore HG. Trajectories of disability in the last year of life. N Eng J Med. 2010;362(13):1173–80. doi: 10.1056/NEJMoa0909087. [DOI] [PMC free article] [PubMed] [Google Scholar]
- 56.Norris FH, Tracy M, Galea S. Looking for resilience: Understanding the longitudinal trajectories of responses to stress. Soc Sci Med. 2009;68(12):2190–8. doi: 10.1016/j.socscimed.2009.03.043. [DOI] [PubMed] [Google Scholar]
- 57.Peek MK, Howrey BT, Ternent RS, Ray LA, Ottenbacher KJ. Social support, stressors, and frailty among older Mexican American adults. J Gerontol Ser B: Psychol Sci Soc Sci. 2012;67(6):755–64. doi: 10.1093/geronb/gbs081. [DOI] [PMC free article] [PubMed] [Google Scholar]
- 58.Wasserman L. Bayesian model selection and model averaging. J Math Psychol. 2000;44(1):92–107. doi: 10.1006/jmps.1999.1278. [DOI] [PubMed] [Google Scholar]
- 59.Haviland AM, Jones BL, Nagin DS. Group-based trajectory modeling extended to account for nonrandom participant attrition. Sociol Meth Res. 2011;40(2):367–90. [Google Scholar]
- 60.Knopman D, Boland L, Mosley T, Howard G, Liao D, Szklo M, et al. Cardiovascular risk factors and cognitive decline in middle-aged adults. Neurology. 2001;56(1):42–8. doi: 10.1212/wnl.56.1.42. [DOI] [PubMed] [Google Scholar]
- 61.Vermeer SE, Prins ND, den Heijer T, Hofman A, Koudstaal PJ, Breteler MMB. Silent Brain Infarcts and the Risk of Dementia and Cognitive Decline. New Engl J Med. 2003;348(13):1215–22. doi: 10.1056/NEJMoa022066. [DOI] [PubMed] [Google Scholar]
- 62.Carmelli D, Swan G, Reed T, Miller B, Wolf P, Jarvik G, et al. Midlife cardiovascular risk factors, ApoE, and cognitive decline in elderly male twins. Neurology. 1998;50(6):1580–5. doi: 10.1212/wnl.50.6.1580. [DOI] [PubMed] [Google Scholar]
- 63.Plassman BL, Williams JJW, Burke JR, Holsinger T, Benjamin S. Systematic review: factors associated with risk for and possible prevention of cognitive decline in later life. Ann Intern Med. 2010;153(3):182–93. doi: 10.7326/0003-4819-153-3-201008030-00258. [DOI] [PubMed] [Google Scholar]
- 64.Mielke M, Rosenberg P, Tschanz J, Cook L, Corcoran C, Hayden K, et al. Vascular factors predict rate of progression in Alzheimer disease. Neurology. 2007;69(19):1850–8. doi: 10.1212/01.wnl.0000279520.59792.fe. [DOI] [PubMed] [Google Scholar]
- 65.Kivipelto M, Ngandu T, Fratiglioni L, Viitanen M, Kåreholt I, Winblad B, et al. Obesity and vascular risk factors at midlife and the risk of dementia and Alzheimer disease. Arch Neurol. 2005;62(10):1556–60. doi: 10.1001/archneur.62.10.1556. [DOI] [PubMed] [Google Scholar]
- 66.Buchman AS, Wilson RS, Bienias JL, Shah RC, Evans DA, Bennett DA. Change in body mass index and risk of incident Alzheimer disease. Neurology. 2005;65(6):892–7. doi: 10.1212/01.wnl.0000176061.33817.90. [DOI] [PubMed] [Google Scholar]
- 67.Buchman A, Schneider J, Wilson R, Bienias J, Bennett D. Body mass index in older persons is associated with Alzheimer disease pathology. Neurology. 2006;67(11):1949–54. doi: 10.1212/01.wnl.0000247046.90574.0f. [DOI] [PubMed] [Google Scholar]
- 68.Corsentino EA, Collins N, Sachs-Ericsson N, Blazer DG. Religious attendance reduces cognitive decline among older women with high levels of depressive symptoms. J Gerontol Ser A: Biol Sci Med Sci. 2009;64A(12):1283–9. doi: 10.1093/gerona/glp116. [DOI] [PMC free article] [PubMed] [Google Scholar]
- 69.Van Ness PH, Kasl SV. Religion and cognitive dysfunction in an elderly cohort. J Gerontol Ser B: Psychol Sci Soc Sci. 2003;58(1):S21–S9. doi: 10.1093/geronb/58.1.s21. [DOI] [PMC free article] [PubMed] [Google Scholar]
- 70.Scarmeas N, Stern Y. Cognitive reserve and lifestyle. J Clin Exp Neuropsychol. 2003;25(5):625–33. doi: 10.1076/jcen.25.5.625.14576. [DOI] [PMC free article] [PubMed] [Google Scholar]
- 71.Eisele M, Zimmermann T, Kohler M, Wiese B, Heser K, Tebarth F, et al. Influence of social support on cognitive change and mortality in old age: results from the prospective multicentre cohort study AgeCoDe. BMC Geriatr. 2012;12(1):9. doi: 10.1186/1471-2318-12-9. [DOI] [PMC free article] [PubMed] [Google Scholar]
- 72.Zelinski EM, Crimmins E, Reynolds S, Seeman T. Do medical conditions affect cognition in older adults? Health Psychol. 1998;17(6):504–12. doi: 10.1037//0278-6133.17.6.504. [DOI] [PubMed] [Google Scholar]