Abstract
Purpose
We measured localized changes occurring in the foveal cone photoreceptors and related defects in the cone mosaic to alterations in the nearby retinal vasculature.
Methods
The central 4° of the retina of 54 diabetic (53.7 ± 12.5 years) and 85 control (35.8 ± 15.2 years) participants were imaged with the Indiana adaptive optics scanning laser ophthalmoscope. Foveal cones and overlying retinal capillaries were imaged and infrared scanning laser ophthalmoscopy (IR SLO) images and optical coherence tomography (OCT) B-scans were obtained. Follow-up imaging sessions were performed with intervals from 4 to 50 months for 22 of the 54 diabetic participants.
Results
The foveal cone mosaics of 49 of 54 diabetic participants were of sufficient quality to assess the absence or presence of small localized defects in the cone mosaic. In 13 of these 49 diabetic participants we found localized defects, visualized as sharp-edged areas of cones with diminished reflectivity. These small, localized areas ranged in size from 10 × 10 μm to 75 × 30 μm. Of these 13 participants with cone defects, 11 were imaged over periods from 4 to 50 months and the defects remained relatively stable. These dark regions were not shadows of overlying retinal vessels, but all participants with these localized defects had alterations in the juxtafoveal capillary network.
Conclusions
The foveal cone mosaic can show localized areas of dark cones that persist over time, that apparently correspond to either missing or nonreflecting cones, and may be related to local retinal ischemia.
Keywords: adaptive optics, cone photoreceptor, diabetes, defects, dark cones
Vascular damage is common in diabetes and can occur early in the disease. In the retina, changes to the vasculature lead to diabetic retinopathy, including vascular remodeling, diabetic macular edema (DME), and ischemia.1–4 The ready availability for noninvasive measurements of the retina has led to increased interest in using the retina as an early biomarker for diabetic microvascular damage.5 Changes seen in the inner retina include capillary wall alterations, capillary dropout, vascular remodeling, hard exudates and cysts.6–11 However, capillary dropout in diabetes is not limited to the inner retina and can be observed in the outer retina and choroid.12–14
Diabetic retinopathy also has been characterized, but to a lesser extent, as a neurodegenerative disease that affects retinal neural cells, including ganglion cells, glial cells, and photoreceptors.15–17 Only a few studies have examined changes to the photoreceptor layer in diabetes and changes have not been found consistently.8,18–20 In diabetic retinopathy, photoreceptor damage has been reported,21–23 but there is less emphasis on assessing photoreceptors than on inner retinal changes and vascular damage. There is growing evidence that photoreceptors and inner retinal neurons are impacted early in the course of diabetic retinopathy and may have a critical role due to their high metabolic demand.22 In people with diabetes, the anatomic integrity of the cone photoreceptor mosaic is impacted with increased cone spacing in the fovea (corresponding to lower cone density),8 lower cone densities along the horizontal and vertical meridians,18,19 as well as changes on the regularity of the cone mosaic,19,20 compared to visually normal participants. Photoreceptor damage is evident in DME24 where there is thickening of the outer retina and small lesions are detected in the photoreceptor layer.25,26 These disruptions in photoreceptor layer integrity are related to visual acuity decline.27,28 Damage to photoreceptors and the outer retina also is revealed by color matching23,29 and electrophysiology, including electroretinogram (ERG), multifocal electroretinogram (mfERG), and the electro-oculogram (EOG).30–35 Some of these functional changes appear to be predictive of future damage.31 Together, these finding suggest a link between photoreceptor function and the vascular changes we associate more commonly with diabetic retinopathy.22
In the current study, we investigated the impact of diabetes on the cone mosaic using adaptive optics scanning laser ophthalmoscopy (AOSLO) imaging. We compared the cone mosaic changes, visualized as areas of localized decreased cone reflectivity, to the structural integrity of the overlying capillary vasculature and retinal thickness measured using spectral-domain optical coherence tomography (SD-OCT).
Methods
Participants
A total of 85 individuals (19 to 66 years old; mean ± SD, 35.8 ± 15.2; 40 females and 45 males) without diabetes or other significant retinal or systemic diseases served as visually normal control participants (controls), and 54 individuals (23 to 76 years old; mean ± SD, 53.7 ± 12.5; 22 females and 32 males) with type 1 or type 2 diabetes (diabetic participants or diabetics) participated in the study. Two of the diabetic participants either had proliferative diabetic retinopathy (PDR) or PDR developed during the course of this study. All others had either no or nonproliferative diabetic retinopathy (NPDR). Data from some of the normal control participants were reported previously.36–39 All controls had visual acuities of 20/20 or better, and all diabetic participants had visual acuities of 20/40 or better. Except where noted, we imaged one eye per participant. Exclusion criteria for this study included any retinal or systemic disease known to impact the retinal vasculature other than controlled hypertension.
Consent was obtained after a full explanation of the procedures and consequences of this study. The study protocol was approved by Indiana University Institutional Review Board and complied with the tenets of the Declaration of Helsinki.
Clinical Examination Before AOSLO Imaging Session
A 30° infrared (IR) SLO fundus image and volumetric SD-OCT images were obtained (Spectralis; Heidelberg Engineering, Heidelberg, Germany). Volumetric SD-OCT scans were centered at the fovea and covered a region between 15° × 5° (131 B-scans with 11 μm spacing between B-scans) and 20° × 15° or 20° × 20° (between 73 and 193 B-Scans with 30 or 60 μm spacing between B-scans). Depending on the participant's fixation, either the high resolution (HR) or high speed (HS) protocol of the Heidelberg Spectralis was used with automatic real time eye tracker (ART) and 15 ± 3 images (for diabetics) and 17 ± 3 images (for control) were averaged to create each SD-OCT. Quality on the Heidelberg Spectralis is expressed as a signal-to-noise ratio and averaged 27 ± 5 dB for diabetics and 29 ± 5 dB for controls (mean ± standard deviation). The commercial OCT device nominally has a pixel size of 3.87 μm in the axial direction and, for a Gullstrand model eye, between 5.55 μm (high resolution mode) and 13.36 μm (high speed mode) in the transverse direction.
AOSLO Imaging Session
Each participant's pupil was dilated with one drop each of 0.5% tropicamide and 2.5% phenylephrine. We used the Indiana high resolution woofer-tweeter AOSLO.6,40 In brief, the system uses a supercontinuum laser source (NKT Photonics, Birkerod, Denmark) to provide wavefront sensing (856 nm, 50 μW) and infrared imaging (2 channels with 820 and 785 nm, 100 μW each). Typically, confocal and multiply scattered light images were collected simultaneously, except for 12 patients in whom the imaging modes were collected sequentially. The confocal mode had a 100 μm (2 Airy disk diameter) centered confocal aperture and the multiply scattered light mode had a 500 μm (10 Airy disk diameter) offset aperture. The participant's head movements were stabilized using a chin and forehead rest. We used two different computer controlled field sizes: a 1.3° × 1.2° imaging field with nominal 0.67 μm/pixel sampling and a 2° × 1.8° imaging field with nominal 1 μm/pixel sampling. Individual's axial length was measured with a biometer (IOL Master; Version 5; Carl Zeiss Meditec, Dublin, CA, USA) in 47 of the 54 participants with diabetes, ranging from 22.1 to 27.2 mm (mean ± SD = 23.87 ± 1.09 mm), and distances in micrometers were adjusted for these individual variations. For the remaining 7 diabetic participants, we considered a Gullstrand standard eye of 24 mm length.
The pupil position was adjusted at the beginning of the imaging sequence and monitored during the image acquisition. For the cones, the central 3.6° × 4° were imaged using the 1.8° × 2° field size and the central 2.6° × 2.4° were imaged using the 1.3° × 1.2° field size. For the capillaries, only the larger field size was used to image a 6° × 6° region centered on the fovea. We also imaged the contiguous 3° × 8° temporal strip focused on the retinal capillaries in all diabetic participants. For 26 of the diabetics we imaged a contiguous 3° × 8° temporal or superior strip focused on the cones photoreceptor layer. The IR SLO fundus image acquired with the Heidelberg Spectralis was used to guide the AOSLO imaging session.41
Image Processing and Montaging
Images of the cone mosaic and retinal capillaries were recorded as short videos (100 frames at 580 × 520 pixels/frame) digitized at each retinal location and processed later. After the correction of scan distortion,42 an automatic selection of a template image from each video segment was done, and the alignment of the remaining frames at that location to the template frame proceeded under computer control (MATLAB; Mathworks, Natick, MA, USA).43,44 The results were a series of short video sequences with eye movements removed. We then generated averages based on the local best contrast for each imaged retinal location.45 Images from different retinal locations were next automatically aligned to create continuous montages of cones or capillaries with a custom MATLAB routine that combined MATLAB and i2k Retina (DualAlign, LLC, Halfmoon, NY, USA); using the command line executable of i2k Retina, and Photoshop (Adobe Photoshop CS6 extended) using the Photoshop MATLAB toolbox.
Observation and Analysis of Foveal Cone Mosaic
AOSLO montages were aligned to the IR SLO images by resizing the SLO image to match the pixel size of the AOSLO montage. Then, SD-OCT images and AOSLO foveal cone mosaic and retinal capillary images were analyzed for each patient to compare the regions of interest where localized dark cone regions (LDCR) in the cone mosaic were found and the capillary distribution. The cone photoreceptor images were graded subjectively by 4 different observers and marked as containing LDCR only when all observers agreed.
Multiple follow-up imaging sessions were performed ranging from 4 to 50 months for 22 of the 54 participants with diabetes, and their AOSLO montages were compared over time.
Retinal thickness values were obtained from the central 1 mm of the Early Treatment of Diabetic Retinopathy Study (ETDRS) grid overlaid on the thickness map from the SD-OCT data using the Heidelberg Spectralis software. The grid was centered over the fovea. The B-scan images of the central 1 mm were also analyzed individually to identify the presence of cystoid edema. One-way ANOVAs were performed separately for each of three outcome variables (central 1 mm thickness, minimum central thickness, and maximum central thickness) to compare each of three groups (controls, diabetics with LDCR, and diabetics without LDCR) using one eye per participant. An additional ANOVA was performed for each of these three groups to evaluate age. To account for the multiple comparisons, we performed Bonferroni-Dunn corrections for all comparisons, with an overall P value of P < 0.05 and a corrected P value of P < 0.0167 being considered significant.
Assessment of the Vascular Integrity
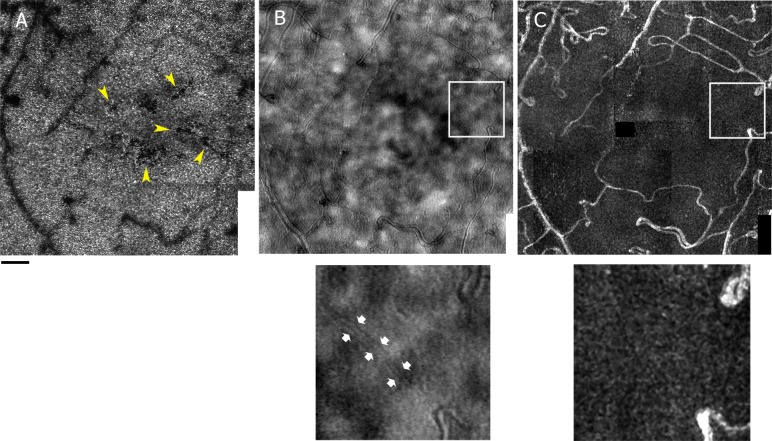
Multiply scattered light images, capillary perfusion maps,43,46,47 and motion videos of the juxtafoveal region were analyzed by three graders to determine vascular integrity of the capillary network including capillary nonperfusion in the diabetic participants with LDCR. Abnormalities of the capillary network include hairpin loops, microaneurysms, and capillary structures lacking blood flow, that is, nonperfused capillaries. These nonperfused capillaries typically have lower contrast walls in the multiply scattered light AOSLO images (Fig. 1). All graders had to agree on the presence of an abnormality for it to be graded as abnormal.
Figure 1.
Example of assessment of vascular integrity in a participant with diabetes (S397 OD 36-year-old female). AOSLO montages in the central 4° of the foveal cone mosaic where yellow arrows point to localized defects in the cone mosaics inside the foveal avascular zone (A), the multiply scattered light of retinal capillaries imaged with 785 nm wavelength and a 500 μm offset confocal aperture (B) and the corresponding capillary perfusion map (C). The small images are enlargements of the region of the white square on the multiply scattered light montage and capillary perfusion map where low contrast walls of the capillary can be seen (pointed at by the small white arrows) but no blood flow. Scale bar: 100 μm.
Results
Cone Photoreceptor Mosaics
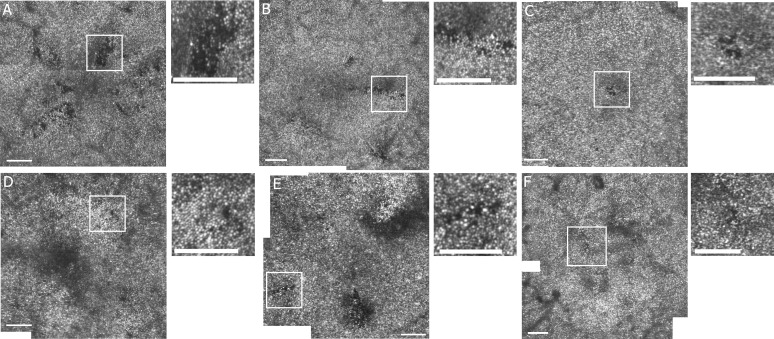
The foveal cone mosaics of 49 of 54 diabetics were of sufficient quality to judge the presence or absence of even small localized defects. In the other 5 diabetic participants, image quality was insufficient to quantify foveal cones mosaics because some regions could not be imaged due to cataract, large eye movements, or overlying edema. The cone mosaics of 13 diabetics showed multiple localized dark cone regions, composed of scattered or contiguous individual dark cones tiled within an apparently preserved brightly reflective cone mosaic (Fig. 2). These LDCRs ranged in size from 10 × 10 to 75 × 30 μm and occurred across age groups (27% of diabetics, 6 females, 7 males; age range, 36–71 years; mean, 51.0 ± 13.3 years). None of the 26 diabetics imaged in the temporal or superior strips, including 7 with foveal LDCR, showed peripheral LDCR. Figure 2 shows examples of cone mosaic montages from six of the diabetic participants with LDCR.
Figure 2.
AOSLO montages of the foveal cone mosaic in the central 2.5° or 4° for 6 diabetic participants with localized defects in cone reflectivity. (A) S397 OS 36-year-old female, (B) S398 OD 37-year-old female, (C) S534 OD 36-year-old female, (D) S531 OD 68-year-old male, (E) S558 OD 57-year-old male, and (F) S517 OS 70-year-old female. The small images are enlargements of the region of the white square on the cone mosaic montage for each participant. Scale bars: 100 μm. Contrast and brightness have been adjusted (increased by 20% and 40%, respectively) to allow better visualization.
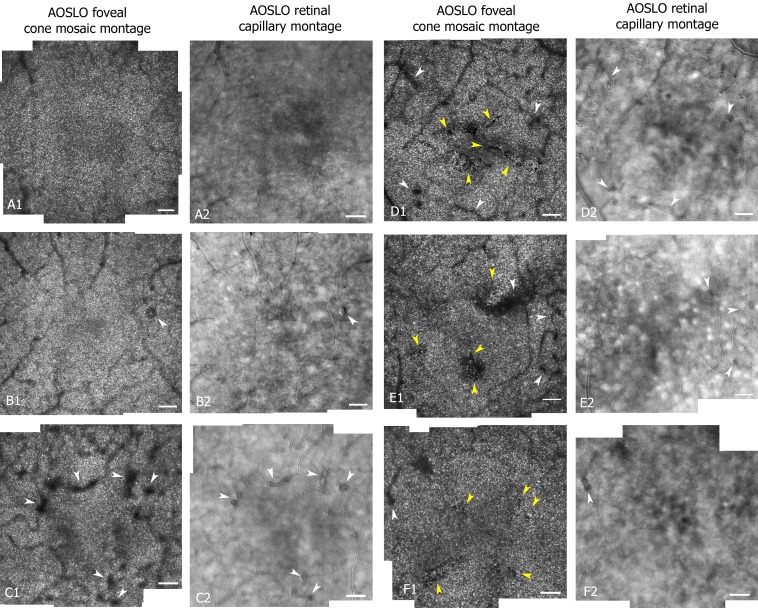
In the 85 visually normal control participants, brighter and darker cones were seen; however, these all followed the usual pattern for visually normal control participants, which consists of a few darker cones intermixed with brighter ones.36,38,39,48,49 None of controls displayed LDCR. Overlying microaneurysms or subclinical capillary remodeling did cause darkened regions in the cone images (e.g., Figs. 3B, 3C) due to shadowing. However, these shadowed regions were not sharp-edged as in LDCR, and when images of cones and vascular structure were compared directly (Fig. 3), the LDCR and these types of vascular alterations did not spatially correspond.
Figure 3.
Central 4° AOSLO montages of the foveal cones mosaic (imaged with 820 nm wavelength and a 100 μm confocal aperture) and corresponding retinal capillaries (imaged with 785 nm wavelength and a 500 μm offset confocal aperture) for a control (S160 OD 33-year-old female [A]), two diabetics without LDCR (S544 OS 37-year-old male [B] and S481 OD 64-year-old female [C]), and three diabetics with presence of LDCR. The LDCR did not correspond to shadowing by overlying vasculature changes or blood vessel shadows (S397 OD 36-year-old female [D]; S558 OD 57-year-old male [E], and S559 OS 63-year-old female [F]). White arrows point to regions of capillary remodeling while yellow arrows point to localized defects in the cone mosaics. Scale bar: 100 μm. Contrast and brightness have been adjusted (increased by 20% and 40%, respectively) to allow better visualization.
Figure 3 compares the cone mosaic and capillary montages from a control (Fig. 3A) and 5 participants with diabetes (Figs. 3B–F). One of these diabetics had no dark regions (Fig. 3B), one had a darkened region from overlying vascular remodeling without LDCR (Fig. 3C), and three of the diabetics had LDCR (Figs. 3D1–F1, yellow arrows). The darkened regions corresponding to overlying vascular changes are a result of shadowing of the cones from the vessels and have fuzzy borders, whereas the LDCR have a more distinct, jigsaw-like pattern to their borders defined by individual dark cones. All 13 diabetics with LDCR had an enlargement of the foveal avascular zone secondary to capillary nonperfusion as visualized with multiply scattered light. The presence of capillary dropout is a common finding in the diabetic participants and was not uniquely associated with LDCR, since it also was present in diabetic participants without LDCR and in other areas in these eyes.
Of the 13 participants having LDCR, 11 had at least one repeat imaging session over intervals ranging from 4 to 50 months subsequent to their first imaging session. The LDCR observed in their cone photoreceptor mosaic remained stable in location with minor alterations over time. Figure 4 shows LDCR imaged in two of the participants with diabetes multiple times over a time course of 26 months (Figs. 4A, 4B) and 33 months (Figs. 4C, 4D) respectively.
Figure 4.
Examples of localized defects from two participants with diabetes over time: two regions (A, B) from a 37-year-old female (S398) imaged after 4, 20, and 26 months after the first imaging session (left) and two regions (C, D) from a 36-year-old female (S397) imaged after 4, 20, and 33 months after the first imaging session (right). Retinal montages of 2.6° × 2.4° with 0.67 μm/pixel sampling. Scale bars: 100 μm. Brightness has been adjusted (increased by 20%) to allow better visualization.
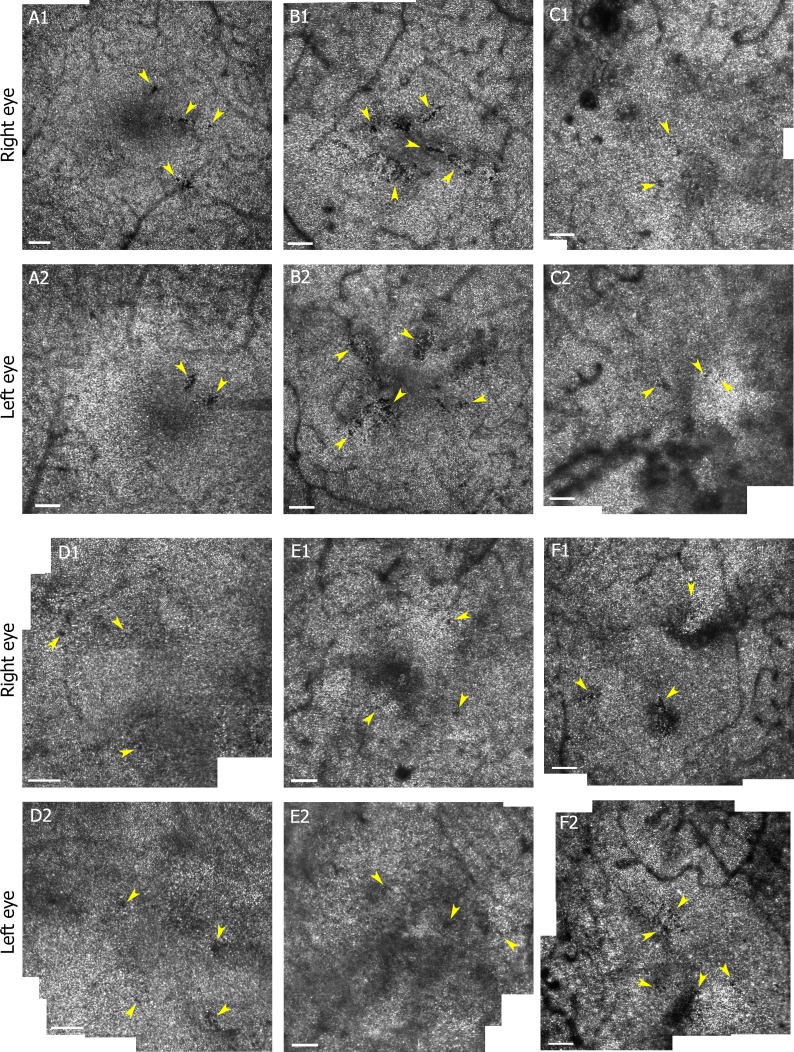
To test whether the LDCR were related to individual patient response to diabetes we imaged the fellow eye of 6 of the 13 diabetic participants with LDCR. Although the imaging of the fellow eye was not always contemporaneous, LDCR were found in both eyes for all six participants (Fig. 5).
Figure 5.
AOSLO cone mosaic montages (3.6° × 4° region around fovea) from right (A1–F1) and left (A2–F2) eyes of six diabetic participants (S398 a 37-year-old female [A]; S397 a 36-year-old female [B]; S207 a 36-year-old male [C]; S605 a 58-year-old male [D]; S531 a 68-year-old male [E]. and S558 a 57-year-old male [F]) with LDCR in both eyes. Yellow arrows point to localized defects, contiguous or locally scattered, in cone mosaics. Scale bars: 100 μm. Brightness has been adjusted (increased by 20%) to allow better visualization.
Comparison of AOSLO Montages to IR SLO Fundus Image and SD-OCT
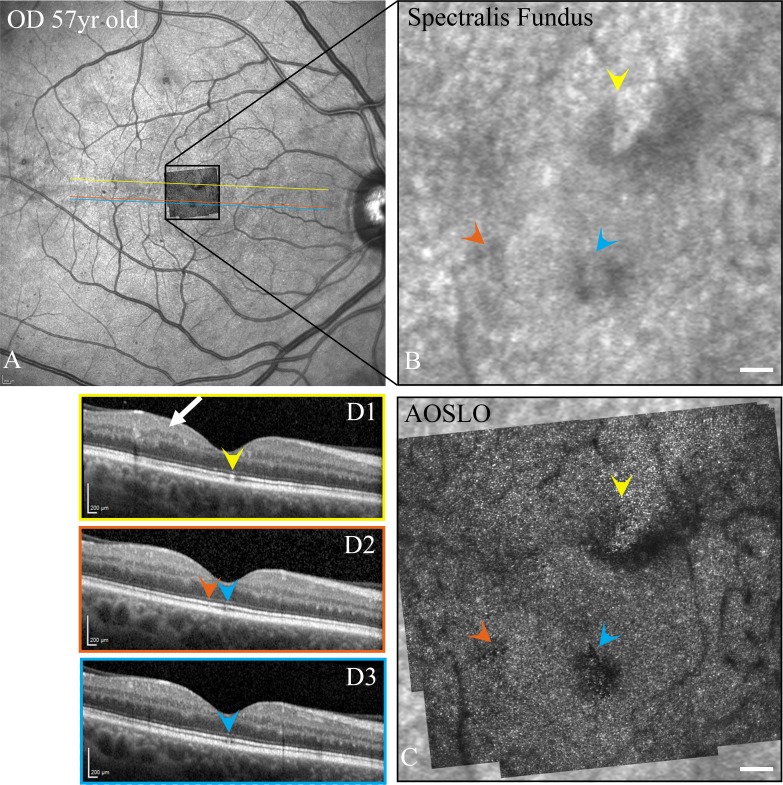
In all cases the LDCR could be identified as dark areas on the IR SLO images (Figs. 6B, 6C). On the SD-OCT B-scans, focal disruptions were observed in combinations of the inner segment ellipsoid zone, outer segments of the photoreceptors, and/or interdigitation zone50 for 10 of the 13 participants. These alterations in the SD-OCT included layer discontinuity and/or variations in reflectivity. Disruptions detected on the B-scan images spatially corresponded to the location of the LDCR in the AOSLO images (Figs. 6D1–D3). In the remaining 3 diabetics, we cannot rule out the possibility they were present, but the OCT B-scans missed the exact region of the LDCR due to the spacing between B-scans.
Figure 6.
SD-OCT fundus images (A), enlargement of the fundus images of the central fovea (B), AOSLO montages superimposed on SLO images (C), and SD-OCT B-scans (D1–D3) for a diabetic participant (S558 OD 57-year-old male; axial length = 23.94 mm) where color arrowheads indicate the corresponding photoreceptor defects in the SD-OCT B-scans and inner retinal changes are shown by the white arrow. Scale bars: 100 μm in AOSLO montages and 200 μm in OCT images.
Central 1 mm thickness was significantly less for diabetics with versus without LDCR (P = 0.0071). No other statistically significant differences (with P < 0.0167, the Bonferroni corrected value required for a 5% probability of a type 1 error) were found either between groups or for other outcome variables. (Table; Fig. 7). There was no significant difference in age between diabetics participants with versus without LDCR (51.0 ± 13.3 vs. 54.5 ± 12.3 years, P = 0.44).
Table.
Comparison of Central Retinal Thickness
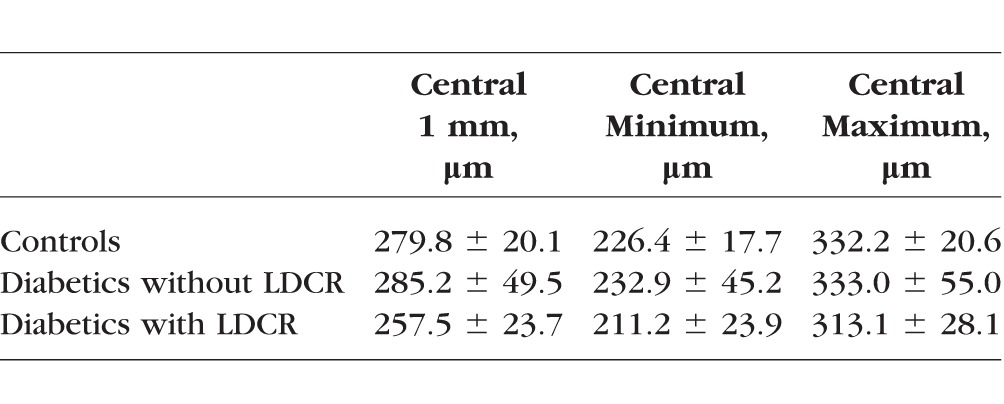
Figure 7.
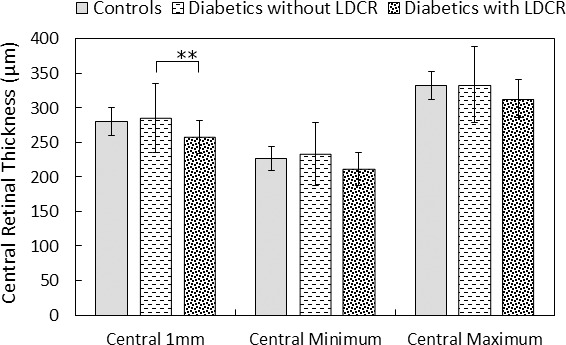
Average central 1 mm thickness, minimum central thickness, and maximum central thickness of the ETDRS grid, for each of three groups—controls, diabetics without LDCR and diabetics with LDCR. A significant difference (**) was found only comparing the diabetics with LDCR to diabetics without LDCR.
Discussion
This study visualized localized cone mosaic abnormalities in a significant proportion—13 of 49 (27%) of diabetic participants. The defects differ from the normative aging changes of decreased cone density38 in that they are characterized by sharp-edged areas of dark cones tiled into the surrounding mosaic of bright cones with the structure of the cone mosaic largely preserved. As the LDCR are present in eyes over time periods of several years with only small changes and often are found bilaterally, they could represent a feature of an individual's response to diabetes. Recent studies using adaptive optics have reported areas of disrupted cone mosaic in some diabetics.20,51
While less obvious, the LDCR are visible by other clinical imaging modalities (Fig. 6). The locations of the defects identified using adaptive optics spatially corresponded and were colocalized in most (10 of 13) diabetic participants to subtle defects in the photoreceptor layers on SD-OCT B-scans and with local indistinct areas of decreased reflectivity on IR SLO images in all patients. We could not rule out the possibility that the LDCR would have been present for all participants on SD-OCT imaging if our volumetric scans were denser.
The LDCR in our diabetic participants were restricted to the central 4° × 4° of the retina. Perifoveal cone images were available in 7 of 13 diabetics with LDCR and 19 of 42 diabetics without LDCR. No LDCR was found in perifoveal cone images. Other studies also have examined the peripheral cones using adaptive optics, and while they find changes to the cone mosaic, localized defects generally are not mentioned as a common feature.18–20,51 Thus, LDCR seems to be less prevalent beyond 2° retinal eccentricity and suggests that the fovea is affected preferentially. Such a difference could arise due to either difference in cone packing, with the fovea having very dense packing, resulting in a different metabolic load or perhaps just because defects are detected more readily with a dense mosaic. Another consideration, however, is that these defects are occurring within or immediately adjacent to the FAZ where the cells are more dependent on the choroidal circulation and the juxtafoveal capillary network, and all of the diabetics with LDCR did have changes to the juxtafoveal capillary network as we discuss below.
LDCR, or “dark” cone areas, likely represent living but functionally compromised cones with an impaired ability to wave guide as opposed to absent cones. Multiply scattered light imaging46,52,53 allows visualization of cone inner segments;54 however, we did not find conditions that reliably revealed the inner segments in either normal or diabetic participants due to the small cone spacing that occurs in this central retinal region. Nevertheless, if cones were absent in these regions, holes in the photoreceptor matrix likely would have been filled in by surrounding cones sliding into the space.55 In the diabetic participants with LDCR followed over time, including one participant with data spanning 3 years, no such alterations were evident as the defects remained generally stable with sharp edges. Thus, it is more likely that the cones are present but are physiologically disturbed in a way that impairs the wave guide function of the outer segments. The LDCR in this study were seen as very distinct localized changes that did not grossly impact vision, although functional impairment and changes in metabolism of the cones may have been more widespread and could be related to cone defects that have been reported in diabetics23,56,57 and may be related to functional changes in diabetes,27–32 which are consistent with the treatment of diabetes as a neurodegenerative disorder.1–4
In all patients with LDCR, capillary alterations were observed within their juxtafoveal capillary networks including capillary nonperfusion (Fig. 1). The combination of AOSLO reflectance and motion images is required to allow the identification of nonperfused capillaries. Motion contrast methodologies, such as AOSLO perfusion maps or OCT-A, show only perfused capillaries and fail to allow the identification of nonperfused capillaries especially in this area of high individual variation.43
However, these juxtafoveal capillary alterations are not unique to participants with LDCR. Many areas of capillary nonperfusion are found in the retinas of our diabetic participants without LDCR, including in their juxtafoveal capillary network, and the participants with LDCR also had other areas of the capillary dropout outside of the fovea not colocalized with LDCR. This suggests that another factor is involved in the creation of these areas. One possibility is that this additional factor is a defect in the main source of oxygen for the cone ellipsoids—the choriocapillaris. Such choriocapillaris defects have been shown pathologically in diabetics58 with the greatest concentration of these defects in the posterior pole. As these were found only within the central 4° in our participants, it is possible that the thick retina in the presence of an impaired retinal vascular supply reduces its supplemental contribution to the photoreceptor layer. Thus, LDCR may represent an early sign of damage to the choriocapillaris colocalized with retinal ischemia, with the combination restricting the retinovascular and choriocapillaris contributions to cone photoreceptor oxygenation. Consistent with the juxtafoveal capillary loss without edema shown on AOSLO, the participants with LDCR had significantly thinner retinal thickness in the center of the fovea on SD-OCT compared to diabetics without LDCR. Our diabetic participants imaged bilaterally were concordant between their eyes for LDCR and in the various participants imaged over months to years these areas were relatively stable. In all 6 of the bilaterally imaged diabetic participants, LDCR was present in both eyes. We can only attribute this to the similarities between participant's eyes including the foveal capillary structure43 as well as to the identical genetics and extremely similar physiologic environments to which the two eyes are exposed.
Several studies have found a possible relation to findings of photoreceptor abnormalities using SD-OCT and AOSLO associated with nonperfusion in the deep capillary plexus (DCP) as determined by OCT-A.14,51,59 In these studies, as in ours, nonperfusion in the retinal vasculature was associated with the observed photoreceptor mosaic abnormalities, but they were not present in all regions with nonperfusion further supporting the likelihood of an additional factor influencing photoreceptor changes in diabetics. This additional factor may be colocalized nonperfusion in the choriocapillaris58 or localized areas of breakdown of the outer blood retinal barrier60,61 compromising the outer retinal layers.
In summary, the foveal cone mosaic of diabetic participants can show evidence of localized cone defects that persist over time, are bilateral, and may correspond to either missing or nonreflecting photoreceptors. These changes usually are visible on OCT and correspond to areas of lower reflectivity seen in IR SLO images. While these changes are not evident in all diabetics and are not known to have a significant clinical impact on vision, they are associated with regions of juxtafoveal capillary dropout which are necessary but not sufficient for their occurrence. Further investigation can help determine whether they could serve as a potential biomarker and add to our understanding of the complications of diabetes in the eye and whether the presence of these cone structural changes are related to observed changes in outer retinal function.
Acknowledgments
Supported by the National Eye Institute of the National Institutes of Health under award number R01EY024315, EY019008-01A1, and by the Foundation Fighting Blindness Grant TA-CL-0613-0617-IND. The authors alone are responsible for the content and writing of this paper.
Disclosure: L. Sawides, None; K.A. Sapoznik, None; A. de Castro, None; B.R. Walker, None; T.J. Gast, None; A.E. Elsner, None; S.A. Burns, None
References
- 1. Scholl S,, Kirchhof J,, Augustin AJ. Pathophysiology of macular edema. Ophthalmologica. 2010; 224: 8–15. [DOI] [PubMed] [Google Scholar]
- 2. Garner A. Histopathology of diabetic retinopathy in man. Eye. 1993; 7: 250–253. [DOI] [PubMed] [Google Scholar]
- 3. Bhagat N,, Grigorian RA,, Tutela A,, Zarbin MA. Diabetic macular edema: pathogenesis and treatment. Surv Ophthalmol. 2009; 54: 1–32. [DOI] [PubMed] [Google Scholar]
- 4. Antonetti DA,, Klein R,, Gardner TW. Diabetic retinopathy. N Engl J Med. 2012; 366: 1227–1239. [DOI] [PubMed] [Google Scholar]
- 5. Ikram MK,, Cheung CY,, Lorenzi M,, et al. Retinal vascular caliber as a biomarker for diabetes microvascular complications. Diabetes Care. 2013; 36: 750–759. [DOI] [PMC free article] [PubMed] [Google Scholar]
- 6. Burns SA,, Elsner AE,, Chui TY,, et al. In vivo adaptive optics microvascular imaging in diabetic patients without clinically severe diabetic retinopathy. Biomed Opt Express. 2014; 5: 961–974. [DOI] [PMC free article] [PubMed] [Google Scholar]
- 7. Fu X,, Gens JS,, Glazier JA,, Burns SA,, Gast TJ. Progression of diabetic capillary occlusion: a model. PLoS Comput Biol. 2016; 12: e1004932. [DOI] [PMC free article] [PubMed] [Google Scholar]
- 8. Tam J,, Dhamdhere KP,, Tiruveedhula P,, et al. Subclinical capillary changes in non-proliferative diabetic retinopathy. Optom Vis Sci. 2012; 89: E692–E703. [DOI] [PMC free article] [PubMed] [Google Scholar]
- 9. Tam J,, Dhamdhere KP,, Tiruveedhula P,, et al. Disruption of the retinal parafoveal capillary network in type 2 diabetes before the onset of diabetic retinopathy. Invest Ophthalmol Vis Sci. 2011; 52: 9257–9266. [DOI] [PMC free article] [PubMed] [Google Scholar]
- 10. Alhamami MA,, Elsner AE,, Malinovsky VE,, et al. Comparison of cysts in red and green images for diabetic macular edema. Optometry Vision Sci. 2017; 94: 137–149. [DOI] [PMC free article] [PubMed] [Google Scholar]
- 11. Yamaguchi M,, Nakao S,, Kaizu Y,, et al. High-resolution imaging by adaptive optics scanning laser ophthalmoscopy reveals two morphologically distinct types of retinal hard exudates. Sci Rep. 2016; 6: 33574. [DOI] [PMC free article] [PubMed] [Google Scholar]
- 12. McLeod DS,, Lutty GA. High-resolution histologic analysis of the human choroidal vasculature. Invest Ophthalmol Vis Sci. 1994; 35: 3799–3811. [PubMed] [Google Scholar]
- 13. Lutty GA,, Cao J,, McLeod DS. Relationship of polymorphonuclear leukocytes to capillary dropout in the human diabetic choroid. Am J Pathol. 1997; 151: 707–714. [PMC free article] [PubMed] [Google Scholar]
- 14. Scarinci F,, Nesper PL,, Fawzi AA. Deep retinal capillary nonperfusion is associated with photoreceptor disruption in diabetic macular ischemia. Am J Ophthalmol. 2016; 168: 129–138. [DOI] [PMC free article] [PubMed] [Google Scholar]
- 15. Barber AJ. A new view of diabetic retinopathy: a neurodegenerative disease of the eye. Prog Neuropsychopharmacol Biol Psychiatry. 2003; 27: 283–290. [DOI] [PubMed] [Google Scholar]
- 16. Lieth E,, Gardner TW,, Barber AJ,, Antonetti DA; for the Penn State Research Group. Retinal neurodegeneration: early pathology in diabetes. Clin Experiment Ophthalmol. 2000; 28: 3–8. [DOI] [PubMed] [Google Scholar]
- 17. Fletcher EL,, Phipps JA,, Wilkinson-Berka JL. Dysfunction of retinal neurons and glia during diabetes. Clin Exp Optom. 2005; 88: 132–145. [DOI] [PubMed] [Google Scholar]
- 18. Lombardo M,, Parravano M,, Lombardo G,, et al. Adaptive optics imaging of parafoveal cones in type 1 diabetes. Retina. 2014; 34: 546–557. [DOI] [PubMed] [Google Scholar]
- 19. Tan W,, Wright T,, Rajendran D,, et al. Cone-photoreceptor density in adolescents with type 1 diabetes. Invest Ophthalmol Vis Sci. 2015; 56: 6339–6343. [DOI] [PubMed] [Google Scholar]
- 20. Lammer J,, Prager SG,, Cheney MC,, et al. Cone photoreceptor irregularity on adaptive optics scanning laser ophthalmoscopy correlates with severity of diabetic retinopathy and macular edema. Invest Ophthalmol Vis Sci. 2016; 57: 6624–6632. [DOI] [PMC free article] [PubMed] [Google Scholar]
- 21. Du Y,, Veenstra A,, Palczewski K,, Kern TS. Photoreceptor cells are major contributors to diabetes-induced oxidative stress and local inflammation in the retina. Proc Natl Acad Sci U S A. 2013; 110: 16586–16591. [DOI] [PMC free article] [PubMed] [Google Scholar]
- 22. Kern TS,, Berkowitz BA. Photoreceptors in diabetic retinopathy. J Diabetes Investig. 2015; 6: 371–380. [DOI] [PMC free article] [PubMed] [Google Scholar]
- 23. Elsner AE,, Burns SA,, Lobes LA Jr, Doft BH. Cone photopigment bleaching abnormalities in diabetes. Invest Ophthalmol Vis Sci. 1987; 28: 718–724. [PubMed] [Google Scholar]
- 24. Frank RN. The Optic UK Lecture: bench-to-bedside adventures of a diabetes researcher: results past, results present. Eye (Lond). 2011; 25: 331–341. [DOI] [PMC free article] [PubMed] [Google Scholar]
- 25. Murakami T,, Yoshimura N. Structural changes in individual retinal layers in diabetic macular edema. J Diabetes Res. 2013; 2013: 920713. [DOI] [PMC free article] [PubMed] [Google Scholar]
- 26. Yeung L,, Lima VC,, Garcia P,, Landa G,, Rosen RB. Correlation between spectral domain optical coherence tomography findings and fluorescein angiography patterns in diabetic macular edema. Ophthalmology. 2009; 116: 1158–1167. [DOI] [PubMed] [Google Scholar]
- 27. Shin HJ,, Lee SH,, Chung H,, Kim HC. Association between photoreceptor integrity and visual outcome in diabetic macular edema. Graefes Arch Clin Exp Ophthalmol. 2012; 250: 61–70. [DOI] [PubMed] [Google Scholar]
- 28. Forooghian F,, Stetson PF,, Meyer SA,, et al. Relationship between photoreceptor outer segment length and visual acuity in diabetic macular edema. Retina. 2010; 30: 63–70. [DOI] [PMC free article] [PubMed] [Google Scholar]
- 29. Wolff BE,, Bearse MA,, Schneck ME,, et al. Color vision and neuroretinal function in diabetes. Doc Ophthalmol Adv Ophthalmol. 2015; 130: 131–139. [DOI] [PMC free article] [PubMed] [Google Scholar]
- 30. Tyrberg M,, Lindblad U,, Melander A,, Lovestam-Adrian M,, Ponjavic V,, Andreasson S. Electrophysiological studies in newly onset type 2 diabetes without visible vascular retinopathy. Doc Ophthalmol. 2011; 123: 193–198. [DOI] [PubMed] [Google Scholar]
- 31. Bearse MA Jr,, Adams AJ,, Han Y,, et al. A multifocal electroretinogram model predicting the development of diabetic retinopathy. Prog Retin Eye Res. 2006; 25: 425–448. [DOI] [PMC free article] [PubMed] [Google Scholar]
- 32. Schneck ME,, Shupenko L,, Adams AJ. The fast oscillation of the EOG in diabetes with and without mild retinopathy. Doc Ophthalmol. 2008; 116: 231–236. [DOI] [PubMed] [Google Scholar]
- 33. Holfort SK,, Klemp K,, Kofoed PK,, Sander B,, Larsen M. Scotopic electrophysiology of the retina during transient hyperglycemia in type 2 diabetes. Invest Ophthalmol Vis Sci. 2010; 51: 2790–2794. [DOI] [PubMed] [Google Scholar]
- 34. Greenstein VC,, Thomas SR,, Blaustein H,, Koenig K,, Carr RE. Effects of early diabetic retinopathy on rod system sensitivity. Optom Vis Sci. 1993; 70: 18–23. [DOI] [PubMed] [Google Scholar]
- 35. Tan W,, Wright T,, Dupuis A,, Lakhani E,, Westall C. Localizing functional damage in the neural retina of adolescents and young adults with type 1 diabetes. Invest Ophthalmol Vis Sci. 2014; 55: 2432–2441. [DOI] [PubMed] [Google Scholar]
- 36. Chui TY,, Song H,, Burns SA. Adaptive-optics imaging of human cone photoreceptor distribution. J Opt Soc Am A Opt Image Sci Vis. 2008; 25: 3021–3029. [DOI] [PMC free article] [PubMed] [Google Scholar]
- 37. Chui TYP,, Song H,, Burns SA. Individual variations in human cone photoreceptor packing density: variations with refractive error. Invest Ophthalmol Vis Sci. 2008; 49: 4679–4687. [DOI] [PMC free article] [PubMed] [Google Scholar]
- 38. Song H,, Chui TYP,, Zhong Z,, Elsner AE,, Burns SA. Variation of cone photoreceptor packing density with retinal eccentricity and age. Invest Ophthalmol Vis Sci. 2011; 52: 7376–7384. [DOI] [PMC free article] [PubMed] [Google Scholar]
- 39. Chui TYP,, Song H,, Clark CA,, Papay JA,, Burns SA,, Elsner AE. Cone photoreceptor packing density and the outer nuclear layer thickness in healthy subjects. Invest Ophthalmol Vis Sci. 2012; 53: 3545–3553. [DOI] [PMC free article] [PubMed] [Google Scholar]
- 40. Ferguson RD,, Zhong Z,, Hammer DX,, et al. Adaptive optics scanning laser ophthalmoscope with integrated wide-field retinal imaging and tracking. J Opt Soc Am A Opt Image Sci Vis. 2010; 27: A265–A277. [DOI] [PMC free article] [PubMed] [Google Scholar]
- 41. Huang G,, Qi X,, Chui TYP,, Zhong Z,, Burns SA. A clinical planning module for adaptive optics SLO imaging. Optom Vis Sci. 2012; 89: 593–601. [DOI] [PMC free article] [PubMed] [Google Scholar]
- 42. Stevenson SB,, Roorda A. Correcting for miniature eye movements in high resolution scanning laser ophthalmoscopy. Proc SPIE 2005. 2005; 5288: 145–151. [Google Scholar]
- 43. Chui TYP,, VanNasdale DA,, Elsner AE,, Burns SA. The association between the foveal avascular zone and retinal thickness. Invest Ophthalmol Vis Sci. 2014; 55: 6870–6877. [DOI] [PMC free article] [PubMed] [Google Scholar]
- 44. Hillard JG,, Gast TJ,, Chui TY,, Sapir D,, Burns SA. Retinal arterioles in hypo-, normo-, and hypertensive subjects measured using adaptive optics. Trans Vis Sci Tech. 2016; 5 4: 16. [DOI] [PMC free article] [PubMed] [Google Scholar]
- 45. Huang G,, Zhong Z,, Zou W,, Burns SA. Lucky averaging: quality improvement of adaptive optics scanning laser ophthalmoscope images. Opt Lett. 2011; 36: 3786–3788. [DOI] [PMC free article] [PubMed] [Google Scholar]
- 46. Chui TYP,, Vannasdale DA,, Burns SA. The use of forward scatter to improve retinal vascular imaging with an adaptive optics scanning laser ophthalmoscope. Biomed Opt Express. 2012; 3: 2537–2549. [DOI] [PMC free article] [PubMed] [Google Scholar]
- 47. Chui TYP,, Zhong Z,, Song H,, Burns SA. Foveal avascular zone and its relationship to foveal pit shape. Optom Vis Sci. 2012; 89: 602–610. [DOI] [PMC free article] [PubMed] [Google Scholar]
- 48. Bruce KS,, Harmening WM,, Langston BR,, Tuten WS,, Roorda A,, Sincich LC. Normal perceptual sensitivity arising from weakly reflective cone photoreceptors. Invest Ophthalmol Vis Sci. 2015; 56: 4431–4438. [DOI] [PMC free article] [PubMed] [Google Scholar]
- 49. Pallikaris A,, Williams DR,, Hofer H. The reflectance of single cones in the living human eye. Invest Ophthalmol Vis Sci. 2003; 44: 4580–4592. [DOI] [PubMed] [Google Scholar]
- 50. Staurenghi G,, Sadda S,, Chakravarthy U,, Spaide RF; for the International Nomenclature for Optical Coherence Tomography Panel. Proposed lexicon for anatomic landmarks in normal posterior segment spectral-domain optical coherence tomography: the IN*OCT consensus. Ophthalmology. 2014; 121: 1572–1578. [DOI] [PubMed] [Google Scholar]
- 51. Nesper PL,, Scarinci F,, Fawzi AA. Adaptive optics reveals photoreceptor abnormalities in diabetic macular ischemia. PLoS One. 2017; 12: e0169926. [DOI] [PMC free article] [PubMed] [Google Scholar]
- 52. Chui TYP,, Gast TJ,, Burns SA. Imaging of vascular wall fine structure in the human retina using adaptive optics scanning laser ophthalmoscopy. Invest Ophthalmol Vis Sci. 2013; 54: 7115–7124. [DOI] [PMC free article] [PubMed] [Google Scholar]
- 53. Elsner AE,, Zhou Q,, Beck F,, et al. Detecting AMD with multiply scattered light tomography. Int Ophthalmol. 2001; 23: 245–250. [DOI] [PubMed] [Google Scholar]
- 54. Scoles D,, Sulai YN,, Langlo CS,, et al. In vivo imaging of human cone photoreceptor inner segments. Invest Ophthalmol Vis Sci. 2014; 55: 4244–4251. [DOI] [PMC free article] [PubMed] [Google Scholar]
- 55. Carroll J,, Neitz M,, Hofer H,, Neitz J,, Williams DR. Functional photoreceptor loss revealed with adaptive optics: an alternate cause of color blindness. Proc Natl Acad Sci U S A. 2004; 101: 8461–8466. [DOI] [PMC free article] [PubMed] [Google Scholar]
- 56. Enzsoly A,, Szabo A,, Kantor O,, et al. Pathologic alterations of the outer retina in streptozotocin-induced diabetes. Invest Ophthalmol Vis Sci. 2014; 55: 3686–3699. [DOI] [PubMed] [Google Scholar]
- 57. Genove G,, Mollick T,, Johansson K. Photoreceptor degeneration, structural remodeling and glial activation: a morphological study on a genetic mouse model for pericyte deficiency. Neuroscience. 2014; 279: 269–284. [DOI] [PubMed] [Google Scholar]
- 58. Cao J,, McLeod S,, Merges CA,, Lutty GA. Choriocapillaris degeneration and related pathologic changes in human diabetic eyes. Arch Ophthalmol. 1998; 116: 589–597. [DOI] [PubMed] [Google Scholar]
- 59. Scarinci F,, Jampol LM,, Linsenmeier RA,, Fawzi AA. Association of diabetic macular nonperfusion with outer retinal disruption on optical coherence tomography. JAMA Ophthalmol. 2015; 133: 1036–1044. [DOI] [PMC free article] [PubMed] [Google Scholar]
- 60. Kirber WM,, Nichols CW,, Grimes PA,, Winegrad AI,, Laties AM. A permeability defect of the retinal pigment epithelium. Occurrence in early streptozocin diabetes. Arch Ophthalmol. 1980; 98: 725–728. [DOI] [PubMed] [Google Scholar]
- 61. Xu HZ,, Le YZ. Significance of outer blood-retina barrier breakdown in diabetes and ischemia. Invest Ophthalmol Vis Sci. 2011; 52: 2160–2164. [DOI] [PMC free article] [PubMed] [Google Scholar]


