

Abstract
Background
Progress in neuroscience depends substantially on the ability to establish the detailed spatial and temporal sequence of neuronal population-level activity across large areas of the brain. Because there is substantial inter-trial variability in neuronal activity, traditional techniques that rely on signal averaging obscure where and when neuronal activity occurs. Thus, up to the present, it has been difficult to examine the detailed progression of neuronal activity across large areas of the brain.
New method
Here we describe a method for establishing the spatiotemporal evolution of neuronal population-level activity across large brain regions by determining exactly where and when neural activity occurs during a behavioral task in individual trials. We validate the efficacy of the method, examine the effects of its parameterization, and demonstrate its utility by highlighting two sets of results that could not readily be achieved with traditional methods.
Results
Our results reveal the precise spatiotemporal evolution of neuronal population activity that unfolds during a sensorimotor task in individual trials, and establishes the relationship between neuronal oscillations and the onset of this activity.
Conclusions
The ability to identify the spatiotemporal evolution of neuronal population activity onsets in single trials gives investigators a powerful new tool with which to study large-scale cortical processes.
Keywords: Electrocorticography, ECoG, Broadband, High gamma, Single trial
1. Introduction
In 1942, Charles Sherrington famously likened the brain to an “enchanted loom”, wherein “millions of flashing shuttles [wove] a dissolving pattern, always a meaningful pattern though never an abiding one” (Sherrington, 1942). Charting the sequence of neural activity that traverses the brain during acts of cognition or behavior, and relating its properties to different aspects of behavior or physiology, has remained a central challenge to improved understanding of brain function. While many studies over the past decades have successfully identified the location of neuronal populations that appear to be involved in specific behaviors (Clark et al., 1996; Yousry et al., 1997; Rumeau et al., 1994) and delineated the relationship of physiological features, such as the firing rate, of different neuronal populations with task-related variables (Georgopoulos et al., 1989; Newsome et al., 1989; Thompson et al., 1996), they have been only marginally successful in establishing the spatial and temporal sequence of activity in distant populations of neurons that together implement a complete behavior such as sensorimotor function (Hoogenboom et al., 2010; DiCarlo and Maunsell, 2005; Takeda et al., 2008). In other words, Sherrington’s flashing shuttles have remained elusive.
Superficially, this issue appears to be exclusively due to limitations of available imaging techniques. Whole-brain imaging methods, such as functional magnetic resonance imaging (fMRI), positron emission tomography (PET), or single-photon emission computed tomography (SPECT) can suggest locations of neurons that may change their activity during sensorimotor function (Clark et al., 1996; Yousry et al., 1997; Rumeau et al., 1994), but cannot readily delineate their temporal sequence of activation. Single-unit recordings have successfully characterized task-related behavior of individual neurons and small populations of cells in individual locations (DiCarlo and Maunsell, 2005; Thompson et al., 1996; Georgopoulos et al., 1993, 1989; Newsome et al., 1989; Pesaran et al., 2002), but cannot readily establish evolutions of activity across large areas of the brain. Electro- or magnetoencephalography (EEG or MEG, respectively) can reveal the temporal sequence of synchronous activity of large patches of neurons (Leavitt, 1968; Takeda et al., 2008; Hoogenboom et al., 2010). However, only electrocorticography (ECoG) can record the brain’s electrical activity across many distant neuronal populations with high spatial and temporal resolution. Thus, in principle, ECoG should support the ability to chart the spatiotemporal evolution of neuronal population activity associated with a specific behavior such as sensorimotor function and to highlight the relationship of properties of this progression to different aspects of behavior or physiology.
Unfortunately, these encouraging properties of ECoG expose a more fundamental problem that has not received much formal attention (but see Makeig et al., 2004; Yeung et al., 2004; Handy, 2005). Specifically, it is well known that the timing of behavior and its concomitant neural activity usually vary substantially across individual trials (Banerjee et al., 2010; DiCarlo and Maunsell, 2005; Fox et al., 2007; Jensen, 1992). This variability in timing greatly reduces our ability to establish the precise timing of neuronal population activity or its relationship with other brain processes, such as modulatory neuronal oscillations, since traditional analytic methods cannot and do not account for this timing variability (see Rey et al. (2015) for review, and Fig. 1 for an illustration). Investigators can mitigate this issue by time-locking their analyses to reference events, such as the time of a stimulus onset or the time of an observable behavior (Thompson et al., 1996; DiCarlo and Maunsell, 2005; Rolls and Tovee, 1994). This strategy can be effective, but only for neuronal populations whose timing is closely related to these events (e.g., neurons in primary motor or sensory areas). In other words, all current analytic techniques for detecting task-related1 activations in ECoG data preferentially detect such activations at locations that are temporally close to the reference events.
Fig. 1.

Cross-trial averaging obscures the detailed temporal structure of cortical activations. (A) Exemplary time courses of the magnitude of neuronal population activity (broadband amplitude envelope; 70–170 Hz), time-locked to stimulus onset, in one motor cortical location in Subject A in eight trials. Cortical activations are brief and demonstrate highly variable onset times (arrows) from trial to trial. (B) Averaging these time courses across all (n = 134) trials yields a broadened average time course (blue line) that does not accurately reflect the structure of activity in single trials (traces show mean ± s.e.m.). (For interpretation of reference to color in this figure legend, the reader is referred to the web version of this article.)
In summary, for these reasons related to signal acquisition and signal analytics, it remains largely unknown how neuronal population activity traverses large-scale brain networks and how properties of the resulting progression relate to behavior or to other physiological mechanisms such as modulatory oscillatory activity. Revealing these relationships to further our understanding of brain function requires the development of new analytic methods that take full advantage of the capabilities of ECoG as a research tool.
Here we describe a procedure for establishing the spatiotemporal evolution of large-scale neural activity by determining from ECoG signals exactly where and when task-related neural activity occurs in individual trials. This multi-step procedure depends almost exclusively on rigorous statistics rather than parameterization. We then validate its efficacy, evaluate the effects of variations in its parameterization, and demonstrate its utility by highlighting two sets of results that could not be readily achieved without such a single-trial approach. The first set of results highlights the precise evolution of task-related neuronal population activity that unfolds across the brain during a sensorimotor task in individual trials. The second set of results highlights the relationship between low-frequency neuronal oscillations and the onset of population-level activity. Finally, we conclude by discussing how the technique presented here could be used in combination with or in lieu of related techniques.
2. ECoG dataset
We derived and validated the algorithmic methods presented in this paper using an ECoG dataset that is described in detail in (Gunduz et al., 2011). In addition, we achieved comparable results on a different dataset that was derived from different subjects who executed a different task using the same methods and parameter choices described in the subsequent sections of this manuscript. The dataset presented in this manuscript consisted of ECoG signals from four human subjects who were patients at Albany Medical College. The subjects gave informed consent for this research and had 97–109 electrodes implanted (subjects A–C over the left hemisphere, subject D over the right hemisphere). We recorded ECoG signals and behavioral responses from a push button using the general-purpose BCI2000 software (Schalk et al., 2004; Schalk and Mellinger, 2010). Previous work conducted in our lab indicate that the latency and jitter of this experimental setup are small relative to the time scales concerned in this study (Wilson et al., 2010). BCI2000 interfaced with eight 16-channel g.USBamp biosignal acquisition devices (g.tec, Graz, Austria) that sampled ECoG signals at 1200 Hz. Electrode contacts distant from epileptic foci and areas of interest were used for reference and ground. The recordings were visually inspected offline; channels that did not contain clear ECoG signals were removed from analysis (67–96 remaining channels).
The subjects were asked to engage in a modified Posner cueing task (Posner, 1980; Posner and Petersen, 1990). They maintained gaze fixation on a cosine grating that was presented in the center of a computer screen. At a random time after the appearance of the cosine grating (between 1.5 and 2.5 s after the grating’s appearance), the grating changed contrast. Subjects were instructed to respond with a button press as soon as they detected the contrast change. We were interested in identifying the cortical process that unfolds from the time of visual stimulus change to the button press. Thus, for the purposes of this manuscript, we will refer to the moment of contrast change as the “visual stimulus onset” or “time zero”. We defined the “task period” as the 1500 ms period after visual stimulus onset (called the “contrast change period” in Gunduz et al. (2011)), and the “baseline period” as the 1500 ms period prior to visual stimulus onset (called the “stimulus period” in Gunduz et al. (2011)). While we refer to the activity detected in the task period as “task-related,” we do not want to imply that this activity is the only neural activity change resulting from engagement in our task. For example, neural activity that reflects attention, goal-directed behavior, and other cognitive processes may precede the time of stimulus presentation, and may manifest itself in amplitude modulations in other frequency bands such as theta (4–8 Hz), alpha (8–12 Hz), or beta (18–25 Hz).
3. Detection algorithm
We were interested in determining precisely where (i.e., which location) and when (i.e., which time) task-related neuronal population activity began in individual trials. Given the significant inter-trial variance in the timing of task-related broadband gamma activity increases, common approaches (such as averaging across trials) to identify these two variables of cortical activation are suboptimal. To address this issue, we designed a sensitive two-stage statistical procedure. The first step in this procedure identified those locations that exhibited significant task-related modulation of broadband gamma activity. The second step then identified activity onsets in individual trials, and used this information to refine our estimate of which locations were task-related by accounting for temporal variability across trials. The details of this procedure are described in the following sections after a brief description of the preprocessing steps that extracted estimates of broadband gamma.
3.1. Preprocessing
The main objective of the detection algorithm described here is to identify, at each location, the onset of cortical population activity in individual trials. This process began by extracting ECoG broadband activity. ECoG broadband activity – frequently reported as activity in the high gamma range (i.e., greater than 70 Hz) – has been shown to index task-related cortical function with sub-centimeter precision (Brunner et al., 2009; Crone et al., 1998; Schalk et al., 2007; Potes et al., 2014; Miller et al., 2012, 2014, 2009a), and is widely believed to reflect the average firing rate of populations of neurons directly underneath the recording electrode (Manning et al., 2009; Whittingstall and Logothetis, 2009; Ray and Maunsell, 2011; Miller et al., 2009b). Thus, we extracted the amplitude envelope of ECoG broadband activity by bandpass-filtering signals between 70 and 170 Hz (3rd-order Butterworth filter; zero phase lag, MATLAB filtfilt function), re-referencing signals to a common average reference (CAR; Schalk et al. (2007)), and then extracting the amplitude envelope of the bandpass-filtered signals using the Hilbert transform. For our analyses of the relationship of low-frequency oscillatory activity to the timing of population activity, we also similarly extracted activity in the alpha (8–12 Hz) band. For all analyses, after bandpass filtering, we low-pass filtered and down-sampled signals to 400 Hz with the MATLAB resample function. Finally, we normalized signals in each trial by subtracting the mean value from the baseline period and dividing by the baseline period’s standard deviation (see equation below, where x′(t) is the normalized value at time point t, x(t) is the original broadband gamma amplitude envelope value at time point t, and μb and σb are the mean and standard deviation of the broadband gamma amplitude envelope values from the baseline period only). Both mean and standard deviation were calculated across all trials and all time points in the baseline period.
3.2. Identification of task-related locations
Given ECoG broadband activity, we then identified the locations and times at which population-activity occurred. To begin to approach this problem, we realized that there are two important challenges in identifying locations that respond to the task. First, preliminary analyses confirmed that task-related activations can occur at a wide range of possible latencies (that are not known a priori for a given location) and that these activations are usually of only brief duration in any given trial (see Fig. 1 for an example from subject A). These realities imply the need for a highly sensitive method, which presumably needs to take advantage of higher order statistics and information about the time course of the activations. Second, it is also desirable to derive a method that results in only one statistical measurement (of p-value) for each location as opposed to one p-value for each of many points in time (since this would imply the generally problematic need for multiple comparison correction not only by location but also by number of statistical tests within location). Hence, to identify locations that respond to the task, we chose a highly sensitive method to identify amplitude modulations across time (the signal-to-noise (SNR) method described in Schalk et al. (2007)). The SNR method relies on ratios of second-order statistics and is capable of capturing information about the time course of the signals.
Using the SNR method, we determined, for each electrode, the total variance across all trials (134, 214, 141, and 155 for subjects A–D, respectively) in the broadband amplitude envelope during the task period (i.e., total variance was calculated by pooling all time samples across all trials in that channel). For the same data, we also determined the mean variance within each of 30 non-overlapping 50-ms bins of the task period (i.e., within-bin variances were calculated by pooling all time samples across all trials within that bin). To obtain SNR ratios, we then divided the total variance from all time series in all trials by the mean variance within each of the thirty 50-ms bins. This procedure resulted in one SNR value for each location. SNR values very close to 1 are indicative of a location whose ECoG broadband activity was not modulated by the task, whereas larger SNR values are indicative of modulation by the task (see Fig. 4A for a conceptual illustration of this procedure). To determine whether the SNR value observed at a particular location was significantly different than that expected by chance alone, we applied a randomization test. Specifically, we tested the null hypothesis that neuronal population activity (as measured by broadband gamma) was not modulated during the task period. Thus, locations with significant/non-significant p-values represent cortical locations whose broadband gamma activity was/was not modulated by the task, respectively. To implement the randomization test, we scrambled the signal by randomly shuffling all samples in each trial’s broadband signal time course 10,000 times2; each time, we obtained a SNR value for this scrambled dataset. This distribution of SNR values models the range of SNRs that would be expected under the null hypothesis (i.e., that there was no significant and consistent modulation of activity at that location during the task period) under the assumption that the autocorrelation in the data is negligible3. We then calculated a p-value for the true SNR value using the cumulative distribution function derived from the resulting distribution. Channels with p-values >0.001 (i.e., channels whose broadband activity did not change during the task period) were excluded from further analyses4. This procedure resulted in 42, 50, 33, and 23 locations for subjects A–D, respectively (large red dots in Fig. 2A).
Fig. 4.

Single-trial detection framework for determining where and when task-related neuronal population activity occurs. (A) Analysis of signal variance (see Methods) in each channel, time-locked to stimulus onset and averaged across trials, identifies locations with activity that was modulated by the task. Task-related locations will exhibit a total variance in the signal much greater than the variance of binned subsections of the same time series (ratio 1; bars depict variances). In locations not related to the task, these variances are approximately the same (ratio ≈ 1). Task-related locations are defined as those with statistically significant activation ratios ((B); see text for statistics). (C) The time course of broadband activity in one trial from one location. For each location, the detection algorithm optimizes a channel-specific threshold by scanning through a series of values applied to all trials ((D) and selecting the threshold value that maximizes the difference between the number of hits detected in the task vs. the baseline period (bar graph in Fig. 4D). In a final step, the algorithm refines its estimates of task-related locations by determining which locations had a statistically significant increase in the number of detected onsets in the task period as compared to the baseline period. This information is used to further refine the previously identified network, resulting in a final definition of the task-related network (arrow to B from subpanel in D).
Fig. 2.

Task-related locations identified at two subsequent stages of the detection algorithm. (A) Locations that passed the first stage of the detection algorithm (SNR screening; see Section 3.2). Small black dots show implanted electrode locations. Large red dots show locations that pass the SNR test. (B) Large black dots show locations that pass the second stage of the detection algorithm (see Section 3.3). (For interpretation of reference to color in this figure legend, the reader is referred to the web version of this article.)
3.3. Detection of activity onsets
In the second stage of our algorithm, we determined the time of activity onset at each of the task-related locations and in each trial. We chose to detect the time of activity onset, rather than the time of maximum broadband activity, because the onset of activity should be an accurate representation of the first action potential volleys that hit the corresponding population of neurons. In contrast, the time of activity maximum will depend on many different factors.
To detect broadband activity onset, we identified the first time point in the task period that exceeded a channel-specific amplitude threshold (Figs. 4 and 3). To account for factors that could alter the magnitude of broadband activity increases in a channel-specific fashion (e.g., different signal-to-noise ratios introduced by variability inherent in the recording setup, such as the varying number of neurons underneath a given electrode that change their activity depending on the task, and physiological variability in the magnitude of activation in different areas of the brain related to the task), we determined each channel’s threshold using an optimization procedure. This procedure systematically varied the threshold between 2 and 6 z-scores in 0.1 z-score increments (see Section 3.1 for details of normalization procedure), and then selected the amplitude threshold that maximized the difference in the number of detections found in the task period and the number of detections found in the baseline period. This can be expressed in the following equation, in which dt(z) and db(z) are the numbers of detections in the task and baseline period, respectively, given a particular threshold of z:
Fig. 3.

The onset of broadband activity can be detected in single trials. (A) Locations of all electrode locations from Subject A (small black dots) and two exemplary locations in motor and visual cortices (blue circle and red polygon, respectively). (B) Individual activity onsets (black dots) from single trial analyses at the location in visual cortex (left) and motor cortex (right). X-axis gives time after stimulus presentation. Y-axis gives trials, sorted by behavioral response time. Colored background shows normalized broadband amplitude envelope activity. In each panel, gray sigmoid traces show the behavioral response time in each trial. As expected, broadband activity onsets occur at a relatively constant time after the stimulus presentation at the location in visual cortex, and with a relatively constant time prior to the behavioral response time at the location in motor cortex. (In the visual channel, the increase in broadband activity after the behavioral onset time is elicited by screen changes that were triggered by the button press.) (For interpretation of reference to color in this figure legend, the reader is referred to the web version of this article.)
With this channel-specific amplitude threshold, our procedure resulted in no more than one detected onset in each trial and for each location. If a channel’s channel-specific threshold was not exceeded in a trial, no onset time was defined in that location for that trial. Fig. 3 shows detected onset times (small black dots in Fig. 3B) for the exemplary motor cortical and visual locations shown in Fig. 3A).
We then used those detected onset times to further refine the selection of task-related electrodes. Specifically, we excluded from further analysis any channel for which the number of detected onsets did not differ statistically between the baseline and task periods. To do this, we again used a randomization test in which we randomly shuffled the labels (“task” and “baseline”) associated with each detection in a location 1000 times to create surrogate distributions of the difference in the number of hits detected in the task period vs. the baseline period (i.e., for each detection, with a probability of 0.5, we either did or did not swap the label – “task” or “baseline” – for that detection). We then modeled the resulting distributions using a Gaussian distribution (distributions passed a Kolmogorov–Smirnov test for normality, p≫0.05), and rejected channels whose true difference in onset detections was not statistically different from the surrogate distribution (p > 0.01). This refinement of the electrode localization procedure reduced the total number of detected locations to 21, 25, 26, and 13 for subjects A–D, respectively (large black dots in Fig. 2B).
In summary, the procedure described above identified those locations in which ECoG broadband activity changed with the task, and also precisely identified the time of onset of broadband activity in individual trials. Its function is summarized in Fig. 4.
4. Validation of detection algorithm
It is possible that the results reported our procedure reflected algorithmic, physiologic or non-physiologic artifacts. The additional validation analyses described below confirm that this almost certainly was not the case.
4.1. Results are not due to algorithmic artifacts
We first ensured that the detected locations were not due to algorithmic problems (e.g., incorrect application of statistics), by establishing that the identified locations were indeed related to the task. To do this, we submitted “catch” trials (in which the visual stimulus never occurred) to the procedure described in Section 3. Since there was no visual stimulus onset and no resulting behavioral response in these trials, the algorithm should not detect any task-activated locations. Indeed, this control analysis did not identify a single task-related location in any of the four subjects. This is in contrast to the 21, 25, 26, and 13 locations (subjects A–D, respectively) that our analyses identified for the trials that included visual stimulus onsets and behavioral responses.
4.2. Results are not due to physiological artifacts
We then confirmed that the detected onset times of broadband activity were physiologically meaningful (i.e., that they reflected task-related activity) by establishing that their trial-to-trial temporal variability was related to the timing of the stimulus or the timing of the behavioral response. Our results showed that the onset time of 90.2% of all 85 task-related locations from the four subjects were significantly related to the times of either the stimulus or the response (Pearson’s coefficient of determination, r2, between activity onset times and behavioral response times or between activity onset times and stimulus onset times, p < 0.05 with Bonferroni correction for number of electrodes in each subject; mean r2 with timing of behavior = 0.22 ± 0.02 (95% Confidence Interval; Fig. 5A); mean r2 with timing of the stimulus = 0.34 ± 0.03 (95% Confidence Interval; Fig. 5B))5. In addition, as may be expected in a visuo-motor task, the timing of activity in task-related locations became progressively more related to the timing of the behavior, and progressively less related to the timing of the stimulus onset as mean onset times increased (Fig. 5C).
Fig. 5.
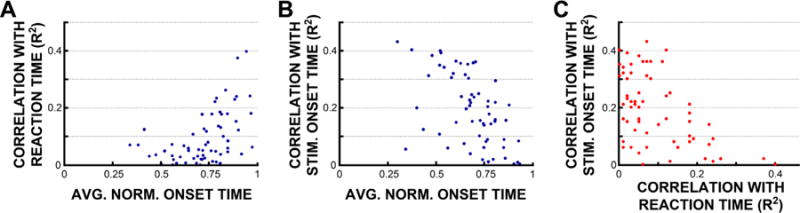
The timing of activity onset is strongly related to the timing of the stimulus, the behavior, or both. (A) Correlations of detected onset times with the behavior (Pearson’s coefficient of determination, r2) in each task-related electrode location (blue dots) from all four subjects as a function of normalized mean onset time (0 = time of stimulus onset, 1 = time of behavior). (B) Same, but as correlations with stimulus onset times. (C) For the same locations, correlation with stimulus onset times as a function of correlation with behavioral response times. (For interpretation of reference to color in this figure legend, the reader is referred to the web version of this article.)
4.3. Results are not due to non-physiological artifacts
To rule out the possible influence of non-physiological artifacts (such as external electrical artifacts or volume conduction), which would result in identification of similar onset times across locations, we confirmed that activity onset times were statistically different across different locations: 73.3 ± 13.9% of all channels in each subject had onset times different from all other channels’ onset times within each subject (i.e., 73.3% of locations exhibited statistically different onset times when compared, one-by-one, to all other task-related channels in that subject; paired one-sided t-tests, p < 0.05). Thus, it is extremely unlikely that our results were due to detection of external artifacts.
5. Parametric evaluation of detection algorithm
The methods described above allowed us to identify the precise onset of task-related activity in individual trials. Although these methods are largely defined by rigorous statistical procedures, they could be affected by the choice of two key parameters (the down-sampling frequency and the number of trials used for establishing a statistical model of the baseline). To evaluate the robustness of the detection algorithm to changes in those two parameters, we performed a series of parametric evaluations. The results are described below and show that across a large range of values, the choice of these parameters has only a very modest effect on the results.
5.1. Effect of downsampling rate
One parameter that could affect outcome measures in our study is the choice of downsampling frequency used for analysis. Because of the inherent trade-off between temporal resolution and noise reduction, this parameter may also influence the sensitivity and specificity of our detector. To test the robustness of our detection algorithm across different choices of this parameter, we executed the same analyses using downsampling frequencies ranging from 50 Hz to 600 Hz in 10 Hz increments, and examined how this choice affected two outcome variables: the correlation of detected activity onsets with the timing of the stimulus or behavior, and the number of detections in the task period versus the baseline period (as measures of sensitivity and specificity, respectively). A higher number of detections in the task period indicates higher sensitivity, whereas a lower number of detection in the baseline period corresponds to higher specificity (because there were fewer false positives). In this analysis, we used only those channels that were identified as primarily hand motor by electrocortical stimulation (ECS) mapping. We did this for two reasons. First, motor channels are the only ones we can assume a priori to have a relatively constant latency offset between brain activity and button press, so a higher correlation of cortical onset times with behavioral onset times in motor channels should be a reasonable indicator that the detector is performing well. Second, since we know that there was a button press in every trial, we expect that there should have been brain activity in motor cortex in every trial as well. Thus, the closer we get to 100% detections during the task period and 0% detections the baseline period, the better the detector’s performance.
Our sensitivity and specificity measures were largely unchanged by the choice of downsampling frequency. The number of activity onsets detected in the task period for motor channels varied by less than 3.1% across all downsampling frequency choices tested (mean sensitivity = 78.8 ± 2.5%; i.e., 78.8% of all trials exhibited an activity onset during the task period). The number of activity onsets detected in the baseline period for motor channels varied by less than 8.2% across all downsampling frequency choices tested (mean sensitivity = 28.9 ± 2.3%).
Results for correlation values in motor channels were also largely unaffected by downsampling frequency, and quickly reached a stable value: at 80 Hz and above, correlations with behavior (r2’s) in motor channels varied by less than 4.04% from an average mean of r2 = 0.12.
5.2. Effect of number of trials submitted to analysis
The detection algorithm described here requires multiple trials on which to operate. The number of trials submitted to analysis affects the normalization step of the procedure because all trials are normalized by the mean and standard deviation calculated from a certain number of trials of the baseline period. Furthermore, the procedure that refines the task-related locations depends on the number of detections in the task and baseline periods. Thus, the algorithm’s ability to detect task-related electrodes will become impaired if too few trials are used (because it becomes increasingly difficult to establish a statistical difference in the number of detections in the baseline and task periods).
To identify the minimum number of trials needed to obtain a stable estimate of a task-related network of locations, we executed our analyses using different numbers of trials. To do this, we used a bootstrap sample-with-replacement technique in which we randomly selected a number of trials to submit to our analyses (minimum of 5 trials in 5-trial increments, up to a maximum equal to the multiple of 5 nearest to without exceeding the total number of trials in each subject), modeled a baseline from the submitted trials, and performed single-trial activity onset detection on these trials. We repeated this procedure 50 times for each number of trials submitted, and examined the average number of locations identified as task-related in each run. As expected, fewer trials tended to yield fewer locations identified as task-related (Fig. 6). As the number of trials increased, the average number of locations approached a stable value at and around the number of locations identified when all trials were submitted for analysis. We defined the minimum number of trials needed for stable algorithmic performance in each subject as the number of trials at which the number of identified task-related locations ceased to become significantly different from the number of task-related locations identified for all trials (paired t-tests, p > 0.05). Under these criteria, we found that an average (median) minimum of 82.5 trials was needed for algorithmic stability. However in most cases 40–60 trials may be sufficient for stable performance (Fig. 6, Subjects A, C, and D).
Fig. 6.

With a sufficient minimum number of trials, the detection procedure produces stable results. Box plots show the average (median) number of locations (y-axis) identified when different numbers of trials (x-axis) are included in the analysis procedure. Upper/lower box bounds and whiskers represent Inter-Quartile Range and 5th/95th percentiles, respectively. In 3 of 4 subjects, ∼40–60 trials are sufficient for stable algorithmic performance.
6. Results
The sections above described a novel method to establish the spatiotemporal evolution of population-level activity across the cortex in single trials, demonstrated that the results were almost certainly not due to different types of artifacts, and illustrated that our method was very robust to changes in its only two parameters. In this section, we highlight two sets of results that could not readily be achieved using traditional methods.
6.1. Realigning to activity onset “de-blurs” cross-trial averages
Our method allows us to avoid time-locking cross-trial averages to external reference events (e.g., the time of a stimulus onset or a button press) and to instead use internal, brain activity-based events (i.e., the precise onset time of neuronal population activity at each location and within individual trials). A subsequent analysis (such as cross-trial averaging) can thereby account for the inter-trial variability in broadband gamma onset times. Hence, in the absence of any inter-trial variance in activity timing, cross-trial averaging should yield the same results irrespective of whether signals are time-locked to the onsets of a visual stimulus (“traditional method”) or single-trial activity onsets (“new method”).
The results illustrate a surprisingly large difference between the traditional and new method. Specifically, Fig. 7A gives average broadband gamma activity (in color) for the second after stimulus onset (x-axis) for all 21 locations (y-axis) in Subject A. The locations are sorted by average onset time. Average broadband gamma activity appears smeared (and qualitatively similar to the example shown in Fig. 1B for one location) and to last hundreds of milliseconds. A temporal progression is difficult to discern. In remarkable contrast, Fig. 7B gives the exact same data, except that prior to averaging, we aligned broadband gamma signals to the onset of activity rather than the onset of the visual stimulus. (At each location, the average broadband time course was then shifted in time to the average onset time to facilitate visual comparison with (A).) The average broadband gamma time courses show a surprisingly short “gamma burst” and effectively highlight the detailed progression of broadband activity across space and time (see also Fig. 1C). The brevity of the burst can be conveniently explained by the inter-trial variability of bursts across trials. To illustrate, consider the example shown in Fig. 4C and 4D. Activity appears to consist of trains of gamma bursts that together last a couple hundred milliseconds, but each lasts ⪅50 ms each. Because cross-trial averages were aligned to the onset of the first detected burst, and the timing of subsequent bursts varies from trial to trial, only the first in the series will survive the averaging process.
Fig. 7.

Time-locking signals to detected activity onsets in single trials before averaging “de-blurs” cross-trial averages. (A) Averaged time courses of broadband gamma activity from all 21 task-related locations in Subject A, time-locked to stimulus onset. Locations on the y-axis are sorted by the average onset time. (B) Averaged time courses from the same locations in A, time-locked to onset of broadband gamma increase. (Signals are offset in time by their average onset time to facilitate comparison with (A)). This method reveals brief periods of activations that propagate across the cortex. (C) The “average” spatiotemporal evolution of activity from the same subject. Task-related electrode locations are colored on a spectrum that maps to their median onset times during the task.
6.2. Activity onsets are trough-locked to alpha oscillations
Time-locking to the onset of broadband gamma activity not only allows us to more precisely investigate the average time course of broadband gamma, but also to more accurately capture and study the relationship of broadband gamma activity with modulatory activity of low-frequency oscillations. Our results indicate that these oscillations have a clear relationship with the onset times of broadband activity. Fig. 8 shows oscillatory activity in the alpha6 band (red trace) and broadband gamma activity (blue trace) in one exemplary location in motor cortex in Subject C, averaged across all trials and time-locked to the timing of the stimulus (A) or onset of broadband gamma activity (B). Figure (B), but not (A), clearly shows that the onset of broadband activity occurs during the trough of oscillatory activity in the alpha band.
Fig. 8.

The onset of neuronal population activity occurs during the trough of alpha oscillations. (A) Averaged normalized time courses of broadband activity (blue trace) and alpha/mu activity (red trace) in one motor location from Subject C (traces show mean ± s.e.m.). No relationship between broadband dynamics and oscillatory activity can be seen. (B) Normalized time courses from the same location, but re-aligned to activity onset times in individual trials before averaging. Note the robust relationship between the downward trough of the alpha oscillation and the onset time of neuronal population activity. Also note the brevity of the population activation.
7. Discussion
7.1. Summary
In this paper, we described a method for establishing the spatiotemporal evolution of population activity across the cortex by determining the precise onset time of broadband gamma activity in individual trials using electrocorticographic (ECoG) signals. The technique also identifies all locations whose broadband gamma activity is related to the task, allowing investigators to delineate large-scale, task-related networks across large areas of the cortex. We applied our method to the problem of identifying the precise spatiotemporal progression of task-related cortical activity that implements a simple sensorimotor process in individual trials. We then established that the timing of this progression is closely related to the timing of task variables (i.e., the time of stimulus onset or the time of a behavioral response), and demonstrated that the onset time of population-level activity generally occurs during the trough of underlying low-frequency oscillations in the alpha band. Thus, the method described herein enables novel neuroscientific investigations of task-related neuronal population activity in the brain.
We are not the first to consider the need for and potential usefulness of single-trial analytic techniques (Rey et al., 2015; Banerjee et al., 2010; DiCarlo and Maunsell, 2005). They have been shown to provide important benefits in a wide range of neuroscientific domains, such as the study of learning (Tort et al., 2009; Igarashi et al., 2014), memory (Fernandez et al., 1999; Osipova et al., 2006), perception (Busch et al., 2009), and decision making (Belchior et al., 2014). The principle difference between ours and other techniques is the novel ability to take advantage of simultaneous high-resolution measurements from multiple populations of cells and track the evolution of their activity across large areas of the brain. In contrast, other techniques are typically restricted in their application to either high-resolution measurements taken from one or a few isolated population(s) of cells (such as in analyses of single-unit or local field potential (LFP) recordings), or to low-resolution resolution measurements taken across large areas of the brain (such as analyses applied to scalp EEG recordings). Nevertheless, the technique presented here may also be useful to detect changes in other signals, such as EEG changes in the amplitude of low-frequency oscillations.
Another strength of our technique is that it makes no or only very minimal assumptions about timing variance across trials or low temporal jitter in data, and does not require long periods of time or large numbers of trials in which to accumulate information. Indeed, our procedure provides a way to identify task-related locations in a manner that is largely robust against temporal jitter across trials. Most traditional methods begin by averaging data across trials in the task period in order to model task conditions and to inform subsequent single-trial detections/analyses (Ahmadi and Quian Quiroga, 2013; Banerjee et al., 2010), and perform no additional steps to account for temporal jitter across trials. Therefore, in locations with a vast amount of temporal jitter in the neural response from trial to trial, the shape of the cross-trial average will be flattened and smeared out across time (e.g. Figs. 1B and 8A; but see Navajas et al. (2013)). This makes any statistics aimed at detecting task-related increases in activity relative to a baseline condition less sensitive, and consequently biases detections such that activity onsets with low jitter will be preferentially detected compared to activity onsets with high jitter. Our technique is subject to this issue only in its initial stage, in which it identified task-related locations. We mitigate this issue further by employing a highly sensitive statistical test (see Section 3.2). The subsequent activity onset detection component of the algorithm is completely insensitive to temporal jitter across trials. In a related point, our procedure does not depend on inter-subject, inter-trial, or intra-trial statistics (e.g., temporal memory components) for its onset detection. Thus, while it cannot benefit from such statistics to improve detection performance, its results are also completely void of any temporal bias that may result from the use of such statistics.
7.2. Implications
Our results have several important implications for future research. First and foremost, they suggest that existing methods for detecting task-related activations and for establishing functional connectivity between brain regions almost certainly have important deficiencies. Specifically, the typical method to detect task-related activations (cross-trial averaging) preferentially detects such activations whose underlying timing of neural activity is temporally close to the reference event against which trials are aligned prior to averaging. In other words, with current methods, the temporal duration of task-related activations will increase, and their amplitude decrease, with increasing temporal distance from the reference event. It is likely that this issue contributes greatly to the observation that averaged gamma activity in brain regions not associated with primary sensory processing is generally smaller in amplitude and longer in duration (Pei et al., 2011; Leuthardt et al., 2012; Fukuda et al., 2010).
The same issue also affects all current methods to compute functional connectivity. For example Granger Causality (Granger, 1969) assumes not only that signals are stationary but also that the “sending” and “receiving” locations have a constant timing relationship (Friston, 2009). The results presented here (Figs. 1, 7, and 8) clearly demonstrate that this is not the case. Instead, neuronal population activity is highly non-stationary (i.e., it does not vary about a mean) and exhibits highly variable timing (i.e., the timing of activity in two functionally connected locations will not have a constant offset). Future work is needed to develop appropriate algorithmic techniques to establish functional connectivity in brain signals despite these physiological realities.
7.3. Limitations
There are some caveats and limitations of our method that warrant discussion. For example, some locations in our task clearly showed a bimodal response pattern (i.e., exhibited robust responses to both the stimulus and to the behavior). Our current technique can only identify the initial, but not subsequent, onset of population-level activity. Similarly, it cannot determine how often population-level activity occurs.
Although our detection algorithm performed well at detecting task-related activity onsets (as evidenced by the high degree of correlation between detected onset times and task variables), there were some clear outliers in detected activity onset times. Depending on subsequent statistical treatment, these outliers may have a substantial effect on the results, in particular for certain estimations using parametric techniques that depend on second-order statistics (such as correlation, standard deviations). Future adaptations of our algorithm could consider the addition of an outlier rejection component. For example, in reaction-time data sets like ours, one could fit a logistic function to each location’s detected activity onsets and discard detections outside of some reasonably defined boundary.
A final point to consider is that, in some cases, an experimenter may wish to retain information conveyed through temporal variability in onset timing rather than correcting for it. For example, when a subject processes complex stimuli, timing variability in population activity onsets may actually carry important information about neuronal processing and the stimulus.
8. Conclusion
The ability to accurately identify the spatiotemporal evolution of task-related population activity onsets in single trials gives investigators a powerful new tool with which to study large-scale cortical processes. Thus, it should prove useful for identifying the currently obscured neural patterns shrouded within Sherrington’s enchanted loom. Our technique may find its greatest benefit when applied to cortical surface recordings (ECoG), because they reveal the progression of neural activity across large areas of the brain, but could also be applied to other neurophysiological signals such as local field potentials (LFPs).
Supplementary Material
HIGHLIGHTS.
We describe a procedure to establish the evolution of neural activity across the cortex.
It localizes where/when task-related population activity occurs in single trials.
This provides a powerful and novel tool to study task-related brain function.
Acknowledgments
This work was supported by the NIH (EB00856, EB006356 and EB018783), the US Army Research Office (W911NF-08-1-0216, W911NF-12-1-0109, W911NF-14-1-0440) and Fondazione Neurone. The authors thank Vyassa Baratham for insightful comments and discussion on methodology.
Appendix A. Supplementary data
Supplementary data associated with this article can be found, in the online version, at http://dx.doi.org/10.1016/j.jneumeth.2016.06.024.
Footnotes
We will use the term “task-related” to refer to activity that occurs preferentially during a behavioral task. We do not use it to describe activity that is related to the manipulation of a task variable (i.e., a differential characterization).
Later analyses showed that using 1000 or 2000 permutations achieved the same results.
Quantitative analysis of our data showed that autocorrelation in broadband gamma signals dropped to a median of only 5.3% of its normalized maximum at a lag time of 50 ms. For datasets in which there is expected to be substantial auto-correlation in the data, the randomization test may need to be modified to take autocorrelation into account.
For datasets that have a much larger numbers of electrodes, it may prove beneficial to employ additional statistical techniques that control the family-wise error rate (Nichols and Hayasaka, 2003).
By way of comparison, the coefficient of determination (r2) between stimulus onset times and behavioral response times was 0.10.
In motor cortex, activity in the 8–12 Hz band is commonly referred to as a “mu rhythm”. For simplicity and consistency, we use the term alpha to refer to activity in this frequency band at all cortical locations.
References
- Ahmadi M, Quian Quiroga R. Automatic denoising of single-trial evoked potentials. NeuroImage. 2013 Feb;66:672–680. doi: 10.1016/j.neuroimage.2012.10.062. [DOI] [PubMed] [Google Scholar]
- Banerjee A, Dean HL, Pesaran B. A likelihood method for computing selection times in spiking and local field potential activity. J Neurophysiol. 2010 Dec;104(6):3705–3720. doi: 10.1152/jn.00036.2010. [DOI] [PMC free article] [PubMed] [Google Scholar]
- Belchior H, Lopes-Dos-Santos V, Tort ABL, Ribeiro S. Increase in hippocampal theta oscillations during spatial decision making. Hippocampus. 2014 Jun;24(6):693–702. doi: 10.1002/hipo.22260. [DOI] [PMC free article] [PubMed] [Google Scholar]
- Brunner P, Ritaccio AL, Lynch TM, Emrich JF, Wilson JA, Williams JC, Aarnoutse EJ, Ramsey NF, Leuthardt EC, Bischof H, Schalk G. A practical procedure for real-time functional mapping of eloquent cortex using electrocorticographic signals in humans. Epilep Behav: E&B. 2009 Jul;15(3):278–286. doi: 10.1016/j.yebeh.2009.04.001. [DOI] [PMC free article] [PubMed] [Google Scholar]
- Busch NA, Dubois J, VanRullen R. The phase of ongoing EEG oscillations predicts visual perception. J Neurosci: Off J Soc Neurosci. 2009 Jun;29(24):7869–7876. doi: 10.1523/JNEUROSCI.0113-09.2009. [DOI] [PMC free article] [PubMed] [Google Scholar]
- Clark V, Keil K, Maisog J, Courtney S, Ungerleider L, Haxby J. Functional magnetic resonance imaging of human visual cortex during face matching: a comparison with positron emission tomography. Neuroimage. 1996;4(1):1–15. doi: 10.1006/nimg.1996.0025. [DOI] [PubMed] [Google Scholar]
- Crone NE, Miglioretti DL, Gordon B, Sieracki JM, Wilson MT, Uematsu S, Lesser RP. Functional mapping of human sensorimotor cortex with electrocorticographic spectral analysis. I. Alpha and beta event-related desynchronization. Brain. 1998 Dec;121(Pt 12):2271–2299. doi: 10.1093/brain/121.12.2271. [DOI] [PubMed] [Google Scholar]
- DiCarlo JJ, Maunsell JHR. Using neuronal latency to determine sensory-motor processing pathways in reaction time tasks. J Neurophysiol. 2005;93(5):2974–2986. doi: 10.1152/jn.00508.2004. [DOI] [PubMed] [Google Scholar]
- Fernandez G, Effern A, Grunwald T, Pezer N, Lehnertz K, Dumpelmann M, Van Roost D, Elger CE. Real-time tracking of memory formation in the human rhinal cortex and hippocampus. Science. 1999 Sep;285(5433):1582–1585. doi: 10.1126/science.285.5433.1582. [DOI] [PubMed] [Google Scholar]
- Fox MD, Snyder AZ, Vincent JL, Raichle ME. Intrinsic fluctuations within cortical systems account for intertrial variability in human behavior. Neuron. 2007;56(1):171–184. doi: 10.1016/j.neuron.2007.08.023. [DOI] [PubMed] [Google Scholar]
- Friston K. Causal modelling and brain connectivity in functional magnetic resonance imaging. PLoS Biol. 2009 Feb;7(2):e33. doi: 10.1371/journal.pbio.1000033. [DOI] [PMC free article] [PubMed] [Google Scholar]
- Fukuda M, Rothermel R, Juhász C, Nishida M, Sood S, Asano E. Cortical gamma-oscillations modulated by listening and overt repetition of phonemes. NeuroImage. 2010 Feb;49(3):2735–2745. doi: 10.1016/j.neuroimage.2009.10.047. [DOI] [PMC free article] [PubMed] [Google Scholar]
- Georgopoulos A, Taira M, Lukashin A. Cognitive neurophysiology of the motor cortex. Science. 1993;260(5104):47–52. doi: 10.1126/science.8465199. [DOI] [PubMed] [Google Scholar]
- Georgopoulos AP, Lurito JT, Petrides M, Schwartz AB, Massey JT. Mental rotation of the neuronal population vector. Science. 1989 Jan;243(4888):234–236. doi: 10.1126/science.2911737. [DOI] [PubMed] [Google Scholar]
- Granger C. Investigating causal relationships by econometric models and cross-spectral methods. Econometrica. 1969;37(3):424–438. [Google Scholar]
- Gunduz A, Brunner P, Daitch A, Leuthardt EC, Ritaccio AL, Pesaran B, Schalk G. Neural correlates of visual-spatial attention in electrocorticographic signals in humans. Front Hum Neurosci. 2011;5:89. doi: 10.3389/fnhum.2011.00089. [DOI] [PMC free article] [PubMed] [Google Scholar]
- Handy TC. Event-Related Potentials: A Methods Handbook. MIT Press; 2005. [Google Scholar]
- Hoogenboom N, Schoffelen JM, Oostenveld R, Fries P. Visually induced gamma-band activity predicts speed of change detection in humans. Neuroimage. 2010;51(3):1162–1167. doi: 10.1016/j.neuroimage.2010.03.041. [DOI] [PubMed] [Google Scholar]
- Igarashi KM, Lu L, Colgin LL, Moser MB, Moser EI. Coordination of entorhinal–hippocampal ensemble activity during associative learning. Nature. 2014 Jun;510(7503):143–147. doi: 10.1038/nature13162. [DOI] [PubMed] [Google Scholar]
- Jensen AR. The importance of intraindividual variation in reaction time. Personal Individ Diff. 1992;13:869–881. [Google Scholar]
- Leavitt F. EEG activation and reaction time. J Exp Psychol. 1968;77(2):194–199. 199. doi: 10.1037/h0025816. [DOI] [PubMed] [Google Scholar]
- Leuthardt EC, Pei XM, Breshears J, Gaona C, Sharma M, Freudenberg Z, Barbour D, Schalk G. Temporal evolution of gamma activity in human cortex during an overt and covert word repetition task. Front Hum Neurosci. 2012 May;6:99. doi: 10.3389/fnhum.2012.00099. [DOI] [PMC free article] [PubMed] [Google Scholar]
- Makeig S, Debener S, Onton J, Delorme A. Mining event-related brain dynamics. Trends Cogn Sci. 2004 May;8(5):204–210. doi: 10.1016/j.tics.2004.03.008. [DOI] [PubMed] [Google Scholar]
- Manning JR, Jacobs J, Fried I, Kahana MJ. Broadband shifts in local field potential power spectra are correlated with single-neuron spiking in humans. J Neurosci. 2009;29(43):13613–13620. doi: 10.1523/JNEUROSCI.2041-09.2009. [DOI] [PMC free article] [PubMed] [Google Scholar]
- Miller K, Zanos S, Fetz E, Den Nijs M, Ojemann J. Decoupling the cortical power spectrum reveals real-time representation of individual finger movements in humans. J Neurosci. 2009a;29(10):3132–3137. doi: 10.1523/JNEUROSCI.5506-08.2009. [DOI] [PMC free article] [PubMed] [Google Scholar]
- Miller KJ, Hermes D, Honey CJ, Hebb AO, Ramsey NF, Knight RT, Ojemann JG, Fetz EE. Human motor cortical activity is selectively phase-entrained on underlying rhythms. PLoS Computat Biol. 2012 Sep;8(9):e1002655. doi: 10.1371/journal.pcbi.1002655. [DOI] [PMC free article] [PubMed] [Google Scholar]
- Miller KJ, Honey CJ, Hermes D, Rao RP, denNijs M, Ojemann JG. Broadband changes in the cortical surface potential track activation of functionally diverse neuronal populations. Neuroimage. 2014;85:711–720. doi: 10.1016/j.neuroimage.2013.08.070. [DOI] [PMC free article] [PubMed] [Google Scholar]
- Miller KJ, Sorensen LB, Ojemann JG, Den Nijs M. Power-law scaling in the brain surface electric potential. PLoS Computat Biol. 2009b;5(12):e1000609. doi: 10.1371/journal.pcbi.1000609. [DOI] [PMC free article] [PubMed] [Google Scholar]
- Navajas J, Ahmadi M, Quian Quiroga R. Uncovering the mechanisms of conscious face perception: a single-trial study of the n170 responses. J Neurosci: Off J Soc Neurosci. 2013 Jan;33(4):1337–1343. doi: 10.1523/JNEUROSCI.1226-12.2013. [DOI] [PMC free article] [PubMed] [Google Scholar]
- Newsome WT, Britten KH, MJ A. Neuronal correlates of a perceptual decision. Nature. 1989 Sep;341(6237):52–54. doi: 10.1038/341052a0. [DOI] [PubMed] [Google Scholar]
- Nichols T, Hayasaka S. Controlling the familywise error rate in functional neuroimaging: a comparative review. Stat Methods Med Res. 2003 Oct;12(5):419–446. doi: 10.1191/0962280203sm341ra. [DOI] [PubMed] [Google Scholar]
- Osipova D, Takashima A, Oostenveld R, Fernández G, Maris E, Jensen O. Theta and gamma oscillations predict encoding and retrieval of declarative memory. J Neurosci: Off J Soc Neurosci. 2006 Jul;26(28):7523–7531. doi: 10.1523/JNEUROSCI.1948-06.2006. [DOI] [PMC free article] [PubMed] [Google Scholar]
- Pei X, Leuthardt EC, Gaona CM, Brunner P, Wolpaw JR, Schalk G. Spatiotemporal dynamics of electrocorticographic high gamma activity during overt and covert word repetition. NeuroImage. 2011 Feb;54(4):2960–2972. doi: 10.1016/j.neuroimage.2010.10.029. [DOI] [PMC free article] [PubMed] [Google Scholar]
- Pesaran B, Pezaris JS, Sahani M, Mitra PP, Andersen RA. Temporal structure in neuronal activity during working memory in macaque parietal cortex. Nat Neurosci. 2002 Aug;5(8):805–811. doi: 10.1038/nn890. [DOI] [PubMed] [Google Scholar]
- Posner MI. Orienting of attention. Quart J Exp Psychol. 1980 Feb;32(1):3–25. doi: 10.1080/00335558008248231. [DOI] [PubMed] [Google Scholar]
- Posner MI, Petersen SE. The attention system of the human brain. Annu Rev Neurosci. 1990;13:25–42. doi: 10.1146/annurev.ne.13.030190.000325. [DOI] [PubMed] [Google Scholar]
- Potes C, Brunner P, Gunduz A, Knight RT, Schalk G. Spatial and temporal relationships of electrocorticographic alpha and gamma activity during auditory processing. NeuroImage. 2014;97:188–195. doi: 10.1016/j.neuroimage.2014.04.045. [DOI] [PMC free article] [PubMed] [Google Scholar]
- Ray S, Maunsell JH. Different origins of gamma rhythm and high-gamma activity in macaque visual cortex. PLoS Biol. 2011;9(4):e1000610. doi: 10.1371/journal.pbio.1000610. [DOI] [PMC free article] [PubMed] [Google Scholar]
- Rey HG, Ahmadi M, Quian Quiroga R. Single trial analysis of field potentials in perception, learning and memory. Curr Opin Neurobiol. 2015 Apr;31:148–155. doi: 10.1016/j.conb.2014.10.009. [DOI] [PubMed] [Google Scholar]
- Rolls ET, Tovee MJ. Processing speed in the cerebral cortex and the neurophysiology of visual masking. Proc Biol Sci/R Soc. 1994 Jul;257(1348):9–15. doi: 10.1098/rspb.1994.0087. [DOI] [PubMed] [Google Scholar]
- Rumeau C, Tzourio N, Murayama N, Peretti-Viton P, Levrier O, Joliot M, Mazoyer B, Salamon G. Location of hand function in the sensorimotor cortex: MR and functional correlation. Am J Neuroradiol. 1994 Mar;15(3):567–572. [PMC free article] [PubMed] [Google Scholar]
- Schalk G, Kubánek J, Miller KJ, Anderson NR, Leuthardt EC, Ojemann JG, Limbrick D, Moran D, Gerhardt LA, Wolpaw JR. Decoding two-dimensional movement trajectories using electrocorticographic signals in humans. J Neural Eng. 2007 Sep;4(3):264–275. doi: 10.1088/1741-2560/4/3/012. [DOI] [PubMed] [Google Scholar]
- Schalk G, McFarland DJ, Hinterberger T, Birbaumer N, Wolpaw JR. BCI2000: a general-purpose brain-computer interface (BCI) system. IEEE Trans Biomed Eng. 2004 Jun;51(6):1034–1043. doi: 10.1109/TBME.2004.827072. [DOI] [PubMed] [Google Scholar]
- Schalk G, Mellinger J. A Practical Guide to Brain–Computer Interfacing with BCI 2000. Springer; 2010. [Google Scholar]
- Sherrington C. Man on His Nature. Cambridge University Press; 1942. [Google Scholar]
- Takeda Y, Yamanaka K, Yamamoto Y. Temporal decomposition of {EEG} during a simple reaction time task into stimulus- and response-locked components. Neuroimage. 2008;39(2):742–754. doi: 10.1016/j.neuroimage.2007.09.003. [DOI] [PubMed] [Google Scholar]
- Thompson KG, Hanes DP, Bichot NP, Schall JD. Perceptual and motor processing stages identified in the activity of macaque frontal eye field neurons during visual search. J Neurophysiol. 1996 Dec;76(6):4040–4055. doi: 10.1152/jn.1996.76.6.4040. [DOI] [PubMed] [Google Scholar]
- Tort ABL, Komorowski RW, Manns JR, Kopell NJ, Eichenbaum H. Theta-gamma coupling increases during the learning of item-context associations. Proc Natl Acad Sci U S A. 2009 Dec;106(49):20942–20947. doi: 10.1073/pnas.0911331106. [DOI] [PMC free article] [PubMed] [Google Scholar]
- Whittingstall K, Logothetis NK. Frequency-band coupling in surface eeg reflects spiking activity in monkey visual cortex. Neuron. 2009;64(2):281–289. doi: 10.1016/j.neuron.2009.08.016. [DOI] [PubMed] [Google Scholar]
- Wilson JA, Mellinger J, Schalk G, Williams J. A procedure for measuring latencies in brain-computer interfaces. IEEE Trans Biomed Eng. 2010;57(7):1785–1797. doi: 10.1109/TBME.2010.2047259. [DOI] [PMC free article] [PubMed] [Google Scholar]
- Yeung N, Bogacz R, Holroyd CB, Cohen JD. Detection of synchronized oscillations in the electroencephalogram: an evaluation of methods. Psychophysiology. 2004 Nov;41(6):822–832. doi: 10.1111/j.1469-8986.2004.00239.x. [DOI] [PubMed] [Google Scholar]
- Yousry TA, Schmid UD, Alkadhi H, Schmidt D, Peraud A, Buettner A, Winkler P. Localization of the motor hand area to a knob on the precentral gyrus. a new landmark. Brain. 1997;120(1):141–157. doi: 10.1093/brain/120.1.141. [DOI] [PubMed] [Google Scholar]
Associated Data
This section collects any data citations, data availability statements, or supplementary materials included in this article.