Abstract
Quantitative ultrasound elastography is increasingly being used in the assessment of chronic liver disease. Many studies have reported ranges of liver shear wave velocities values for healthy individuals and patients with different stages of liver fibrosis. Nonetheless, ongoing efforts exist to stabilize quantitative ultrasound elastography measurements by assessing factors that influence tissue shear wave velocity values, such as food intake, body mass index (BMI), ultrasound scanners, scanning protocols, ultrasound image quality, etc. Time-to-peak (TTP) methods have been routinely used to measure the shear wave velocity. However, there is still a need for methods that can provide robust shear wave velocity estimation in the presence of noisy motion data. The conventional TTP algorithm is limited to searching for the maximum motion in time profiles at different spatial locations. In this study, two modified shear wave speed estimation algorithms are proposed. The first method searches for the maximum motion in both space and time (spatiotemporal peak, STP); the second method applies an amplitude filter (spatiotemporal thresholding, STTH) to select points with motion amplitude higher than a threshold for shear wave group velocity estimation. The two proposed methods (STP and STTH) showed higher precision in shear wave velocity estimates compared to TTP in phantom. Moreover, in a cohort of 14 healthy subjects STP and STTH methods improved both the shear wave velocity measurement precision and the success rate of the measurement compared to conventional TTP.
Index Terms: Elastography
I. Introduction
Cronic liver damage is characterized by an increase in liver stiffness as a consequence of increased extracellular matrix. Noninvasive quantification of soft tissue elasticity by using magnetic resonance elastography (MRE) [1], transient elastography (TE) [2], quasi-static elastography [3], acoustic radiation force impulse imaging (ARFI) [4], shear wave elasticity imaging (SWEI) [5] and supersonic shear wave imaging (SSI) [6] have shown great potential in the noninvasive assessment of liver fibrosis [7]-[12]. SWEI methods are attractive as shear waves are generated inside the tissue of interest; the shear wave propagation is then monitored in space and time by a pulse-echo ultrasound and the soft tissue stiffness is estimated from the shear wave propagation velocity.
There are several methods for estimating the shear wave velocity from the shear wave motion data: the algebraic inversion method [13], the local frequency estimation (LFE) method [14], correlation-based methods [15]-[18], Radon transform methods [19], [20], and the time-to-peak (TTP) method [21]. The LFE method does not require second order derivative calculations as in algebraic inversion methods. Both methods have been applied to MRE data [7], [22], but are limited in their use in ultrasound applications because of the level of noise in ultrasound-based motion signals. Correlation-based methods introduced by McLaughlin, et al., [15] find the shear wave arrival time by cross-correlating the displacement time history of a spatial point against the displacement time history at a nearby reference point. The shear wave arrival time is then used in a time-of-flight algorithm to resolve the shear wave group velocity. Cross-correlation based methods are used to create shear wave group velocity maps as in SSI [21], Spatially-Modulated Ultrasound Radiation Force (SMURF) [17], and Comb-Push Ultrasound Shear Elastography (CUSE) [18]. The Radon transform method uses the Radon transform or a Radon sum on the spatiotemporal shear wave data to estimate the shear wave group velocity [19], [20].
The most common method is the TTP method, which assumes a fixed propagation direction. The shear wave peak time is estimated at each spatial location, and the shear wave velocity is calculated by a linear regression of those peak times versus distance. The TTP method has been successfully used with ultrasound SWEI methods [10], [11]; however, in vivo motion characteristics such as low signal-to-noise ratio, physiological motion, tissue inhomogeneity and viscoelasticity can affect the shear wave velocity estimation. Different techniques have been suggested to improve the outcome of the TTP algorithm for in vivo applications, for instance by averaging shear wave velocity estimation over locations within an image or repeating measurements and using the goodness of linear fit to remove failed measurements. Recently, an iterative linear fitting method called Random Sample Consensus (RANSAC) was proposed to improve the robustness of the TTP method [23]. The TTP with the RANSAC method was successfully applied to patients with liver fibrosis and showed improved diagnostic accuracy [23]. Although RANSAC implementation improves the shear wave group velocity estimation for the TTP method, the RANSAC algorithm is working in the presence of gross outliers that usually skew the model fitting and lower the goodness-of-fit metrics. There is still the need for methods that can improve shear wave velocity estimation in the presence of noisy motion data.
In this study a modification of the TTP algorithm is proposed. The conventional TTP algorithm is limited to searching for the maximum motion in time profiles at different spatial locations. The proposed method, spatiotemporal peak (STP), searches for the maximum motion in both space and time. Moreover, this study proposes not only using the spatiotem-poral maximum motion but also applying an amplitude filter (spatiotemporal thresholding, STTH) to select all points with motion higher than a threshold for shear wave group velocity estimation. The STP and the STTH methods increase the number of data points used for estimation of the linear fit to provide a more robust estimation of the shear wave velocity. The two proposed methods (STP and STTH) are compared to the TTP algorithm. In all methods, a RANSAC algorithm is used to perform the linear fits. The shear wave group velocity estimation methods are evaluated in tissue mimicking phantoms to illustrate the proposed methods and in liver in vivo.
II. Methods
A. Time-to-peak (TTP)
The lateral time-to-peak (TTP) algorithm finds the time where the shear wave displacement is maximum for each lateral location [21]. If the displacement spatiotemporal data is given by u(x,t), the TTP method searches for the time instance that gives the shear wave peak for each spatial location, i, over all I locations (i = [1:I])..
| (1) |
The arg {·} operator is intended to obtain the indices for the points related to the maximum of the displacement profiles and is used likewise throughout the paper. Figs. 1(a) and 1(b) illustrate the TTP method. The data shown are from an acquisition in a tissue mimicking phantom (shear wave liver fibrosis model 039, Phantom 1, CIRS Inc., Norfolk, VA) without interpolation of the temporal and spatial profiles. The rate at which the TTP changes with lateral position is evaluated using the RANSAC algorithm (for details refer to [23]).
Fig. 1.
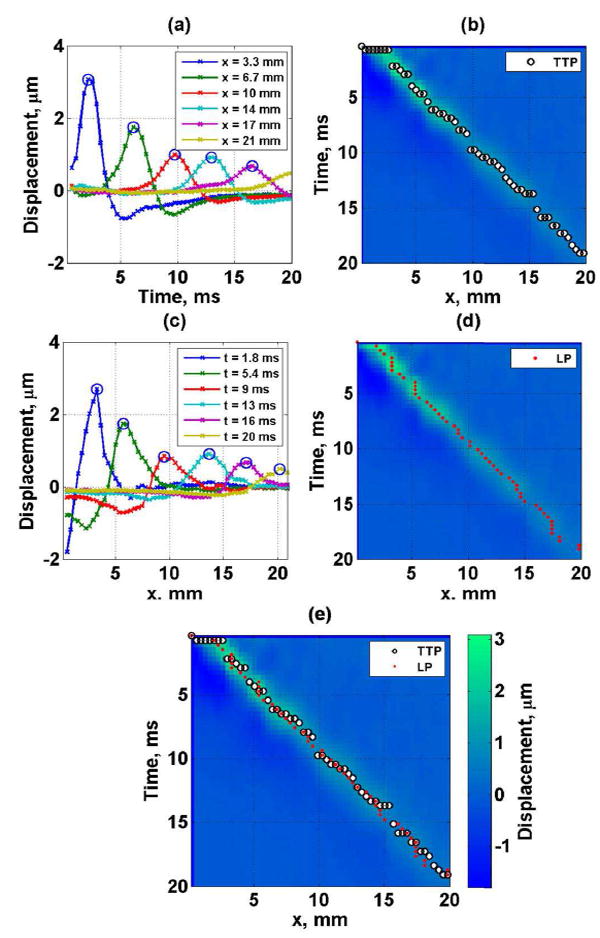
Tissue mimicking phantom experimental data. (a) shear wave displacement as a function of lateral location (the circles represent the time-to-peak (TTP)), (b) spatiotemporal shear wave displacement map with TTP locations (black and white circles), (c) shear wave spatial profiles at different time instances (the circles represent the lateral location peak (LP)), (d) spatiotemporal shear wave displacement map with LP locations (red closed circles) and (e) spatiotemporal shear wave displacement map with combination of TTP (black and white circles) and LP (red closed circles) locations.
B. Spatiotemporal peak method (STP)
In addition to finding the TTP at each lateral location (Eq.(1)), the spatiotemporal peak method (STP) also finds the lateral location at which the maximum displacement occurs (lateral peak, LP) at a given time instance. The spatial profile for each time instance, j, over all J time points is searched (j = [1:J]), as shown in Figs. 1(c) and 1(d).
| (2) |
The STP method combines the TTPi and the LPj in a single set, S, as illustrated in Fig. 1(e). As observed in Fig. 1(e) the lateral peaks (LP) provide independent information that is not used in the TTP method. In some cases the LP and TTP overlaps nonetheless the majorities are independent.
| (3) |
As with the TTP method, the RANSAC algorithm is used on set S to perform a linear model fit.
C. Spatiotemporal thresholding method (STTH)
Instead of using the spatiotemporal locations with maximum displacement along both time and lateral dimensions, the spatiotemporal thresholding (STTH) method uses all locations with motion higher than a threshold based on the local maximum. Both temporal and spatial directions are searched and the final data points are grouped into a single map. Fig. 2 illustrates the STTH method. The data shown are from an acquisition in a tissue mimicking phantom (shear wave liver fibrosis model 039, Phantom 1, CIRS Inc., Norfolk, VA) without interpolation of the temporal and spatial profiles. For each temporal profile at location xi , u (xi , t), the displacement profile is normalized to obtain uN (xi, t), as illustrated in Figs. 2(a) and 2(b) with a threshold of 0.80.
| (4) |
and a threshold, T , is applied to obtain
| (5) |
Fig. 2.
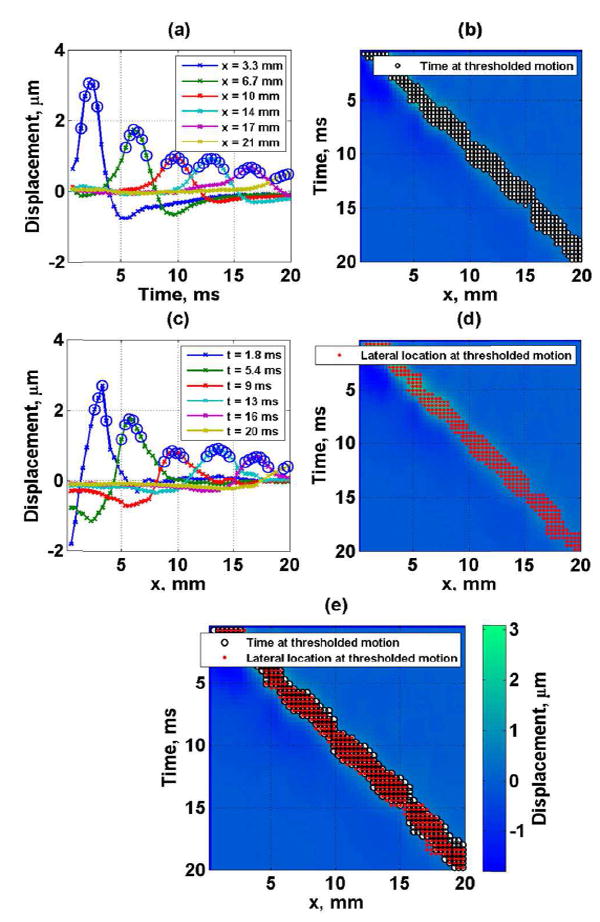
Tissue mimicking phantom experimental data (a) shear wave displacement as a function of lateral location (the circles represent the time at which the motion is more than 0.80 times the local maximum), (b) spatiotemporal shear wave displacement map with time points at which the local motion is more than 0.80 times the local maximum (black and white circles), (c) shear wave displacement as a function of time (the circles represent the lateral location at which the motion is more than 0.80 times the local maximum, (d) spatiotemporal shear wave displacement map with lateral points at which the local motion is more than 0.80 times the local maximum (red closed circles) and (e) spatiotemporal shear wave displacement map with combination of time (black and white circles) and lateral (red closed circles) points at which the motion is more than 0.80 times the local maximum.
Likewise, for each spatial profile at time tj , u (x, tj), the displacement profile is normalized to obtain, uN (x, tj) , and then a thresholding operation is performed, as shown in Figs. 2(c) and 2(d) with a threshold of 0.80.
| (6) |
| (7) |
The STTH method combines the TTPi,T and the LPj,T in a single set, ST, as illustrated in Fig. 2(e).
| (8) |
The STTH method also provides new independent data points used in the linear regression that the conventional TTP does not use. There are two types of new points with respect to TTP method: 1) points between the threshold level and the peak, 2) all lateral points higher than the threshold. The larger the threshold the more overlap occurs between points from lateral and temporal profiles, as shown in Fig. 2(e). The RANSAC algorithm is used on set ST to perform a linear model fit.
D. Phantom studies
A set of 4 homogeneous tissue mimicking phantoms (shear wave liver fibrosis model 039, CIRS Inc., Norfolk, VA) were used to test the group velocity estimation methods. The nominal shear wave group velocities of the phantoms reported by the manufacturer from quasi-static tests are 1.06, 1.80, 2.83 and 3.80 m/s, for Phantom 1, 2, 3, and 4 respectively. The phantoms have ultrasound attenuation of 0.5 dB/cm/MHz, mass density of 1,030 kg/m3 and sound speed of around 1540 m/s. Five consecutive acquisitions were obtained by positioning the probe on different locations of each phantom. Shear waves were generated at a depth of 4 cm from the phantom surface. For comparison ten shear wave speed measurements were acquired with a General Electric Logiq E9 (LE9, GE Healthcare, Wauwatosa, WI) equipped with an acoustic radiation force shear wave elastography method [24]. Measurements were made at 4 cm from the phantom surface with a curved array transducer (C1-6-D, GE Healthcare). The mean and interquartile ranges (IQR) from the LE9 measurements were used as a reference.
E. Human studies
Healthy individuals with no history of liver disease were included in the study. The experiment protocol was approved by the Mayo Clinic Institutional Review Board and written informed consent was obtained prior to scanning. Fourteen subjects (8 female, 6 male, mean Body Mass Index (BMI): 29 ± 5 kg/m2) were recruited for the study. Imaging was performed by an experienced sonographer with the ultrasound probe positioned at the 8th intercostal space and during breath holds. Under the guidance of B-mode imaging, the sonographer located a region of interest (ROI) 1.5 cm below the liver capsule. Five consecutive acquisitions were obtained.
F. Phantom and human studies data acquisition
A Verasonics Vantage system equipped with a C5-2v curved array transducer was used in this study (Verasonics, Inc., Kirkland, WA). For shear wave generation a single focused push beam with push duration of 600 μs was transmitted. The detection beams were wide beams with an f /9.9 focal configuration transmitted with a frequency of 2 MHz. Received signals from 2 steering angles were compounded [25], giving an effective pulse repetition frequency (PRF) of 2.77 kHz. For the phantom studies two sets of data were acquired, using 90 Volts for the transmitted push signal to achieve high signal-to-noise ratio (SNR) in the measurements and 20 Volts for the transmitted push to obtain measurements with low SNR. Measurements with SNR higher than 20 dB were considered high SNR and measurements with SNR lower than 10 dB were considered low SNR.
G. Phantom and human studies data processing
The axial particle displacement (Uz) was calculated using an autocorrelation method [26]. The displacement data within the focal zone were averaged along the axial direction (focal depth, ±2.5 mm) to create spatiotemporal maps. Only positive displacements were preserved on the spatiotemporal maps for the phantom study and human study. To improve the robustness of shear wave speed estimates, only realistic shear wave speeds in human liver were considered; thus, shear wave speeds higher than 5.8 m/s and lower than 0.5 m/s were considered failed measurements [8, 11]. The lateral span to track shear waves was 16 mm, and a spatiotemporal interpolation factor of 10 was used (interpolation was performed both on time and spatial dimensions by a factor of 10 in each direction).
H. Group Velocity estimation
In both phantom and human studies the shear wave group velocity was estimated using the time-to-peak method (TTP), the spatiotemporal maximum motion method (STP) and the spatiotemporal thresholding motion method (STTH). The linear regression used to estimate shear wave velocity was based on the Random Sample Consensus (RANSAC) algorithm applied to the TTP shear wave velocity estimation proposed by Wang, et al. [23]. In summary, for shear wave velocity estimation the RANSAC algorithm finds the linear model in the presence of strong outliers by performing three steps for a number of iterations: 1) Randomly selects a subset of points, 2) classifies the points that do not match the linear model within the expected measurement error (te) as outliers, 3) retains the points that better fit a previous iteration determined by a cost function. The linear model that was fit to the spatiotemporal data sets from TTP, STP and STTH methods (Eqs. 1, 3 and 8) was
| (9) |
where t is time, SWV is the shear wave group velocity, x is the lateral distance and β is a constant. For simplicity, the measurement error (e = t – t̄, where t̄ is the linear model estimated time) in all methods was assumed to occur only in the temporal dimension. The cost function used in the RANSAC algorithm to find the best linear model was the M-estimator as used by Wang, et al. [23]
| (10) |
| (11) |
where te is the expected measurement error. The expected measurement error was set to 99% of the standard deviation of the shear wave time delay estimation previously measured in the phantoms to be 0.18 ms and according to Wang, et al. [23]. The same value of σ (see details in Wang, et al.) was used to process all phantoms and human study data.
Threshold values in the STTH method were studied in the phantoms with values from 0.5 to 1 in increments of 0.01. The optimal threshold value is selected by maximizing the RANSAC number of inliers or the inliers ratio defined as the ratio of number of inliers to total points. Figure 3 illustrates the median of inliers ratio (n = 10) as a function of threshold for the phantoms. Because in an in vivo application the measurements will be a combination of data with high and low SNR, the optimal threshold value of each phantom was selected from the median of inlier ratio of combined high SNR and low SNR (n = 20) giving optimal threshold of 0.99, 0.97, 0.96 and 0.95 for Phantoms 1, 2, 3 and 4 respectively. Similarly the threshold value that maximizes inlier ratio in the human study was found to be 0.97.
Fig. 3.
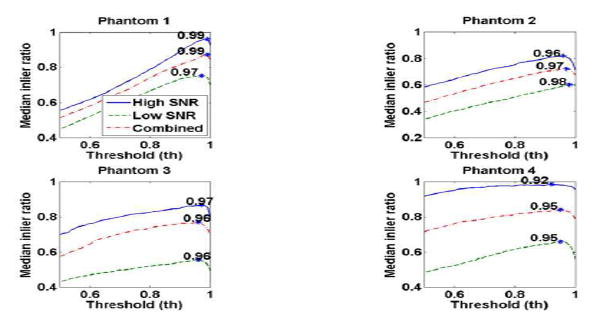
Median of inlier ratio as a function of threshold value in each phantom. The continuous line represent the high SNR case (n = 10), the dashed line represents the low SNR case (n = 10) and the dashed-dot line represent the combination of high and low SNR cases (n = 20).
It is important to note the differences between the STP and STTH methods. With the purpose of increasing points used in the linear regression for a more robust estimate of shear wave velocity, the STP method includes the peaks from temporal and spatial particle motion profiles. On the other hand, the STTH method includes not only the peak but other points that are higher than a threshold. Thus STP method is the same as the STTH method with a threshold of 1. Reducing the threshold value from 1 allows the inclusion of more points that improve the inlier ratio (as described in Fig. 3) and therefore these additional points are also a representation of the shear wave velocity.
I. Statistical methods
Results are reported as median and IQR of successful measurements. To evaluate if there was a significant difference in the mean of RANSAC coefficient of determination r2 and number of inliers between the investigated methods (TTP, STP and STTH) two sample paired t-tests with one side tail were used. To evaluate if there was a significant difference in the variance of shear wave velocity measurements between the investigated methods (TTP, STP and STTH) two sample paired F-tests with one side tail were used. Statistical significance for all results was accepted for p ≤ 0.05.
III. Results
A. Phantom studies
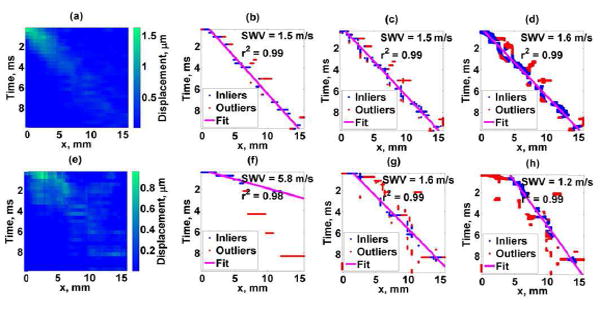
The shear wave propagation map, TTP fit, STP fit, and STTH fit for both the high SNR and low SNR data sets of Phantom 1 are illustrated in Fig. 4.
Fig. 4.
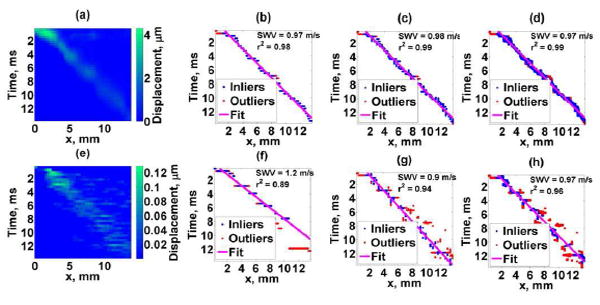
Phantom 1 results. Top figures: high SNR acquisition, Bottom figures: low SNR acquisition. (a),(e) Shear wave motion, (b),(f) TTP method, (c),(g) STP method, (d),(h) STTH method with 0.99 threshold. Blue dots are RANSAC inliers, red dots are RANSAC outliers, and continuous line is the linear fit from RANSAC. SWV corresponds to the estimated shear wave velocity and r2 represents the linear regression coefficient of determination.
The phantom study results summarizing shear wave group velocity for all methods and phantoms are shown in Table I.
TABLE I.
Phantom study summary - Shear wave group velocities, m/s.
| Phantom 1 | Phantom 2 | Phantom 3 | Phantom 4 | |||||||||
|---|---|---|---|---|---|---|---|---|---|---|---|---|
|
|
||||||||||||
| LE9 | 0.96(0.02) | 1.67(0.01) | 2.56(0.02) | 4.13(0.01) | ||||||||
| CIRS | 1.06 | 1.80 | 2.83 | 3.80 | ||||||||
| High SNR | Low SNR | Combined* | High SNR | Low SNR | Combined* | High SNR | Low SNR | Combined* | High SNR | Low SNR | Combined* | |
| TTP | 0.99(0.03) | 1.00(0.15) | 0.99(0.05) | 1.74(0.07) | 1.72(0.14) | 1.73(0.10) | 3.05(0.32) | 2.61(0.49) | 2.84(0.46) | 3.72(0.12) | 3.71(0.21) | 3.71(0.12) |
| STP | 0.98(0.02) | 0.93(0.06) | 0.98(0.05) | 1.70(0.03) | 1.69(0.18) | 1.70(0.06) | 2.80(0.24) | 2.57(0.15) | 2.67(0.25) | 3.73(0.07) | 3.73(0.15) | 3.73(0.12) |
| STTH | 0.97(0.02) | 0.96(0.05) | 0.97(0.03) | 1.68(0.01) | 1.66(0.14) | 1.68(0.04) | 2.67(0.14) | 2.63(0.24) | 2.64(0.25) | 3.66(0.14) | 3.70(0.16) | 3.67(0.14) |
n = 10, medial (IQR)
n = 20, median (IQR)
The independent analysis of high and low SNR cases illustrates the increase in variability of shear wave measurements when the SNR of shear wave motion signal is low, however, in any application shear wave group velocity measurements are computed from a number of measurements that encompass high and low SNR shear wave data. For that reason, the forthcoming results are presented from combining the high and low SNR cases. Fig. 5 summarizes the shear wave velocity measurements for each phantom (combined high and low SNR cases) with TTP, STP, STTH with optimal threshold value. The variance of SWV estimates with STP and STTH methods were statistically significantly lower (F-test p < 0.01) than TTP method in Phantoms 1, 2 and 3. There was not a statistically significant lower variance of SWV estimates in Phantom 4 with STP (F-test p = 0.61) and STTH (F-test p = 0.45) methods with respect to TTP method.
Fig. 5.
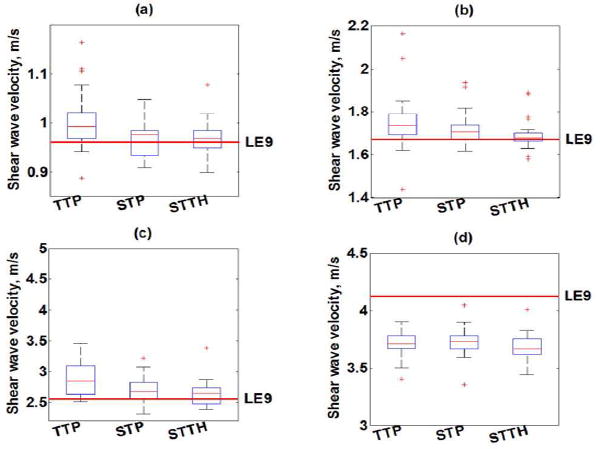
Box-and-whisker plots of shear wave velocity (SWV) measurements as a function of shear wave velocity estimation method (TTP, STP, STTH) for (a) Phantom 1, (b) Phantom 2, (c) Phantom 3 and (d) Phantom 4. The box represents the interquartile range (IQR), the red continuous line represents the median and the cross symbols (+) represents outliers (n = 20 measurements). Phantom’s median value of SWV measured with LE9 scanner is shown with a red dashed line.
The RANSAC coefficient of determination r2 for each phantom with TTP, STP, STTH are summarized in Fig. 6. The mean coefficient of determination r2 of STP and STTH linear regression were statistically significantly higher (t-test p < 0.01) than those of TTP method in Phantom 2.
Fig. 6.
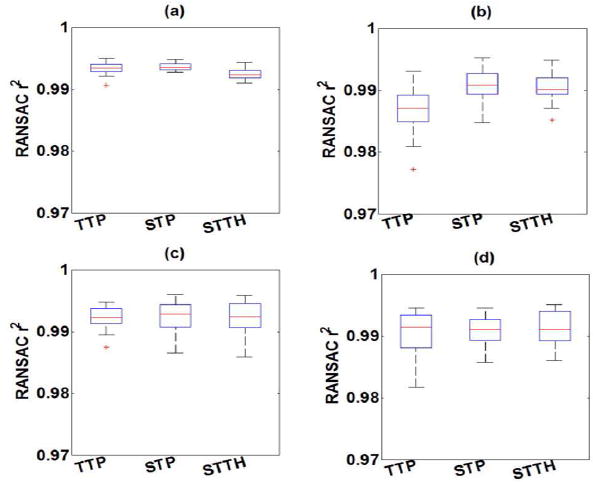
Box-and-whisker plots of RANSAC coefficient of determination r2 as a function of shear wave velocity estimation method (TTP, STP, STTH) for (a) Phantom 1, (b) Phantom 2, (c) Phantom 3 and (d) Phantom 4 (n = 20 measurements). The box represents the interquartile range (IQR), the red continuous line represents the median and the cross symbols (+) represents outliers (n = 20 measurements).
The RANSAC number of inlier points for each phantom with TTP, STP, STTH are summarized in Fig. 7. The mean RANSAC number of inliers of STP and STTH were statistically significantly higher (t-test p < 0.01) than those of TTP method in all Phantoms. On the other hand, the median inlier ratios of Phantom 1 were 0.80, 0.84 and 0.87; for Phantom 2 were 0.62, 0.67 and 0.70; for Phantom 3 were 0.70, 0.70 and 0.73; for Phantom 4 were 0.75, 0.78 and 0.81 respectively for TTP, STH and STTP methods.
Fig. 7.
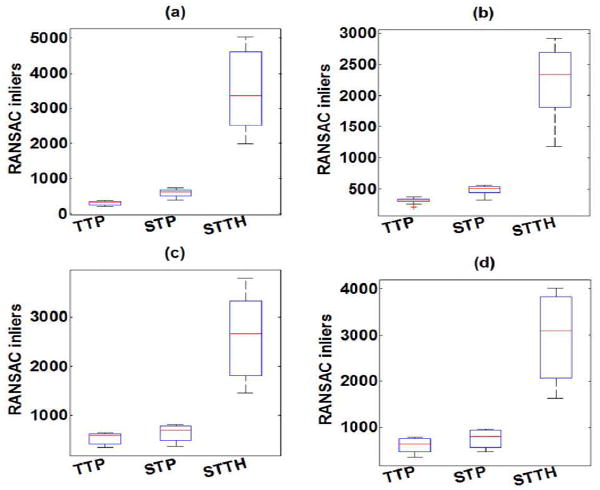
Box-and-whisker plots of RANSAC number of inliers as a function of shear wave velocity estimation method (TTP, STP, STTH) for (a) Phantom 1, (b) Phantom 2, (c) Phantom 3 and (d) Phantom 4 (n = 20 measurements). The box represents the interquartile range (IQR), the red continuous line represents the median and the cross symbols (+) represents outliers (n = 20 measurements).
B. Human studies
Fig. 8 summarizes the human liver results of shear wave velocity measurements for each subject with TTP, STP, and STTH.
Fig. 8.
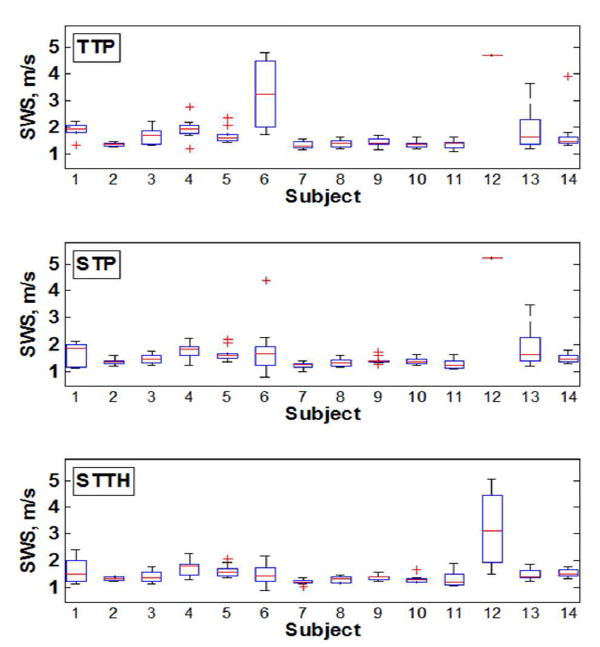
Box-and-whisker plots of shear wave velocity measurements for each subject. The box represents the interquartile range (IQR), the red continuous line represents the median and the cross symbols (+) represents outliers (n = 10 measurements).
The shear wave propagation map, TTP fit, STP fit, and STTH fit for two representative human liver data sets (good data, subject 5 and poor data, subject 6) are illustrated in Fig. 9.
Fig. 9.
Human liver study results. Top figures: Good case, Bottom figures: Poor case. (a),(e) Shear wave motion, (b),(f) TTP method, (c),(g) STP method, (d),(h) STTH method. SWV corresponds to the estimated shear wave velocity and r2 represents the linear regression coefficient of determination.
Table II shows the summary of shear wave velocity estimation results for the group of 14 subjects or 140 measurements. The variance of SWV estimates with STP and STTH methods were statistically significantly lower (F-test p < 0.01) than the TTP method. The success rate is defined at the ratio of successful measurements (SWV between 0.5 m/s to 5.8 m/s) to the total number of measurements. The change in the IQR of the STP and STTH methods were calculated respect to the IQR of TTP method as:
| (12) |
TABLE II.
Summary of human liver shear wave velocity results (n = 140)
| TTP | STP | STTH | |
|---|---|---|---|
|
|
|||
| Median. m/s | 1.47 | 1.42 | 1.40 |
| IQR, m/s | 0.38 | 0.35 | 0.29 |
| Change in IQR, % | -7.95 | -21.55 | |
| Success rate, % | 77.14 | 85.00 | 91.43 |
IV. Discussion
Results of phantom and in vivo human studies show that using the spatiotemporal peak (STP) and spatiotemporal thresholding (STTH) methods in the presence of high noise can reconstruct the shear wave group velocity with more precision than the conventional time-to-peak (TTP) method. The phantom study served to illustrate the effects of low displacement signal-to-noise (SNR) in shear wave data when estimating the group velocity, as illustrated in Fig. 4. For the STTH method it can be observed in Fig. 3 that the optimal threshold value (to maximize the number of points that are used in the linear regression) varied among the phantoms: higher thresholds can be used to maximize the inliers for softer phantoms (Phantom 1 and 2); and in the case of stiffer phantoms (Phantoms 3 and 4), the results suggest that reducing the threshold maximizes the number of points that are used in the linear regression.
The summary of the phantom study shear wave velocity estimates for all phantom and SNR cases in Table 1 indicates the median of SWV estimates were similar among the studied methods and the IQR of SWV estimates decreased with the STP and STTH methods with respect to TTP method in the majority of the cases (high SNR, low SNR, combined high and low SNR and phantoms). Combining the high and low SNR data sets serve as an example of in vivo data set where a number of acquisitions are averaged (composed of good and poor SNR shear wave motion data). In the combined data sets, the STP and STTH methods were able to reconstruct SWV with significantly less variance than the SWV estimates with TTP method in Phantoms 1, 2 and 3. In the stiffest phantom (Phantom 4) there was not statistically significantly less variance in SWV estimates from STP and STTH method with respect to TTP method. Similarly, the median SWV estimates from the studied methods (TTP, STP and STTH) were similar to the reference values of SWV (from manufacturer and LE9) in Phantoms 1, 2 and 3. These results agree with the literature: in stiffer materials shear wave motion signal-to-noise-ratio (SNR) is low and thus the uncertainty of detecting shear wave propagation and reconstructing shear wave speed is high [27].
The motivation behind the STP and the STTH methods is to increase the number of data points used for estimation of the linear fit to provide a more robust estimation of the shear wave velocity. Only in Phantom 2 an increase in linear regression coefficient of determination r2 (a measure of robustness in a linear fit) was found with the STP and the STTH methods with respect to TTP method, nonetheless the r2 was higher than 0.98 in general (refer to Fig. 6). In the RANSAC algorithm the numbers of points that are used in the best possible linear regression are called inliers. Fig. 7 illustrates a statistically significant increase in inliers with the STP and STTH methods with respect to TTP method in all phantoms. This suggests that the additional data points that are included by the STP and STTH methods represent the same ‘true linear fit’ as the TTP method.
The TTP, STP, and STTH methods were evaluated in detail in representative good and poor data sets from in vivo studies of human liver. As shown in Fig. 9, the spatiotemporal shear wave displacement maps that are used to detect the TTP, STP and STTH data sets to be fit by the linear model are more complex than those from tissue mimicking phantom data. Factors that influence the spatiotemporal shear wave displacements maps include ultrasound attenuation, phase aberration, clutter, tissue inhomogeneity, physiological motion, motion detection methods, material properties such as viscoelasticity and others [28]-[31]. Although the major limitation of the TTP, STP, and STTH method is the assumption that the shear wave propagates in a pure elastic material, the estimated velocities shown in Fig. 8 demonstrate that the STP and STTH methods improve the shear wave group velocity estimation precision for the majority of the subjects.
The gold standard to evaluate liver fibrosis is liver biopsy. Liver biopsy results are classified by the METAVIR system (F0, no fibrosis; F1, portal fibrosis without septa; F2, portal fibrosis with few septa; F3, numerous septa without cirrhosis; F4, cirrhosis). In a recent manuscript by Ferraioli, et al., [32] that discusses the guidelines and recommendations for clinical use of ultrasound elastography in liver, the shear wave velocity cut-off ranges for each fibrosis stage were reported from several studies using acoustic radiation force shear wave elastography methods. The shear wave velocities cut-off for F0-F1 is <1.2 m/s, F2 is 1.13 to 1.55 m/s, F3 is 1.43 to 1.81 m/s and F4 is 1.36 to 2.13 m/s. Although the STP and STTH methods improve the precision of shear wave velocity estimation and as a consequence the shear wave velocity is lowered with respect to the TTP method estimates, the median shear wave group velocities of healthy human liver in this study is slightly higher compared to literature values (refer to Table II). There are several possible reasons why these estimates are higher than literature values: First, in the studies described by Ferraioli, et al., [32] mostly clinical ultrasound scanners were used (Aixploer by Supersonic Imagine, S2000 by Siemens, iU22 by Phillips, Logiq E9 by GE) whereas our study was conducted with a research ultrasound scanner (Verasonics Vantage). There are no other studies on healthy livers using this scanner, therefore it is difficult know if our results are biased or not. Second, as discussed by Ferraioli, et al., [32] the shear wave speed cut-off ranges for liver fibrosis stages are large and overlap between consecutive stages, which suggest the large variability that exists in measurements from different ultrasound scanners. This variability and difference between different machines are the motivation of the Quantitative Imaging Biomarker Alliance (QIBA) ultrasound shear wave speed technical committee, where a great effort is ongoing to standardize the variability that exists in quantitative elasticity measurements from clinical applications [33]-[35]. Third, there is evidence that the healthy shear wave speed measurements are biased high depending on food intake and BMI [31], [36], [37]. For instance, the majority of the subjects were studied between noon and 2 PM (which is the most convenient time for the volunteers to attend the study); however, we did not control and or inquire about the subjects’ food intake. As shown in Fig. 8, the results for subject 12 are significantly higher than the overall cohort; the fact that this individual’s BMI is larger than 35 suggests these high shear wave velocity results could be due to significantly lower SNR.
The overall success rate is summarized in Table II. With the STP method, the success rate is increased by 8 percentage points with respect to the TTP method, and with STTH the success ratio is increased by 14 percentage points with respect to TTP. Moreover, the variation of the shear wave velocity estimates in the 14 subject cohort (IQR of 140 measurements) decreased at least by 8 percentage points when using the STP and STTH methods respect to the TTP method.
A potential limitation of the proposed methods is the assumption of shear wave propagation in pure elastic materials. Nonetheless, clinical scanner use a single shear wave group velocity measurement that ignore tissue viscosity, thus the proposed methods offer a post-processing approach that can be implemented in clinical scanners to improve SWV estimation. On the other hand, a potential limitation of the phantom study is using LE9 values as the reference to measure accuracy of the studied methods. LE9 values are estimated from a small lateral range (2 to 5 mm) with cross-correlation techniques [24] while the methods studied use a larger lateral span (16 mm) with linear regression techniques. On the other hand, the ability of the STTH method to vary the threshold level provides more flexibility to optimize and achieve more precise estimates of shear wave group velocity. However, the threshold values were not parametrically studied and a more detailed study is needed to determine the most optimal threshold level to maximize precision on shear wave velocity measurements in a wide range of tissue mimicking phantoms and tissues.
In this study the STP and STTH methods were applied to shear wave displacement data, however, they can be applied to other shear wave motion data such as shear wave velocity and acceleration. Additionally, the STP and STTH methods could be used as a kernel operator for estimating local shear wave speed for the purposes of creating a shear wave image. These methods could be used instead of the correlation estimation within the two-dimensional method proposed by Song, et al. [38] and use the Anderssen and Hegland spatial weighting approaches to estimate shear wave speed. Finally, the idea of using both the spatial peak and temporal peak could be extended to cross-correlation based methods to perform cross-correlation on the spatial waveforms at each time point to create two-dimensional shear wave speed maps. The STP and STTH methods could be extended to work for other shear wave motion data such as velocity and acceleration as well as applied to shear wave velocity imaging techniques such as CUSE [18].
V. Conclusion
Two methods for enhancing shear wave group velocity estimation are proposed. The first method combines spatial and temporal peak searches (STP method) in shear wave motion data to estimate shear wave velocities, whereas the second method uses spatiotemporal thresholding (STTH) to estimate shear wave velocities. The STTH method uses a threshold level, but the optimal threshold level may vary depending on the application and its optimization was not fully investigated in the current study. Both proposed methods were able to improve the precision and success rate of shear wave velocity estimates in tissue mimicking phantoms and in vivo healthy liver data compared to the conventional time-to-peak (TTP) method.
Acknowledgments
The authors thank Duane Meixner and Dr. Pengfei Song for data acquisition assistance and Jennifer Poston for administrative assistance. This study was supported in part by grants R01DK092255 and R01DK106957 from the National Institute of Diabetes and Digestive and Kidney Diseases. The content is solely the responsibility of the authors and does not necessarily represent the official views of the National Institute of Diabetes and Digestive and Kidney Diseases or the National Institutes of Health.
References
- 1.Muthupillai R, Lamos DJ, Rossman PJ, Greenleaf JF, Manduca A, Ehman RL. Magnetic resonance elastography by direct visualization of acoustic strain waves. Science. 1995;269:1854–1857. doi: 10.1126/science.7569924. [DOI] [PubMed] [Google Scholar]
- 2.Sandrin L, Tanter M, Catheline S, Fink M. Shear modulus imaging with 2-D transient elastography. IEEE Transactions on Ultrasonics Ferroelectrics and Frequency Control. 2002 Apr;49:426–435. doi: 10.1109/58.996560. [DOI] [PubMed] [Google Scholar]
- 3.Ophir J, Céspedes I, Ponnekanti H, Yazdi Y, Li X. Elastography: A quantitative method for imaging the elasticity of biological tissues. Ultrasonic Imaging. 1991;13:111–134. doi: 10.1177/016173469101300201. [DOI] [PubMed] [Google Scholar]
- 4.Nightingale K, Soo MS, Nightingale R, Trahey G. Acoustic radiation force impulse imaging: In vivo demonstration of clinical feasibility. Ultrasound in Medicine and Biology. 2002 Feb;28:227–235. doi: 10.1016/s0301-5629(01)00499-9. [DOI] [PubMed] [Google Scholar]
- 5.Sarvazyan AP, Rudenko OV, Swanson SD, Fowlkes JB, Emelianov SY. Shear wave elasticity imaging: A new ultrasonic technology of medical diagnostics. Ultrasound Med Biol. 1998;24:1419–1435. doi: 10.1016/s0301-5629(98)00110-0. [DOI] [PubMed] [Google Scholar]
- 6.Bercoff J, Tanter M, Fink M. Supersonic shear imaging: a new technique for soft tissue elasticity mapping. IEEE Transactions on Ultrasonics Ferroelectrics and Frequency Control. 2004;51:396–409. doi: 10.1109/tuffc.2004.1295425. [DOI] [PubMed] [Google Scholar]
- 7.Yin M, Talwalkar JA, Glaser KJ, Manduca A, Grimm RC, Rossman PJ, Fidler JL, Ehman RL. Assessment of Hepatic Fibrosis With Magnetic Resonance Elastography. Clinical Gastroenterology and Hepatology. 2007;5:1207–1213. e2. doi: 10.1016/j.cgh.2007.06.012. [DOI] [PMC free article] [PubMed] [Google Scholar]
- 8.Kirk GD, Astemborski J, Mehta SH, Spoler C, Fisher C, Allen D, Higgins Y, Moore RD, Afdhal N, Torbenson M, Sulkowski M, Thomas DL. Assessment of Liver Fibrosis by Transient Elastography in Persons with Hepatitis C Virus Infection or HIV–Hepatitis C Virus Coinfection. Clinical Infectious Diseases. 2009 Apr 1;48:963–972. doi: 10.1086/597350. [DOI] [PMC free article] [PubMed] [Google Scholar]
- 9.Gheonea DI, Săftoiu A, Ciurea T, Gorunescu F, Iordache S, Popescu GL, Belciug S, Gorunescu M, Săndulescu L. Real-time sono-elastography in the diagnosis of diffuse liver diseases. World Journal of Gastroenterology : WJG. 2010;16:1720–1726. doi: 10.3748/wjg.v16.i14.1720. [DOI] [PMC free article] [PubMed] [Google Scholar]
- 10.Fierbinteanu-Braticevici C, Andronescu D, Usvat R, Cretoiu D, Baicus C, Marinoschi G. Acoustic radiation force imaging sonoelastography for noninvasive staging of liver fibrosis. World Journal of Gastroenterology. 2009 Nov;15:5525–5532. doi: 10.3748/wjg.15.5525. [DOI] [PMC free article] [PubMed] [Google Scholar]
- 11.Chen S, Sanchez W, Callstrom MR, Gorman B, Lewis JT, Sanderson SO, Greenleaf JF, Xie H, Shi Y, Pashley M, Shamdasani V, Lachman M, Metz S. Assessment of Liver Viscoelasticity by Using Shear Waves Induced by Ultrasound Radiation Force. Radiology. 2013;266 doi: 10.1148/radiol.12120837. [DOI] [PMC free article] [PubMed] [Google Scholar]
- 12.Bavu É, Gennisson J-L, Couade M, Bercoff J, Mallet V, Fink M, Badel A, Vallet-Pichard A, Nalpas B, Tanter M, Pol S. Noninvasive In Vivo Liver Fibrosis Evaluation Using Supersonic Shear Imaging: A Clinical Study on 113 Hepatitis C Virus Patients. Ultrasound in Medicine & Biology. 2011;37:1361–1373. doi: 10.1016/j.ultrasmedbio.2011.05.016. [DOI] [PubMed] [Google Scholar]
- 13.Oliphant TE, Manduca A, Ehman RL, Greenleaf JF. Complex-valued stiffness reconstruction for magnetic resonance elastography by algebraic inversion of the differential equation. Magnetic Resonance in Medicine. 2001 Feb;45:299–310. doi: 10.1002/1522-2594(200102)45:2<299::aid-mrm1039>3.0.co;2-o. [DOI] [PubMed] [Google Scholar]
- 14.Knutsson H, Westin CF, Granlund G. Local multiscale frequency and bandwidth estimation. Image Processing, 1994 Proceedings ICIP-94; IEEE International Conference; 1994. pp. 36–40. [Google Scholar]
- 15.McLaughlin J, Renzi D. Shear wave speed recovery in transient elastography and supersonic imaging using propagating fronts. Inverse Problems. 2006;22:681. [Google Scholar]
- 16.Tanter M, Bercoff J, Athanasiou A, Deffieux T, Gennisson J-L, Montaldo G, Muller M, Tardivon A, Fink M. Quantitative Assessment of Breast Lesion Viscoelasticity: Initial Clinical Results Using Supersonic Shear Imaging. Ultrasound in Medicine & Biology. 2008;34:1373–1386. doi: 10.1016/j.ultrasmedbio.2008.02.002. [DOI] [PubMed] [Google Scholar]
- 17.McAleavey S, Menon M, Elegbe E. Shear Modulus Imaging with Spatially Modulated Ultrasound Radiation Force. Ultrasonic Imaging. 2009;31:217–234. doi: 10.1177/016173460903100401. [DOI] [PMC free article] [PubMed] [Google Scholar]
- 18.Song P, Zhao H, Manduca A, Urban MW, Greenleaf JF, Chen S. Comb-push Ultrasound Shear Elastography (CUSE): A Novel Method for Two-dimensional Shear Elasticity Imaging of Soft Tissues. Ieee Transactions on Medical Imaging. 2012;31:1821–1832. doi: 10.1109/TMI.2012.2205586. [DOI] [PMC free article] [PubMed] [Google Scholar]
- 19.Urban MW, Greenleaf JF. Use of the radon transform for estimation of shear wave speed. The Journal of the Acoustical Society of America. 2012;132:1982–1982. [Google Scholar]
- 20.Rouze NC, Wang MH, Palmeri ML, Nightingale KR. Robust Estimation of Time-of-Flight Shear Wave Speed Using a Radon Sum Transformation. IEEE transactions on ultrasonics, ferroelectrics, and frequency control. 2010;57:2662–2670. doi: 10.1109/TUFFC.2010.1740. [DOI] [PMC free article] [PubMed] [Google Scholar]
- 21.Palmeri ML, Wang MH, Dahl JJ, Frinkley KD, Nightingale KR. Quantifying hepatic shear modulus in vivo using acoustic radiation force. Ultrasound in Medicine and Biology. 2008 Apr;34:546–558. doi: 10.1016/j.ultrasmedbio.2007.10.009. [DOI] [PMC free article] [PubMed] [Google Scholar]
- 22.Venkatesh SK, Yin M, Ehman RL. Magnetic Resonance Elastography of Liver: Technique, Analysis and Clinical Applications. Journal of magnetic resonance imaging : JMRI. 2013;37:544–555. doi: 10.1002/jmri.23731. [DOI] [PMC free article] [PubMed] [Google Scholar]
- 23.Wang MH, Palmeri ML, Rotemberg VM, Rouze NC, Nightingale KR. Improving the Robustness of Time-of-Flight Based Shear Wave Speed Reconstruction Methods Using RANSAC in Human Liver in vivo. Ultrasound in Medicine & Biology. 2010;36:802–813. doi: 10.1016/j.ultrasmedbio.2010.02.007. [DOI] [PMC free article] [PubMed] [Google Scholar]
- 24.Song P, Macdonald MC, Behler RH, Lanning JD, Wang MH, Urban MW, Manduca A, Zhao H, Callstrom MR, Alizad A, Greenleaf JF, Chen S. Two-dimensional shear-wave elastography on conventional ultrasound scanners with time-aligned sequential tracking (TAST) and comb-push ultrasound shear elastography (CUSE) IEEE transactions on ultrasonics, ferroelectrics, and frequency control. 2015;62:290–302. doi: 10.1109/TUFFC.2014.006628. [DOI] [PMC free article] [PubMed] [Google Scholar]
- 25.Montaldo G, Tanter M, Bercoff J, Benech N, Fink M. Coherent Plane-Wave Compounding for Very High Frame Rate Ultrasonography and Transient Elastography. IEEE Transactions on Ultrasonics Ferroelectrics and Frequency Control. 2009 Mar;56:489–506. doi: 10.1109/TUFFC.2009.1067. [DOI] [PubMed] [Google Scholar]
- 26.Pinton GF, Dahl JJ, Trahey GE. Rapid tracking of small displacements with ultrasound. IEEE Transactions on Ultrasonics Ferroelectrics and Frequency Control. 2006 Jun;53:1103–1117. doi: 10.1109/tuffc.2006.1642509. [DOI] [PubMed] [Google Scholar]
- 27.Wang M, Byram B, Palmeri M, Rouze N, Nightingale K. On the precision of time-of-flight shear wave speed estimation in homogeneous soft solids: initial results using a matrix array transducer. IEEE transactions on ultrasonics, ferroelectrics, and frequency control. 2013;60:758–770. doi: 10.1109/TUFFC.2013.2624. [DOI] [PMC free article] [PubMed] [Google Scholar]
- 28.Hua X, Shamdasani V, Fernandez AT, Peterson R, Lachman M, Yan S, Robert J, Urban M, Shigao C, Greenleaf J. Shear wave Dispersion Ultrasound Vibrometry (SDUV) on an ultrasound system: In vivo measurement of liver viscoelasticity in healthy animals. Ultrasonics Symposium (IUS), 2010 IEEE. 2010:912–915. [Google Scholar]
- 29.Pinton GF, Trahey GE, Dahl JJ. Sources of image degradation in fundamental and harmonic ultrasound imaging using nonlinear, full-wave simulations. Ultrasonics, Ferroelectrics, and Frequency Control, IEEE Transactions on. 2011;58:754–765. doi: 10.1109/TUFFC.2011.1868. [DOI] [PMC free article] [PubMed] [Google Scholar]
- 30.Amador C, Aristizabal S, Greenleaf JF, Urban MW. Effects of phase aberration on acoustic radiation force-based shear wave generation. Ultrasonics Symposium (IUS), 2014 IEEE International. 2014:2316–2319. doi: 10.1109/TUFFC.2016.2515366. [DOI] [PMC free article] [PubMed] [Google Scholar]
- 31.Goertz RS, Egger C, Neurath MF, Strobel D. Impact of Food Intake, Ultrasound Transducer, Breathing Maneuvers and Body Position on Acoustic Radiation Force Impulse (ARFI) Elastometry of the Liver. Ultraschall in Med. 2012 Aug 07;33:380–385. doi: 10.1055/s-0032-1312816. [DOI] [PubMed] [Google Scholar]
- 32.Ferraioli G, Filice C, Castera L, Choi BI, Sporea I, Wilson SR, Cosgrove D, Dietrich CF, Amy D, Bamber JC, Barr R, Chou YH, Ding H, Farrokh A, Friedrich-Rust M, Hall TJ, Nakashima K, Nightingale KR, Palmeri ML, Schafer F, Shiina T, Suzuki S, Kudo M. WFUMB Guidelines and Recommendations for Clinical Use of Ultrasound Elastography: Part 3: Liver. Ultrasound in Medicine & Biology. 2015;41:1161–1179. doi: 10.1016/j.ultrasmedbio.2015.03.007. [DOI] [PubMed] [Google Scholar]
- 33.R. S. o. N. America. Quantitative Imaging Biomarker Alliance (RSNA QIBA) Ultrasound Shear Wave Speed Technical Commitee. 2012 Available: http://qibawiki.rsna.org/index.php?title=Ultrasound_SWS_tech_ctte.
- 34.Hall TJ, Milkowski A, Garra, Carson P, Palmeri M, Nightingale K, Lynch T, Alturki A, Andre M, Audiere S, Bamber J, Barr R, Bercoff J, Bernal M, Brum J, Huan Wee C, Shigao C, Cohen-Bacrie C, Couade M, Daniels A, DeWall R, Dillman J, Ehman R, Franchi-Abella S, Fromageau J, Gennisson JL, Henry JP, Ivancevich N, Kalin J, Kohn S, Kugel J, Ken L, Liu N, Loupas T, Mazernik J, McAleavey S, Miette V, Metz S, Morel B, Nelson T, Nordberg E, Oudry J, Padwal M, Rouze N, Samir A, Sandrin L, Schaccitti J, Schmitt C, Shamdasani V, Pehngfei S, Switalski P, Wang M, Wear K, Hua X, Heng Z. RSNA/QIBA: Shear wave speed as a biomarker for liver fibrosis staging. Ultrasonics Symposium (IUS), 2013 IEEE International. 2013:397–400. [Google Scholar]
- 35.Wear, Garra B, Milkowski A, Rosenzweig S, Carson P, Barr R, Shamdasani V, Macdonald M, Wang M, Guenette G, Miyajima Y, Okamura Y, Dhyani M, Samir A, Hah Z, McLaughlin G, Gee A, Chen Y, Napolitano D, McAleavey S, Obuchowski N, Hall T. RSNA QIBA ultrasound shear wave speed Phase II phantom study in viscoelastic media. Ultrasonics Symposium (IUS), 2015 IEEE International. 2015:1–4. [Google Scholar]
- 36.Popescu A, Bota S, Sporea I, Sirli R, Danila M, Racean S, Suseanu D, Gradinaru O, Ivascu Siegfried C. The Influence of Food Intake on Liver Stiffness Values Assessed by Acoustic Radiation Force Impulse Elastography—Preliminary Results. Ultrasound in Medicine & Biology. 2013;39:579–584. doi: 10.1016/j.ultrasmedbio.2012.11.013. [DOI] [PubMed] [Google Scholar]
- 37.Nierhoff J, Chávez Ortiz A, Herrmann E, Zeuzem S, Friedrich-Rust M. The efficiency of acoustic radiation force impulse imaging for the staging of liver fibrosis: a meta-analysis. European Radiology. 2013 Nov 01;23:3040–3053. doi: 10.1007/s00330-013-2927-6. [DOI] [PubMed] [Google Scholar]
- 38.Song P, Manduca A, Zhao H, Urban MW, Greenleaf JF, Chen S. Fast Shear Compounding Using Robust 2-D Shear Wave Speed Calculation and Multi-directional Filtering. Ultrasound in Medicine & Biology. 2014;40:1343–1355. doi: 10.1016/j.ultrasmedbio.2013.12.026. [DOI] [PMC free article] [PubMed] [Google Scholar]


