

Summary
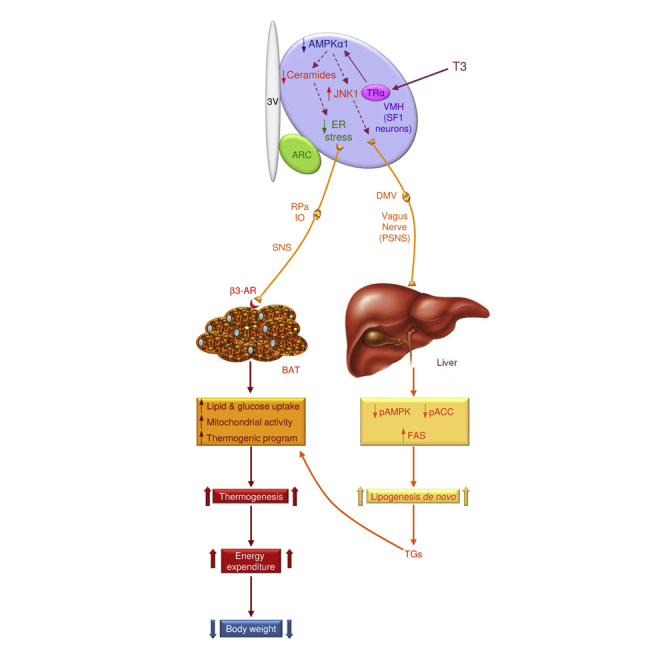
Thyroid hormones (THs) act in the brain to modulate energy balance. We show that central triiodothyronine (T3) regulates de novo lipogenesis in liver and lipid oxidation in brown adipose tissue (BAT) through the parasympathetic (PSNS) and sympathetic nervous system (SNS), respectively. Central T3 promotes hepatic lipogenesis with parallel stimulation of the thermogenic program in BAT. The action of T3 depends on AMP-activated protein kinase (AMPK)-induced regulation of two signaling pathways in the ventromedial nucleus of the hypothalamus (VMH): decreased ceramide-induced endoplasmic reticulum (ER) stress, which promotes BAT thermogenesis, and increased c-Jun N-terminal kinase (JNK) activation, which controls hepatic lipid metabolism. Of note, ablation of AMPKα1 in steroidogenic factor 1 (SF1) neurons of the VMH fully recapitulated the effect of central T3, pointing to this population in mediating the effect of central THs on metabolism. Overall, these findings uncover the underlying pathways through which central T3 modulates peripheral metabolism.
Keywords: thyroid hormones, VMH, SF1, AMPK, ceramides, ER stress, JNK1, autonomic nervous system, liver, BAT
Graphical Abstract
Highlights
-
•
Central T3 regulates lipogenesis in liver via the parasympathetic nervous system
-
•
Central T3 regulates lipid oxidation in BAT via the sympathetic nervous system
-
•
Ablation of AMPK in SF1 neurons of the VMH recapitulates the effects of T3
-
•
Hypothalamic JNK1 and ceramides/ER stress mediate T3 actions on liver and BAT
Martínez-Sánchez et al. show that thyroid hormones act in the hypothalamus to regulate hepatic lipogenesis and brown fat lipid oxidation via the parasympathetic and sympathetic nervous systems. These peripheral effects are orchestrated by two distinct signaling pathways in the VMH, JNK1 and ceramides/ER stress, which are under AMPK control.
Introduction
The thyroid axis plays a major role in the regulation of energy balance and metabolism (Fliers et al., 2010, Warner and Mittag, 2012, López et al., 2013, Mullur et al., 2014). One of the main features of patients with thyroid dysfunction is the concurrence of hyperphagia and weight loss in hyperthyroidism (Silva, 2006, López et al., 2013, Mullur et al., 2014). These beneficial effects have led to the development of selective thyroid hormone (TH) mimetics (Finan et al., 2016) as powerful new tools against atherosclerosis and obesity.
The classical view assumes that most physiological effects of THs (triiodothyronine [T3] and its prohormone, thyroxine [T4]) are exerted at the peripheral level (Silva, 2006, Sinha et al., 2012). However, recent evidence indicates that TH actions on energy metabolism are centrally mediated (Fliers et al., 2010, Warner and Mittag, 2012, López et al., 2013, Mullur et al., 2014). THs modulate food intake through their action in the arcuate nucleus of the hypothalamus (ARC) (Coppola et al., 2007, Vella et al., 2011, Varela et al., 2012). THs also modulate energy expenditure (EE). This effect has been conventionally ascribed to their direct action on peripheral tissues, such as brown adipose tissue (BAT) and skeletal muscle (Silva, 2006, Cannon and Nedergaard, 2010), but recent evidence has challenged that view. Indeed, T3 acts in the ventromedial nucleus of the hypothalamus (VMH) to regulate thermogenesis in BAT (López et al., 2010) and browning of white adipose tissue (WAT) (Martínez-Sánchez et al., 2017). The central effect of THs has also been implicated in the regulation of endogenous glucose production and insulin sensitivity (Fliers et al., 2010). Of note, selective interference with the transmission of the sympathetic and parasympathetic nervous system (SNS and PSNS) completely abolishes the effect of central T3 on glucose homeostasis (Fliers et al., 2010). However, it is totally unknown whether central actions of THs regulate peripheral lipid metabolism. The aims of this study were (1) to determine whether central THs regulate peripheral lipid metabolism, (2) to characterize the molecular mechanisms leading to that effect, and (3) to investigate whether those actions were part of a coordinated response integrating lipid homeostasis and energy balance at the whole-body level.
Results
Hyperthyroidism Is Associated with Tissue-Specific Regulation of the Lipogenesis Pathway
T4-treated rats showed decreased body weight despite hyperphagia and increased circulating levels of T4 and T3 (Figure S1A). In the liver (but not muscle, WAT, or BAT), the global effect of hyperthyroidism promoted de novo lipogenesis, as indicated by the decreased phosphorylated AMP-activated protein kinase (pAMPK) and acetyl-CoA carboxylase (pACC) and increased fatty acid synthase (FAS), as well as increased hepatic Oil Red O staining and triglyceride (TG) levels (Figures S1B–S1D).
Central T3 Regulation of Lipid Metabolism in Liver and BAT
Chronic ICV (intracerebroventricular) T3 induced weight loss and a slight decrease in thyrotropin-releasing hormone (TRH, codified by Trh) mRNA in the paraventricular nucleus of the hypothalamus (PVH), but altered neither feeding nor circulating thyroid-stimulating hormone (TSH), nor T4 and T3 levels (Figure S1E). The weight-reducing effect of central T3 was recapitulated in hypothyroid rats (data not shown). ICV administration of T3 promoted a comparable pattern of protein expression in peripheral tissues to that observed in hyperthyroid rats (Figure 1A). Accordingly, central administration of T3 increased hepatic lipid and TG content (Figures 1B and 1C), de novo TG synthesis (Figure 1D), as well as the hepatic activity and/or mRNA expression of phosphatidate phosphatase 1 (LIPIN1, codified by Lpin1) and diacylglycerol O-acyl-transferase 1 (DGAT1, codified by Dgat1), enzymes catalyzing the formation of diglyceride (DAG) and TG, respectively (Figure S1F). Of note, no changes were found in either lipid oxidative gene expression, such as the liver isoform of carnitine palmitoyltransferase 1a (CPT1a, codified by Cpt1a), nuclear respiratory factor 1 (NFR1, codified by Nrf1), and peroxisome-proliferator-activated receptor-gamma co-activator 1 alpha and beta (PGC1α and β, codified by Ppargc1a and Ppargc1b, respectively) (Figure S1G); liver lipid oxidation rate and mitochondrial oxygen consumption in vivo and in vitro (Figure S1H); or serum ketone bodies (Figure S1I).
Figure 1.

Effect of Central THs on Liver and BAT
(A) Protein levels of the AMPK pathway in the liver, WAT, muscle, and BAT (n = 8–17 rats/group).
(B and C) Oil Red O (20×; scale bar, 100 μm) staining analysis (B) and TG levels in the liver (n = 8–9 rats/group) (C).
(D) [3H]-acetate incorporation into TGs in the liver (n = 6–7 rats/group).
(E) mRNA levels of BAT genes (n = 5–7 rats/group).
(F) Protein levels of UCP1 in the BAT (n = 14 rats/group).
(G) 18F-FDG uptake analysis (n = 8 rats/group).
(H) Lipid oxidation rate, oxygen consumption rate in the BAT, and oxygen consumption in BAT mitochondria (n = 6–7 rats/group).
(I) Electron microscopy images (4,000×; scale bar, 10 μm) and quantification of lipid droplet (LD) and mitochondria number/area unit, size, and ultrastructure in the BAT (n = 4 rats/experimental group, 30 images/animal).
(J) Cumulative EE, RQ, and LA (n = 5 rats/group).
(K) c-FOS images (10×; scale bar, 50 μm) and staining analysis in the dorsal nucleus of the vagus (DMV) (n = 4 rats/group, 9–32 sections/animal) of rats ICV treated with vehicle or T3.
(L) Protein levels of the AMPK pathway in the liver of sham or VGX rats ICV treated with vehicle or T3 (n = 11–14 rats/group).
(M) Sympathetic nerve activity (SNA) in the BAT (n = 8–11 rats/group) of rats ICV treated with vehicle or T3.
(N) Protein levels of the AMPK pathway in the BAT of rats ICV treated with vehicle or T3 and s.c. treated with SR59230A (n = 7 rats/group).
∗p < 0.05, ∗∗p < 0.01, ∗∗∗p < 0.001 versus vehicle ICV. #p < 0.05 T3 ICV vehicle s.c. versus T3 ICV SR59230A s.c. Data are expressed as mean ± SEM. The bands in gels from (A), (F), (L), and (N) have been spliced from the same original gels. CC, central canal; HN, hypoglossal nucleus; ND, non-detected; SUV, standardized uptake value. See also Figure S1.
Analysis of BAT after central T3 infusion revealed increased mRNA expression of thermogenic markers, such as uncoupling protein 1 and 3 (UCP1 and 3, codified by Ucp1 and Ucp3, respectively), PGC1α, and fibroblast growth factor 21 (FGF21, codified by Fgf21), as well as protein levels of UCP1 (Figures 1E and 1F). The effect of central T3 on BAT UCP1 expression was recapitulated in hypothyroid rats (data not shown). Notably, the effect of T3 on FGF21 was specific for BAT because no changes were found in either its hepatic mRNA expression (vehicle ICV, 100% ± 37.0%; T3 ICV, 74.13% ± 22.4%) or circulating levels (vehicle ICV, 93.54 ± 1.98 U/mL; T3 ICV, 93.04 ± 1.44 U/mL). Central T3 induced a marked activation of brown fat, as indicated by a higher 2-18F-fluoro-2-deoxy-2-glucose (18F-FDG) uptake analyzed by positron emission tomography-computed tomography (PET-CT) (Figure 1G), associated with increased lipid oxidation and mitochondrial oxygen consumption (Figure 1H). Electron microscopy analysis of BAT showed decreased mitochondrial density and lipid droplet (LD) content, whereas the size of the mitochondria was increased (Figure 1I), which is indicative of activation of BAT (Thomsom et al., 1969). A slight, but not significant, decrease in BAT lipogenesis rate was found after T3 ICV treatment with no variations in TG and fatty acid (FA) concentration (Figure S1J). After central administration of T3, rats showed increased EE and decreased respiratory quotient (RQ, indicating increased lipid utilization), consistently with enhanced BAT-dependent oxidation fueled mainly by FA (Figure 1J), as well as reduced locomotor activity (LA) (Figure 1J). Overall, our results indicate that the effect of central T3 on liver and BAT is mediated via a direct action of THs in the central nervous system (CNS). This was further substantiated by the absence of changes in liver and BAT AMPK pathway following intraperitoneal (i.p.) administration of T3 at the same dose used in the ICV injections (Figure S1K).
The Autonomic Nervous System Mediates Central T3 Actions on Lipid Metabolism in Liver and BAT
We examined the contribution of the autonomic nervous system (ANS) in mediating the regulation of liver and BAT lipid metabolism following central administration of T3. Previous evidence demonstrated that T3 ICV increases c-FOS expression in the raphe pallidus (RPa) and the inferior olive (IO) nuclei (López et al., 2010). Our data showed that central T3 administration induced c-FOS expression in the dorsal nucleus of the vagus (DMV) (Figure 1K; normalized data, vehicle ICV, 100% ± 20.6%; T3 ICV, 812.75% ± 101.90%, p < 0.001). Therefore, we sought to determine whether the effect of central T3 on hepatic lipid metabolism involved vagal innervation. Thus, we compared the effect of T3 in vagotomized (VGX) and sham rats. ICV T3 administration decreased body weight (but not food intake) in sham and VGX rats (Figure S1L). However, vagotomy was sufficient to blunt T3-mediated induction of hepatic AMPK pathway (Figure 1L), as well as the mRNA expression of LIPIN1 and DGAT1 (Figure S1L) and liver FA content (data not shown). These findings indicate that the vagus nerve mediates the effects of central T3 on liver lipid metabolism.
T3 ICV increased BAT sympathetic nerve traffic (Figure 1M). Pharmacological inactivation of β3 adrenoceptors (β3-ARs) by subcutaneous administration of the specific antagonist SR59230A (López et al., 2010, Martínez de Morentin et al., 2014) prevented the effect on body weight associated with central administration of T3 without interfering with the feeding response (body weight change: vehicle ICV vehicle subcutaneously [s.c.], 19.57 ± 2.88 g; T3 ICV vehicle s.c., 10.25 ± 1.91 g, p < 0.01 versus vehicle ICV vehicle s.c.; T3 ICV SR59230A s.c., 16.75 ± 2.34 g, p < 0.05 versus T3 ICV vehicle s.c.; food intake: vehicle ICV vehicle s.c., 29.18 ± 1.09 g; T3 ICV vehicle s.c., 27.34 ± 0.94 g; T3 ICV SR59230A s.c., 30.50 ± 0.70 g). Furthermore, SR59230A blocked the T3-mediated activation of the AMPK pathway in BAT (Figure 1N). No changes were detected in T3-induced lipogenesis pathway in liver (Figure S1M). Overall, these data indicate that T3 acts in the CNS to regulate thermogenesis and AMPK signaling in BAT (but not in liver) via increased SNS activation of the β3-AR.
Central T3 Regulates Lipid Uptake in BAT
To determine how central T3-mediated increase in hepatic lipogenesis impacts FA uptake in peripheral tissues, T3 was ICV injected to rats pre-treated with 14C-oleate. Analysis of serum revealed a more rapid accumulation of 14C in the T3-treated rats (Figure 2A), with a shift toward the radiolabel being more abundant in the aqueous rather than in the lipid phase (Figure 2B). This suggested that FA removal from serum was increased alongside elevated β-oxidation of lipids, driving labeled water-soluble metabolites into the circulation. Central T3 increased 14C uptake in both liver and BAT per gram of tissue, where BAT exhibited the highest uptake rate (Figure 2C). However, when correcting for total organ weight, the liver had a significantly larger contribution to total lipid clearance (Figure 2D). Of note, liver displayed a significant increase in 14C-labeled TGs, indicating that FAs were being incorporated into newly synthesized TGs (Figure 2E), in keeping with the expression data of AMPK pathway, hepatic lipid, TG content, and lipogenesis (Figures 1A–1D), as well as LIPIN1 and DGAT1 (Figure S1F). In contrast, the tendency of reduced lipogenesis in BAT (Figure S1J), together with increased oxidative/thermogenic gene expression and elevated EE, glucose uptake, and mitochondrial and lipid droplet changes (Figures 1E–1J), suggests that the lipids being taken up by BAT serve as fuel for thermogenesis. Comparably, no regulation of 14C uptake was detected in WAT after central T3 administration in 14C-oleate-infused rats (Figures 2C and 2D), indicating that this treatment had a net EE rather than energy storage effect.
Figure 2.

Effect of T3 within the VMH on Liver and BAT
(A and B) 14C levels in serum (A) and lipid or aqueous phases (B) of rats ICV treated with vehicle or T3 (n = 9 rats/group).
(C–E) Total 14C content (C); 14C content corrected by tissue/organ weight in the liver, BAT, and WAT (D); and 14C TG content in serum, liver, and BAT (E) of rats ICV treated with vehicle or T3 (n = 9 rats/group).
(F) Body weight change, food intake, and body mass change of rats treated in the VMH with vehicle or T3 (n = 16–17 rats/group; 7 rats/group for NMR analysis).
(G–I) Protein levels of UPC1 in the BAT and the AMPK pathway in the BAT and liver of rats treated in the VMH with vehicle or T3 (n = 14 rats/group).
(J and K) Oil Red O (20×; scale bar, 100 μm) staining analysis (J) and TG levels in the liver of rats treated in the VMH with vehicle or T3 (n = 8–9 rats/group) (K).
(L–N) Protein levels of the AMPK pathway in the BAT (L) and liver (M) and UCP1 in the BAT (N) of rats treated in the VMH with adenoviruses encoding GFP or TR-DN (n = 8 rats/group).
(O and P) Oil Red O (20×; scale bar, 100 μm) staining analysis (O) and TG levels in the liver of rats treated in the VMH with adenoviruses encoding GFP or TR-DN (n = 8 rats/group) (P).
(Q) Protein levels of the AMPK pathway in the liver of sham or VGX rats treated in the VMH with vehicle or T3 (n = 8 rats/group).
(R and S) Oil Red O (20×; scale bar, 100 μm) staining analysis (R) and TG levels in the liver of sham or VGX rats treated in the VMH with vehicle or T3 (n = 8 rats/group) (S).
∗p < 0.05, ∗∗p < 0.01, ∗∗∗p < 0.001 versus vehicle ICV, vehicle VMH, sham, or GFP. Data are expressed as mean ± SEM. The bands in gels from (H), (I), (L)–(N), and (Q) have been spliced from the same original gels. See also Figure S2.
T3 in the VMH Regulates Lipid Metabolism in Liver and BAT
Next, we performed administration of T3 into the VMH or the ARC. The correct position of the cannulae was verified by histological examination (Figures S2A and S2B). In addition, when compared with acute injections in the VMH, chronic cannulae did not increase the immunoreactivity or the protein levels of inflammation markers in the VMH, such as ionized calcium-binding adaptor molecule 1 (IBA1), interleukin 6 (IL-6), nuclear factor kappa-light-chain enhancer of activated B cells (NFκB), and phosphorylated IκB kinase (pIKK) (Figures S2C and S2D).
T3 in the VMH promoted a feeding-independent weight loss and reduced adiposity (Figure 2F), associated with increased UCP1 protein levels in BAT (Figure 2G). This response was maintained when T3 was given for longer periods of time (Figure S2E), indicating that this action likely contributes to hyperthyroidism-induced weight loss. We found that VMH T3 increased pAMPK and pACC in BAT (Figure 2H). Conversely, it induced a downregulation of the AMPK pathway in the liver (Figure 2I), alongside increased lipid and TG accretion (Figures 2J and 2K), resembling the effects observed after ICV T3. To control the specificity, we analyzed “missed” T3 injections in “VMH neighboring” areas, without affecting the VMH; no changes in the AMPK pathway in liver and BAT were detected (Figure S2F). When T3 was administered into the ARC, there was a tendency for increased body weight at the end of the treatment, associated with hyperphagia, but no alterations in body composition (Figure S2G) or UCP1 protein levels in BAT (Figure S2H). Notably, no effects were found either in liver or BAT lipogenic program (Figure S2I).
To test this further, we ablated TH receptor (TR) action in the VMH of euthyroid and hyperthyroid rats by delivery of adenoviruses encoding a dominant-negative mutant of TR (TR-DN) or GFP (López et al., 2010). The infection efficiency was demonstrated by assaying GFP in the VMH (similar to Figure S3A). Injection of TR-DN into the VMH of euthyroid rats exerted opposite effects on liver and BAT AMPK pathway compared to those evoked by T3 administration in this same nucleus (Figure S2J). Of note, when adenoviruses harboring TR-DN targeted the VMH of hyperthyroid rats, they induced feeding-independent weight gain (body weight change: hyperthyroid GFP, 8.23 ± 2.0 g; hyperthyroid TR-DN, 15.0 ± 1.51 g, p < 0.01; food intake: hyperthyroid GFP, 31.35 ± 1.63 g; hyperthyroid TR-DN, 31.4 ± 1.44 g) and blunted the effect of hyperthyroidism on BAT metabolism (Figures 2L and 2M), but increased liver AMPK signaling (Figure 2N) and subsequently reduced hepatic lipid (Figure 2O) and TG content (Figure 2P). Next, we examined the effect of vagotomy on the actions of VMH T3 on liver and BAT. Our results were consistent with those obtained with ICV T3 injection, as vagotomy totally reverted the effects of VMH T3 on hepatic AMPK pathway (Figure 2Q), lipid content (Figure 2R), and TG levels (Figure 2S), without impacting either body weight (Figures S2K and S2L) or UCP1 (Figure S2M) in BAT. Altogether, these data demonstrate that the effect of T3 on the PSNS and liver metabolism originates from the TRs in the VMH.
Central Effects of T3 on Liver and BAT Depend on AMPK in the VMH
Hypothalamic AMPK mediates the central effect of T3 on BAT thermogenesis (López et al., 2010). To elucidate the contribution of AMPK activity in the hypothalamus to the lipogenic program in liver and BAT, adenoviruses encoding either a dominant-negative isoform of AMPKα (AMPKα-DN) (López et al., 2010, Martínez de Morentin et al., 2014) or GFP were injected into the VMH of euthyroid rats. The infection efficiency was demonstrated by assaying hypothalamic expression of GFP into the VMH (Figure S3A). Treatment with AMPKα-DN adenoviruses induced a feeding-independent weight loss (Figure 3A) associated with increased UCP1 levels in BAT (Figure 3B). Of note, inhibition of AMPKα recapitulated the effects of T3 injection in the VMH, namely increased AMPK signaling in BAT (Figure 3C) and decreased AMPK signaling and elevated lipid and TG content in the liver (Figures 3D–3F). Thus, we hypothesized that the central effect of T3 on hepatic and BAT metabolism was mediated by specific inhibition of AMPK in the VMH. To test this, adenoviruses encoding either a constitutively active isoform of AMPKα (AMPKα-CA) (López et al., 2010, Martínez de Morentin et al., 2014) or GFP were injected into the VMH of hyperthyroid rats. Overexpression of AMPKα-CA in the VMH was accompanied by weight gain in hyperthyroid rats, but not in euthyroid rats, with no alteration in feeding (Figure S3B). These effects were associated with reversal of the hyperthyroidism-induced effect on the lipogenic de novo pathway in liver and BAT (Figures 3G and 3H). To test this, AMPKα-CA adenoviruses were administered into the VMH of rats centrally treated with T3. Our data showed that constitutive activation of AMPK in the VMH reversed the effect of central T3 on body weight in a feeding-independent manner (Figure S3C) and normalized UCP1 levels in BAT (Figure S3D). Moreover, AMPKα-CA in the VMH reversed the effects of central T3 on the AMPK pathway in liver and BAT (Figures 3I and 3J). Together, these results are consistent with the observation that a reduction of AMPK activity in the VMH mediates the central effects of THs on liver and BAT lipid metabolism.
Figure 3.

Effect of Activation of AMPK within the VMH on the Central Actions of THs on Liver and BAT
(A) Body weight change and food intake of rats treated in the VMH with adenoviruses encoding GFP or AMPKα-DN (n = 23–25 rats/group).
(B–D) Protein levels of UCP1 in the BAT (B) and the AMPK pathway in the BAT (C) and liver (D) of rats treated in the VMH with adenoviruses encoding GFP or AMPKα-DN (n = 12–13 rats/group).
(E and F) Oil Red O (20×; scale bar, 100 μm) staining analysis (E) and TG levels in the liver of rats treated in the VMH with adenoviruses encoding GFP or AMPKα-DN (n = 12–14 rats/group) (F).
(G and H) Protein levels of the AMPK pathway in the liver (G) and BAT (H) of euthyroid and hyperthyroid rats treated in the VMH with adenoviruses encoding GFP or AMPKα-CA (n = 7 rats/group).
(I and J) Protein levels of the AMPK pathway in the liver (I) and BAT (J) of rats ICV treated with vehicle or T3 and treated in the VMH with adenoviruses encoding GFP or AMPKα-CA (n = 7 rats/group).
∗p < 0.05, ∗∗p < 0.01, ∗∗∗p < 0.001 versus GFP, euthyroid GFP, and vehicle ICV GFP; #p < 0.05, ##p < 0.01, ###p < 0.001, hyperthyroid GFP versus hyperthyroid AMPKα-CA or T3 ICV GFP versus T3 ICV AMPKα-CA. Data are expressed as mean ± SEM. The bands in gels from (B)–(D) and (G)–(J) have been spliced from the same original gels. See also Figure S3.
Ablation of AMPKα1 in SF1 Neurons of the VMH Fully Recapitulates the Effect of Central T3 on BAT and Liver Metabolism
It is known that steroidogenic factor 1 (SF1) neurons in the VMH play a major role in the regulation of energy balance by integrating peripheral signals (such as leptin, insulin, and estradiol) (Dhillon et al., 2006, Xu et al., 2011b, Chiappini et al., 2014) and central mediators (such as glutamate) (Tong et al., 2007). Moreover, it has been reported that SF1 neurons project to autonomic centers modulating the SNS (Lindberg et al., 2013, Chiappini et al., 2014). Given that T3 selectively regulates hypothalamic AMPKα1 (but not AMPKα2) expression and activity (López et al., 2010), we generated an SF1 neuron-specific AMPKα1 mouse line (SF1-Cre AMPKα1flox/flox) by crossing floxed AMPKα1 mice (Nakada et al., 2010) and SF1-Cre mice, which express Cre recombinase under SF1 promoter, hence targeting subsets of neurons of the VMH (Dhillon et al., 2006). Allele-specific PCR demonstrated that we successfully deleted AMPKα1 in the SF1 population of the VMH (Figure S4A). Deletion of AMPKα1 was observed in tissues in which SF1 is also endogenously expressed, such as the adrenal gland, testis, and pituitary (Figure S4A). In contrast, other tissues examined, including the cerebellum, cerebral cortex, and liver, did not show Cre-mediated recombination (Figure S4A). In addition, we also measured AMPKα1 levels using qRT-PCR and found significantly decreased expression of AMPKα1 in the VMH, but not in the cerebral cortex (Figure S4B) or liver (data not shown). To further verify AMPKα1 deletion in the SF1 population of the VMH, we performed in situ hybridization using an oligo-labeled probe against the deleted sequence. AMPKα1 mRNA (codified by Prkaa1) was reduced specifically in the VMH of SF1-Cre AMPKα1flox/flox mice, confirming the specific AMPKα1 deletion in SF1 neurons of the VMH (Figure S4C). Western blot analysis of the AMPK pathway in the VMH showed decreased pAMPK, AMPKα1 (but not AMPKα2), and pACC protein content (Figure S4D). On the other hand, FAS expression was elevated in the VMH of SF1-Cre AMPKα1flox/flox mice (Figure S4D).
SF1-Cre AMPKα1flox/flox mice showed a feeding-independent decrease in body weight and adiposity (Figures 4A–4C), coupled with increased EE (Figure 4D) and activation of the brown fat, as demonstrated by a higher 18F-FDG uptake analyzed by PET-CT (Figure 4E), BAT temperature (Figure 4F), and BAT sympathetic nerve traffic (Figure 4G). Of note, pharmacological inactivation of β3-AR with SR59230A reverted (in a feeding-independent manner) the weight loss and increased BAT temperature of SF1-Cre AMPKα1flox/flox mice (Figures S4E–S4G). Molecular analysis of BAT showed elevated mRNA and/or protein expression of all the thermogenic markers examined (Figures 4H and 4I). In relation to the liver, SF1-Cre AMPKα1flox/flox mice showed decreased activation of the AMPK pathway (Figure 4J), which was indicative of increased lipogenesis, as demonstrated by augmented hepatic TG content (Figure 4K). Overall, this evidence indicated that deletion of AMPKα1 in SF1 neurons of the VMH fully recapitulated the central effect of THs on BAT and liver metabolism.
Figure 4.

Effect of Deletion of AMPKα1 in SF1 Neurons in Liver and BAT
(A–C) Body weight (A), food intake (B), and fat depot mass (C) of SF1-Cre AMPKα1flox/flox mice (n = 15–25 mice/group).
(D) Cumulative EE of SF1-Cre AMPKα1flox/flox mice (n = 5–6 mice/group).
(E) 18F-FDG uptake analysis of SF1-Cre AMPKα1flox/flox mice (n = 5–6 mice/group).
(F) Infrared thermal images and quantification of temperature of BAT skin area of SF1-Cre AMPKα1flox/flox mice (n = 9–23 mice/group).
(G) BAT SNA of SF1-Cre AMPKα1flox/flox mice (n = 7–8 mice/group).
(H) mRNA levels of BAT genes of SF1-Cre AMPKα1flox/flox mice (n = 8 mice/group).
(I) Protein levels of thermogenic markers and proteins involved in lipolysis in the BAT of SF1-Cre AMPKα1flox/flox mice (n = 7 mice/group).
(J) Protein levels of AMPK pathway in the liver of SF1-Cre AMPKα1flox/flox mice (n = 7 mice/group).
(K) TG levels in the liver of SF1-Cre AMPKα1flox/flox mice (n = 9–10 mice/group).
∗p < 0.05, ∗∗p < 0.01, ∗∗∗p < 0.001, SF1-Cre AMPKα1flox/flox versus AMPKα1flox/flox. Data are expressed as mean ± SEM. The bands in gels from (I) and (J) have been spliced from the same original gels. iWAT, inguinal WAT; gWAT, gonadal WAT; vWAT, visceral WAT. See also Figure S4.
THs Alter Hypothalamic Lipid Composition and Reduce Ceramide Levels
To assess the molecular mechanisms mediating the effects of TH-induced decrease in AMPK in the VMH, we performed several experiments. Given that AMPK is one of the main upstream regulators of lipid metabolism (Kahn et al., 2005, López et al., 2016), we assayed hypothalamic lipid composition. We found no alterations in any of the saturated and unsaturated FAs measured in either the hypothalamus or cortex of hyperthyroid rats when compared with euthyroid rats (Figure S5A). Comparative multivariate analysis of the data identified clear differences in complex lipid profiles in the hypothalamus (Figure S5B), but not in the cortex (data not shown), between the two experimental groups. Thus, hyperthyroid rats displayed accumulation of most of the lipids analyzed except for ceramides, which were reduced in the hypothalamus and increased in the cortex (Figure S5C). Further analysis of individual ceramides showed that all species analyzed were decreased (Cer18, Cer20, and Cer24) or trended toward a decrease (Cer22) in the hypothalamus of hyperthyroid rats (Figure 5A). Consistent with this, we detected major changes in the mRNA expression profiles of key enzymes involved in the metabolism of complex lipids in the hypothalamus (Figure 5B), but not in the cortex (Figure S5D), of hyperthyroid rats. Notably, the enzymes involved in ceramide metabolism were also affected by the hyperthyroid status in the hypothalamus, showing reduced expression of ceramide synthase (LASS1, also called CERS1, codified by Lass1, also called Cers1) and elevated expression of sphingomyelin synthase 1 (SGMS1, codified by Sgms1) (Figure 5B), which is consistent with the decreased ceramide concentration. Conversely, in the cortex of hyperthyroid rats there was significant upregulation of LASS1 (Figure S5D), which agrees with the augmented ceramide levels.
Figure 5.

Effect of THs and AMPK on Hypothalamic Ceramides or ER Stress
(A–C) Ceramide levels (A), mRNA levels of the enzymes involved in the metabolism of complex lipids (B), and protein levels of the UPR in the hypothalamus of euthyroid or hyperthyroid rats (n = 8–15 rats/group) (C).
(D) Protein levels of the UPR in the MBH of rats ICV treated with vehicle or T3 (n = 7 rats/group).
(E and F) Protein levels of the UPR (E) and ceramide levels in the VMH of rats treated in the VMH with vehicle or T3 (n = 7–10 rats/group) (F).
(G and H) Protein levels of the UPR (G) and ceramide levels in the VMH of rats treated in the VMH with GFP-expressing adenoviruses or adenoviruses encoding a AMPKα-DN (n = 7–9 rats/group) (H).
(I) Protein levels of the UPR in the VMH of hyperthyroid rats treated in the VMH with adenoviruses encoding GFP or AMPKα-CA (n = 7 rats/group).
(J) Protein levels of the UPR in the VMH of SF1-Cre AMPKα1flox/flox (n = 7–14 rats/group).
∗p < 0.05, ∗∗p < 0.01, ∗∗∗p < 0.001 versus euthyroid, vehicle ICV, vehicle VMH, and GFP or hyperthyroid GFP versus hyperthyroid AMPKα-CA or SF1-Cre AMPKα1flox/flox versus AMPKα1flox/flox. Data are expressed as mean ± SEM. The bands in gels from (C)–(E), (G), (I), and (J) have been spliced from the same original gels. See also Figure S5.
THs Reduce Hypothalamic ER Stress
Current evidence has demonstrated that central ceramide-induced lipotoxicity triggers endoplasmic reticulum (ER) stress, leading to weight gain and decreased sympathetic tone and BAT thermogenesis (Contreras et al., 2014). Thus, we speculated that the reduced hypothalamic ceramide concentration induced by THs might impact ER stress and the protein levels of the unfolded protein response (UPR). Our data showed that hyperthyroid rats have reduced protein levels of UPR markers in the hypothalamus, such as activating transcription factor 6 alpha (ATF6α), C/EBP homologous protein (CHOP), and phosphorylated PKR-like ER kinase (pPERK). Moreover, the protein levels of the chaperone GRP78 (glucose-regulated protein 78 KDa, which acts upstream of the UPR to modulate protein folding in reply to cellular insults that lead to ER stress) were increased in the hypothalamus of hyperthyroid rats (Figure 5C). Similarly, ICV administration of T3 promoted decreased levels of the entire UPR, together with increased GRP78, in the mediobasal hypothalamus (MBH) (Figure 5D). These responses were recapitulated when T3 was administered in the VMH (Figure 5E), which also decreased VMH ceramide concentration (Figure 5F). Overall, this evidence demonstrates that THs reduce hypothalamic ceramide content and ER stress. In contrast, according to the elevated ceramide levels, the UPR was upregulated in the cortex, which was indicative of induced ER stress (Figure S5E). Next, we analyzed the UPR and the ceramide levels in the VMH of rats treated with adenoviruses harboring AMPKα-DN in that nucleus. We observed decreased ER stress (Figure 5G) and a tendency for a decrease in the VMH ceramide concentration (Figure 5H). Based on these observations, we hypothesized that the central effect of T3 on ER stress is mediated by specific inhibition of AMPK in the VMH. To address this possibility, adenoviruses encoding AMPKα-CA were injected into the VMH of hyperthyroid rats. Overexpression of AMPKα-CA reversed the hyperthyroid-induced downregulation of hypothalamic ER stress (Figure 5I). In keeping with this evidence, SF1-Cre AMPKα1flox/flox mice showed decreased ER stress in the VMH (Figure 5J).
Ceramides and Induction of ER Stress Reverse the Effect of Central THs on BAT, but Not on Liver
To address whether decreased ceramide-induced lipotoxicity and ER stress might mediate the central actions of THs on liver and BAT metabolism, we ICV treated hyperthyroid rats with C6 ceramide. Central administration of ceramide induced a marked feeding-independent weight gain (Figure 6A), which was associated with increased ceramide levels (hyperthyroid vehicle, 100% ± 6.37%; hyperthyroid ceramide ICV, 148.45% ± 4.70%; p < 0.001) and the UPR in the MBH (Figure S6A) and, importantly, with decreased UCP1 protein levels (Figure 6B) and AMPK signaling (Figure 6C) in the BAT. These data demonstrate that central ceramide administration reversed the effect of central T3 on BAT metabolism. Of note, no changes were found when the AMPK pathway was assayed in the liver (Figure 6D), indicating that the effect on BAT function is specific. To control the effect of ceramide, we initially performed ICV administration of C6-dihydroceramide (C6-DHC, an inactive form, used as a negative control) to hyperthyroid rats. C6-DHC did not increase either body weight or food intake (Figure S6B) or modulate BAT or hepatic metabolism (Figures S6C–S6E) when compared with ceramide treatment. Finally, we treated hyperthyroid rats with adenoviruses overexpressing serine palmitoyltransferase long chain base subunit 1 and 2 (SPTLC1-2, a rate-limiting enzyme in ceramide synthesis pathway) into the VMH. As above, the specificity of the injections was verified by the expression of GFP in the VMH and the increased (2-fold) ceramide levels in that area after adenoviral treatment (GFP, 100% ± 13.2%; SPTLC1-2, 220.31% ± 79.88%; p < 0.05). The findings recapitulate those we observed with central administration of ceramide: feeding-independent weight gain (Figure S6F), increased ER stress in the VMH (Figure S6G), and decreased AMPK activation and UCP1 expression in BAT (Figures S6H and S6I), without affecting hepatic AMPK pathway (Figure S6J).
Figure 6.

Effect of Hypothalamic Ceramide-Induced Lipotoxicity and ER Stress on the Central Action of THs on Liver and BAT
(A) Body weight change and food intake of hyperthyroid rats ICV treated with vehicle or C6 ceramide ICV (n = 9–10 rats/group).
(B–D) Protein levels of UCP1 in the BAT (B) and the AMPK pathway in the BAT (C) and liver (D) of hyperthyroid rats ICV treated with vehicle or C6 ceramide ICV (n = 7 rats/group).
(E) Body weight change and food intake of hyperthyroid rats treated in the VMH with adenoviruses encoding GFP or GRP78-DN (n = 22–25 rats/group).
(F–H) Protein levels of UCP1 in the BAT and the AMPK pathway in the BAT and liver of hyperthyroid rats treated in the VMH with adenoviruses encoding GFP or GRP78-DN (n = 13–15 rats/group).
∗p < 0.05, ∗∗p < 0.01, ∗∗∗p < 0.001 versus hyperthyroid vehicle ICV or hyperthyroid GFP VMH. Data are expressed as mean ± SEM. The bands in gels from (C), (F), and (G) have been spliced from the same original gels. See also Figure S6.
To assess the role of ER stress, we targeted GRP78 using an adenoviral vector encoding a dominant-negative isoform (GRP78-DN), which was injected into the VMH. Administration of GRP78-DN adenovirus into the VMH of hyperthyroid rats promoted feeding-independent weight gain (Figure 6E) associated with increased ER stress in the VMH (Figure S6K), reduced UCP1 levels (Figure 6F), and AMPK signaling in BAT (Figure 6G). No changes were detected in hepatic AMPK signaling (Figure 6H). Altogether, this evidence suggests that ceramide levels and ER stress in the VMH mediate the actions of T3 and AMPK on BAT, but not on liver metabolism.
JNK Inhibition Reverses the Central Actions of T3 on Liver, but Not on BAT
Recent evidence has shown that hypothalamic protein kinase C (PKC) plays a major role in the regulation of hepatic glucose metabolism through the ANS (Benoit et al., 2009). We found that PKCδ, but not PKCε, protein levels were elevated in the hypothalamus or the MBH of hyperthyroid and ICV T3-treated rats, respectively (Figures S7A and S7B), indicative of a potential role of PKCδ in T3 action. To examine this further, we used the PKC inhibitor rottlerin that, when given centrally, decreased protein levels of PKCδ and its downstream target, phosphorylated extracellular-signal-regulated kinase (pERK) (Figure S7C). However, our data showed no impact of rottlerin on hepatic pAMPK and pACC protein levels either in hyperthyroid or ICV T3-treated rats (Figures S7D and S7E), indicating that PKC pathway was not involved in the central actions of THs on liver.
c-Jun N-terminal kinase 1 (JNK1) plays a crucial role in the hypothalamic regulation of feeding and glucose metabolism (Sabio et al., 2010, Vernia et al., 2013, Tsaousidou et al., 2014). We analyzed JNK protein levels in the hypothalamus of hyperthyroid, ICV T3-treated, and VMH T3-treated rats. Interestingly, the protein levels of phosphorylated JNK (pJNK) were increased in the hypothalamus, MBH, and VMH, respectively, of those models (Figures 7A–7C). Furthermore, the effect of hyperthyroidism and T3 on pJNK was reversed when rats were simultaneously treated with AMPKα-CA into the VMH, indicating that the effect of THs was mediated by AMPK, which is upstream of JNK (Figures 7D and 7E). SF1-Cre AMPKα1flox/flox mice showed increased pJNK protein levels in the VMH, therefore recapitulating the effects of THs (Figure 7F).
Figure 7.

Effect of JNK1 in the VMH on the Central Actions of T3 on Liver and BAT
(A) Protein levels of JNK and pJNK in the hypothalamus of euthyroid and hyperthyroid rats (n = 7 rats/group).
(B) Protein levels of JNK and pJNK in the MBH of rats ICV treated with vehicle or T3 (n = 7 rats/group).
(C) Protein levels of JNK and pJNK in the VMH of rats treated in the VMH with vehicle or T3 (n = 7 rats/group).
(D) Protein levels of JNK and pJNK in the VMH of hyperthyroid rats treated in the VMH with adenoviruses encoding GFP or AMPKα-CA (n = 7 rats/group).
(E) Protein levels of JNK and pJNK in the VMH of rats ICV treated with vehicle or T3 and treated in the VMH with adenoviruses encoding GFP or AMPKα-CA (n = 11 rats/group).
(F) Protein levels of JNK and pJNK in the VMH of SF1-Cre AMPKα1flox/flox mice (n = 7 mice/group).
(G) Body weight change and food intake of wild-type (WT) and JNK1 KO mice ICV treated with vehicle or T3 (n = 12–16 mice/group).
(H and I) Protein levels of the AMPK pathway in the liver of WT (H) or JNK1 KO mice (I) ICV treated with vehicle or T3 (n = 12–16 mice/group).
(J and K) Oil Red O (40×; scale bar, 50 μm) staining analysis (J) and TG levels in the liver of WT or JNK1 KO mice ICV treated with vehicle or T3 (n = 11–15 mice/group) (K).
(L) Body weight change and food intake of JNK2 KO-JNK1flox/flox mice ICV treated with vehicle or T3 and treated in the VMH with AAV expressing GFP or Cre (n = 9-12 mice/group).
(M and N) Protein levels of the AMPK pathway in the liver of JNK2 KO-JNK1 floxed mice ICV treated with vehicle or T3 and treated in the VMH with AAV expressing GFP (M) or Cre (N) (n = 9–12 mice/group).
(O and P) Oil Red O (40×; scale bar, 50 μm) staining analysis (O) and TG levels in the liver of JNK2 KO-JNK1flox/flox mice ICV treated with vehicle or T3 and treated in the VMH with AAV expressing GFP or Cre (n = 6–12 mice/group) (P).
∗p < 0.05, ∗∗p < 0.01, ∗∗∗p < 0.001 versus euthyroid, vehicle ICV, vehicle VMH, GFP VMH, and T3 ICV vehicle ICV. Data are expressed as mean ± SEM. The bands in gels from (A)–(F), (H), (I), (M), and (N) have been spliced from the same original gels. See also Figure S7.
We also tested whether JNK might mediate the central actions of T3 on liver lipogenesis using the JNK inhibitor SP600125 (Imbernon et al., 2013). When given centrally, SP600125 decreased the MBH levels of phosphorylated c-Jun (p-c-Jun) and signal transducer and activator of transcription 3 (pSTAT3), indicating functional inhibition of JNK (Figure S7F). Of note, SP600125 did not interfere with the central effect of T3 on pAMPK in the MBH (Figure S7G), confirming that JNK was not upstream of AMPK. In addition, SP600125 treatment did not revert the central actions of T3 on either BAT UCP1 or AMPK pathway protein levels (Figures S7H and S7I). However, SP600125 was also able to reverse the central actions of T3 on the hepatic AMPK pathway, as indicated by the increased pAMPK and pACC protein levels (Figure S7J), alongside a reduction in lipid and TG content (Figures S7K and S7L), indicating that the effect was liver specific.
JNK1 in the VMH Mediates the Central Actions of T3 on Liver, but Not on BAT
Central T3 elicited feeding-independent weight loss in both wild-type (WT) and jnk1 null (JNK1 KO) mice (Figure 7G) and decreased AMPK signaling in the liver of WT mice (Figure 7H), but not in JNK1 KO mice (Figure 7I). In line with this, hepatic lipid and TG content (Figures 7J and 7K) was elevated in WT, but not in JNK1 KO mice. Notably, AMPK signaling was decreased in the ventromedial hypothalamus of both WT and JNK1 KO (Figure S7M), consistent with the observation above that AMPK is upstream of JNK1. UCP1 protein levels in BAT were increased by T3 in both WT and JNK1 KO mice (Figure S7N), suggesting that JNK1 mediated the actions of THs on liver, but not on BAT function.
We repeated the experiment using global jnk2 null (JNK2 KO) mice, which also carry floxed alleles of the jnk1 gene. We treated these mice in the VMH with adeno-associated viruses (AAVs) expressing GFP or the Cre-recombinase before ICV administration of T3, meaning that a group of jnk2 null mice have normal jnk1 and the ones treated with the Cre-recombinase have VMH-specific deletion of jnk1 gene. The infection efficiency was demonstrated by decreased levels of p-c-Jun and pSTAT3 in the VMH of Cre-treated mice, indicating functional inhibition of JNK1 (Figure S7O). ICV T3 decreased body weight in a feeding-independent manner in both groups (Figure 7L) and the AMPK signaling pathway in the liver of JNK2 KO-JNK1flox/flox mice that received AAV-expressing GFP (Figure 7M). However, the effect of central T3 on liver was totally absent in the mice previously treated with AAV-Cre in the VMH (Figure 7N). Accordingly, T3 increased lipid and TG content (Figures 7O and 7P) in the liver of GFP-, but not Cre-treated, mice. Consistent with our findings in the JNK1 KO mice, T3 decreased pAMPK levels in the VMH of both models (Figure S7P) and increased UCP1 protein levels in BAT (Figure S7Q). Overall, these data indicate that JNK1 in the VMH mediates the central T3 actions on hepatic lipogenesis, but not BAT function.
Discussion
THs regulate lipid synthesis in liver, muscle, WAT, BAT, and hypothalamus by modulating expression and activation of key lipogenic enzymes such as ACC, FAS, and AMPK (López et al., 2013, Mullur et al., 2014), as well as autophagy (Sinha et al., 2012). Although relevant effects of THs on energy balance have been reported, the central action of THs on peripheral lipid metabolism remains uncertain. This question is of interest for several reasons. First of all, very recent evidence shifted the “classical” view of the mode of action from “peripheral perspective” (Silva, 2006) to a “central perspective” (Fliers et al., 2010, Warner and Mittag, 2012, López et al., 2013), recognizing the brain as a major mediator of the metabolic actions of THs. Second, dysregulation of the thyroid axis in humans leads to marked alterations in energy balance; for example, up to 85% of patients with hyperthyroidism exhibit weight loss despite increased food intake (Silva, 2006, López et al., 2013). Moreover, hyperthyroid patients show increased hepatic lipogenesis (Cachefo et al., 2001), enhanced lipolysis, and TG and FA cycling, which contribute to higher EE (Beylot et al., 1991). Third, the potential of THs as a target in the treatment of obesity has been known for decades and recent evidence has placed glucagon-T3 conjugates in the possible pipeline for obesity treatment (Finan et al., 2016). Thus, the precise understanding of the central actions of T3 on metabolism is necessary for the development of therapies for obesity, but also for TH-associated metabolic disorders.
We focused on the contribution of the central effects of THs to the lipid alterations observed in the hyperthyroid state. Our data showed that, when administered centrally, T3 promotes the same pattern of expression in pro-lipogenic enzymes as observed in the hyperthyroid liver and BAT. Notably, these actions specifically target the VMH. Indeed, administration of the hormone into the ARC did not recapitulate the effects on liver and BAT lipogenic programs evoked by VMH T3. Recent evidence has substantially expanded our understanding of the metabolic roles of the VMH, demonstrating extensive functionality of this hypothalamic area in the control of food intake (Dhillon et al., 2006), EE (López et al., 2010, Xu et al., 2011b, Martínez de Morentin et al., 2014, Contreras et al., 2014), and peripheral glucose homeostasis (Tong et al., 2007). Of note, many of those effects also appear to involve one specific neuronal population of the VMH, namely SF1 neurons, the same population where AMPK conducts its actions on BAT and liver metabolism. This is based on our finding that SF1 neuron-specific ablation of the AMPKα1 isoform, which is downregulated by THs (López et al., 2010), entirely recapitulates the central effects of T3 on energy balance. Altogether, this evidence demonstrates that SF1 neurons of the VMH mediate the central effect of THs on metabolism. Although nearly all VMH neurons express SF1, numerous subpopulations can be distinguished based on their differential expression of several proteins, including brain-derived neurotrophic factor (Segal et al., 2005), insulin and leptin receptors (Klöckener et al., 2011, Dhillon et al., 2006), estrogen receptor α (Xu et al., 2011b), and vesicular glutamate transporter 2 (VGLUT2) (Tong et al., 2007, Cheung et al., 2015). Besides that, SF1 neurons project broadly within the CNS. They send axons to the C1 catecholamine cell group of the rostral ventrolateral medulla (RVLM), which controls the sympathetic outflow to BAT (Lindberg et al., 2013, Morrison et al., 2014). Neuronal fibers originating from the VMH SF1 neurons also reach other hypothalamic regions involved in SNS and PSNS outflow, including the ARC and PVH (Lindberg et al., 2013, Morrison et al., 2014). Notably, specific ablation of VGLUT2 in SF1 neurons has been shown to impair neuronal activation in the DMV (Tong et al., 2007), a key site that gives rise to the PSNS fibers innervating the liver (Fliers et al., 2010). That heterogeneity could explain the ability of these neurons to control both the SNS and the PSNS, although it is likely that the neuronal circuits modulating both branches of the ANS may involve separate subpopulations of SF1 neurons.
We have also defined the exact downstream mechanisms linking AMPK in the VMH with peripheral metabolism. We provide evidence that a T3-induced decrease in AMPK in the VMH promotes a dichotomic mechanism involving ceramide-ER stress and JNK1 to modulate BAT and liver function, respectively. Recent data have shown that ceramide-induced lipotoxicity and ER stress lead to decreased thermogenesis and weight gain (Contreras et al., 2014). Our data show that a T3-induced reduction in AMPK activity promotes decreased hypothalamic ceramide concentration and subsequent reduction in ER stress. Of note, augmented ceramide levels in the cortex lead to increased ER stress at this level, which suggests that THs induce regional modulation of lipid metabolism and ER stress in the brain. The mechanistic role of ceramides on the hyperthyroid phenotype was demonstrated by administration of C6 ceramide, overexpression of SPTCL1-2 in the VMH, and a specific increase of ER stress in the VMH by GRP78-DN, all of which blocked TH actions on BAT, but not on liver. Overall, these data suggest that AMPK-induced changes in ceramides and ER stress, specifically in the VMH, mediate the central actions of THs on BAT and energy balance. Although the precise mechanism whereby T3 regulates AMPK signaling is yet to be elucidated, our previous findings have clearly demonstrated that this effect is mediated by TRα1 (López et al., 2010). Considering the rapid time course of TH effects we report, it is tempting to speculate that non-genomic actions through the membrane-bound TRα (Kalyanaraman et al., 2014) or the mitochondrial TRα isoform p43 (Sayre and Lechleiter, 2012) could contribute to the regulation of AMPK. However, using a transgene mouse for a GFP-tagged TRα, it has been demonstrated that at least in the brain all T3-binding isoforms from this receptor are nuclear (Wallis et al., 2010). Consequently, since our observations are still within the timeframe of T3-mediated genomic actions, which can be observed as early as 1–3 hr in vivo (Izquierdo and Cuezva, 1993, Erion et al., 2007), it seems most likely that T3 modulates AMPK signaling through TRα1-mediated changes in gene transcription, a possibility that is further supported by the decreased AMPKα1 (total, non-phosphorylated) protein levels in the hypothalamus after T3 and T4 treatments (López et al., 2010). Another important question is how modulation of ER stress and ceramides could be connected to changes in neuronal activity. It has been reported that ER stress causes altered calcium signaling in neurons by impairing the activity of ER-resident calcium-release channels and inositol 1,4,5-trisphosphate receptor (IP3R); notably, GRP78 (which is increased in the hypothalamus after THs treatments) plays a protective role (Narayanan et al., 2010, Higo et al., 2010). The interaction of ER and mitochondria, which modulates neuronal excitability, is another potential mechanism. For example, ablation of mitofusin 2 (MFN2), which results in loss of ER-mitochondria contacts, increases ER stress and decreases neuronal firing (Dietrich et al., 2013, Schneeberger et al., 2013). Whether central T3 impacts the ER-mitochondria connection in hypothalamic neurons is presently unknown, but further work is warranted.
We present conclusive evidence that T3 regulates hepatic lipogenic pathway by modulating AMPK and JNK1, specifically in the VMH, leading to hepatic vagal activation, as supported by VGX experiments. The positive effect of JNK1 on neuronal activation has been previously described in AgRP neurons (Tsaousidou et al., 2014). The molecular mechanisms underlying this action are unclear, but it is known that JNK1 regulates several processes related to brain morphogenesis, neuronal activity, axo-dendritic architecture, and synaptic plasticity (Sherrin et al., 2010, Xu et al., 2011a, Mohammad et al., 2017). The net result of central T3 is a PSNS-mediated increase of the lipogenic rate in the liver. In this regard, our data demonstrate that de novo FA synthesis and uptake into liver are increased and incorporated into TGs. The concomitant increase in the appearance of 14C in BAT is consistent with the data showing that central (ICV or VMH) T3 increases the thermogenic program in this tissue, the glucose uptake, and the mitochondrial activity and dynamics, leading to increased EE and decreased RQ. Since THs modulate FA uptake in a tissue-specific manner (Klieverik et al., 2009), it is likely that the 14C in BAT arises from both direct uptake of circulating FA (Ouellet et al., 2012) and hepatic TG in the form of TG-rich lipoproteins (TRLs) that are known to contribute greatly to BAT lipid content during thermogenesis (Bartelt et al., 2011). Therefore, T3 acts within the VMH in a manner that seems to maximize the metabolic capacities of each organ, leading to an overall effect of negative energy balance and weight loss, despite unchanged food intake.
In summary, central T3 regulates hepatic metabolism through the vagus nerve and BAT through the SNS, leading to increased lipid oxidation and thermogenesis. This physiological pathway is mediated by AMPK (specifically in SF1 neurons of the VMH), which also exerts a dichotomic action on ceramide-induced ER stress and JNK1. Overall, our results uncover the interconnected nature of these mechanisms in terms of TH actions at the whole-body level to regulate organism lipid handling and their relevance to energy and metabolic homeostasis. This knowledge should aid in the more rationally based design of drugs for the treatment of obesity and its comorbidities.
STAR★Methods
Key Resources Table
| REAGENT or RESOURCE | SOURCE | IDENTIFIER |
|---|---|---|
| Antibodies | ||
| Rabbit monoclonal Anti-AcetylCoA Carboxylase 1 | Merck Millipore | 04-322; RRID: AB_673047 |
| Rabbit polyclonal Anti-AMPKα1 | Merck Millipore | 07-350; RRID: AB_310542 |
| Rabbit polyclonal Anti-AMPKα2 | Merck Millipore | 07-363; RRID: AB_310553 |
| Rabbit Anti-IRE1 α (14C10) | Cell Signaling Technology | 3294S; RRID: AB_823545 |
| Rabbit monoclonal Anti-phospho-AMPK α (Trh172) | Cell Signaling Technology | 2535S; RRID: AB_331250 |
| Rabbit monoclonal Anti-PERK (C33E10) | Cell Signaling Technology | 3192S; RRID: AB_2095847 |
| Rabbit polyclonal Anti-Phospho-AcetylCoA Carboxylase (Ser79) | Cell Signaling Technology | 3661; RRID: AB_330337 |
| Rabbit monoclonal Anti-p-SAPK/JNK (T183/Y185) | Cell Signaling Technology | 4671S; RRID: AB_331338 |
| Rabbit Anti-Phospho-HSL (S660) | Cell Signaling Technology | 4126S; RRID: AB_490997 |
| Rabbit Anti-P-c-Jun (S63) | Cell Signaling Technology | 9261L; RRID: AB_2130159 |
| Rabbit Anti-GRP78 | Cell Signaling Technology | 3183S; RRID: AB_10695864 |
| Rabbit monoclonal Anti P-p44/42 MAPK (Anti-pERK) | Cell Signaling Technology | 4370; RRID: AB_2315112 |
| Rabbit Anti-Phospho-Stat3 (Ser727) | Cell Signaling Technology | 9134S; RRID: AB_331589 |
| Mouse monoclonal Anti-Fatty Acid Synthase | BD Biosciences | 610963; RRID: AB_398276 |
| Rabbit Anti-ATF6 α (H-280) | Santa Cruz Biotechnology | sc-22799; RRID: AB_2242950 |
| Rabbit Anti-GADD 153 (R-20) | Santa Cruz Biotechnology | sc-793; RRID: AB_2242950 |
| Rabbit Anti-Phospho-eIF2 α (Ser52) | Santa Cruz Biotechnology | sc-101670; RRID: AB_631364 |
| Rabbit Anti-Phospho-PERK (Thr981) | Santa Cruz Biotechnology | sc-32577; RRID: AB_2293243 |
| Rabbit polyclonal Anti-JNK1/3 (C-17) | Santa Cruz Biotechnology | sc-474; RRID: AB_632383 |
| Mouse monoclonal Anti-PKC δ (G-9) | Santa Cruz Biotechnology | sc-8402; RRID: AB_628145 |
| Rabbit polyclonal Anti-NFκB p65 (C-20) | Santa Cruz Biotechnology | sc-372; RRID: AB_632037 |
| Rabbit polyclonal Anti-p-IKKα/β | Santa Cruz Biotechnology | sc-23470-R; RRID: AB_2122159 |
| Rabbit polyclonal Anti-c-FOS | Santa Cruz Biotechnology | sc-52; RRID: AB_2106783 |
| Mouse monoclonal Anti-α-tubulin | Sigma-Aldrich | T5168; RRID: AB_477579 |
| Mouse monoclonal Anti-β-Actin | Sigma-Aldrich | A5316; RRID: AB_476743 |
| Rabbit Anti-Phospho-IRE1 α (Ser724) | Abcam | ab48187; RRID: AB_873899 |
| Rabbit polyclonal Anti-UCP1 | Abcam | ab10983; RRID: AB_2241462 |
| Rabbit polyclonal Anti-UCP3 | Abcam | ab3477; RRID: AB_2304253 |
| Rabbit polyclonal Anti-Hormone sensitive lipase | Abcam | ab45422; RRID: AB_2135367 |
| Rabbit monoclonal Anti-PKC ε | Abcam | ab124806; RRID: AB_10973051 |
| Rabbit polyclonal Anti-SPTLC2 | Abcam | ab23696; RRID: AB_447617 |
| Rabbit polyclonal Anti-SPTLC1 | Abcam | ab84585; RRID: AB_2195858 |
| Rabbit polyclonal Anti-IL6 | Abcam | ab6672; RRID: AB_2127460 |
| Mouse monoclonal Anti-IBA1 | Abcam | ab15690; RRID: AB_2224403 |
| Bacterial and Virus Strains | ||
| Adenoviral GFP (López et al., 2010, Martínez de Morentin et al., 2014) | Viraquest | N/A |
| Adenoviral GFP (López et al., 2010, Martínez de Morentin et al., 2014) | Signagen | N/A |
| Adeno-associated GFP (In this paper) | Signagen | N/A |
| Adenoviral AMPKα-DN (López et al., 2010, Martínez de Morentin et al., 2014) | Viraquest | N/A |
| Adenoviral AMPKα-CA (López et al., 2010, Martínez de Morentin et al., 2014) | Viraquest | N/A |
| Adenoviral GRP78-DN (Contreras et al., 2014) | Viraquest | N/A |
| Adenoviral TR-DN (López et al., 2010) | Viraquest | N/A |
| Adenoviral SPTLC1-2 (In this paper) | Viraquest | N/A |
| Adeno-associated Cre (In this paper) | Signagen | N/A |
| Chemicals, Peptides, and Recombinant Proteins | ||
| L-thyroxine sodium salt pentahydrate | Sigma-Aldrich | T2501 |
| Xylazin hydrochloride | Rompun (Bayer) | N/A |
| Ketamine (for experiments in University of Santiago, Spain) | Imalgene (Elasa) | N/A |
| Ketamine (for experiments in University of Iowa, USA) | Akorn (Lake Forest, IL USA) | N/A |
| Isoflurane | BAXTER SL | NR60378 |
| Oxygen | Air Liquide SLU | ESGCG101710035000 |
| 3,3′,5-Triiodo-L-thyronine | Sigma-Aldrich | T2877 |
| N-Hexanoyl-D-sphingosine (C6 ceramide) | Sigma-Aldrich | 6524 |
| SR59230A hydrochloride | Tocris Bioscience | 1511 |
| C6-DHC (C6-dihydroceramide) | Sigma-Aldrich | C8230 |
| JNK inhibitor SP600125 | Tocris Bioscience | 1496 |
| Rottlerin | Calbiochem | 557370 |
| DMEM Low glucose (Supplemented with glucose up to 4,5g/L) | Sigma-Aldrich | 2905 |
| DMEM without sodium bicarbonate | GIBCO, Life Technologies | 12800-058 |
| Albumin Fraction V (Fatty acid free) | Roche | 10775835001 |
| Insulin (Insulated FlexPen 100Ul/ml) | Novo nordisk | 8-9657-51-202-3 |
| Palmitic Acid | Sigma-Aldrich | P0500 |
| Hionic Fluor (Scintillation Cocktail) | Perkin Elmer | 6013319 |
| Cocktail Biogreen3 for liquid scintillation | Scharlau | CO015005P |
| Acetic acid sodium salt [3H] (0,1Ci/mmol) | Perkin Elmer | NET003 |
| Palmitic acid [1-14C] (56,1mCi/mmol) | Perkin Elmer | NEC075H |
| Perchloric acid | Scharlau | AC17601000 |
| Natriumacetat-trihydrat | Merck | K34638967518 |
| Dimethyl Sulfoxide (DMSO) | Sigma-Aldrich | D8418 |
| Sodium pyruvate | GIBCO, Life Technologies | SH30239.01 |
| L-glutamine | GIBCO, Life Technologies | 25030-024 |
| Succinate | Sigma-Aldrich | S9512 |
| Rotenone | Sigma-Aldrich | R8875 |
| 2-18F-Fluoro-2-Deoxy-2-Glucose (18F-FDG) | GALARIA Centro PET S.L. | Batch 5676234521 |
| FDG Cassette | ABX Advanced Biochemical Compounds | http://www.abx.de/ |
| EMbed 812 resin | Electron Microscopy Sciences | EMS 14120 |
| Food industry FAME mix | Restek Corporation | 35077 |
| Supelco 46904 Vaccenic Methyl ester | Sigma-Aldrich | CRM46905 |
| N-lauroyl-D-erythro-sphingosine. C12 Ceramide (d18:1/12:0) | Avanti Polar Lipids | 860512P |
| N-palmitoyl-D-erythro-sphingosine C16 Ceramide (d18:1/16:0) | Avanti Polar Lipids | 860516P |
| N-heptadecanoyl-D-erythro-sphingosine C17 Ceramide (d18:1/17:0) | Avanti Polar Lipids | 860517 |
| N-stearoyl-D-erythro-sphingosine C18 Ceramide (d18:1/18:0) | Avanti Polar Lipids | 860518P |
| N-lignoceroyl-D-erythro-sphingosine. C24 Ceramide (d18:1/24:0) | Avanti Polar Lipids | 860524P |
| N-nervonoyl-D-erythro-sphingosine. C24:1 Ceramide (d18:1/24:1(15Z)) | Avanti Polar Lipids | 860525P |
| Alpha-chloralose | MP Biomedical (Solon, OH, USA) | 100459 |
| 14C labeled 2-Deoxy-Glucose (Deoxy-D-glucose, 2-[14C(U)] | Perkin Elmer | NEC720A050UC |
| Dako EnVision system, peroxidase | Dako | K5007 |
| Oil Red O solution | Sigma-Aldrich | O1391 |
| Harris’ Hematoxylin | Bio-Optica | 05-06005/L |
| Mount Quick Aqueous | Bio-Optica | 05-1740 |
| Trizol Reagent | Invitrogen | 15596018 |
| M-MLV enzyme | Invitrogen | 28025- 013 |
| 35S- αdATP | Perkin Elmer | NEG 0345 |
| Terminal deoxynucleotidil transferase | New England Biolabs | MO315S |
| Deionited Formamide | Sigma-Aldrich | F9037 |
| Denhardt's solution | Sigma-Aldrich | D2532 |
| Dextran Sulfate | Sigma-Aldrich | D8906 |
| Fixator (Manual Fixing Bath) | AGFA | G354 |
| Developer (Replenisher) | AGFA | G150 |
| Sheared Single- Stranded Salmon Sperm DNA | Sigma-Aldrich | D9156 |
| Tri- Sodium Citrate dihydrate | MERCK | A73548612 |
| Ethylene glycol-bis(2-aminoethylether)-N,N,N′,N′-tetraacetic acid (EGTA) | Sigma-Aldrich | E3889-500G |
| Ethylenediaminetetraacetic acid (EDTA) | Sigma-Aldrich | E9884-500G |
| Triton X-100 | Sigma-Aldrich | X100-500ml |
| Sodium orthovanadate: | Sigma-Aldrich | S6508-50G |
| Sodium fluoride | Sigma-Aldrich | S7920-100G |
| Sodium pyrophosphate | Sigma-Aldrich | 221368-500G |
| Sucrose | Sigma-Aldrich | S0389 |
| Protease Inhibitor Cocktail Tablets | Roche Dieagnostics | 11697498001 |
| Protein Assay Dye Reagent Concentrate (Bradford) | Bio-Rad | 500- 0006 |
| 30% Acrilamide/ Bis Solution 29:1 | Bio- Rad | 161- 0156 |
| Critical Commercial Assays | ||
| Fatty acids Kit | Wako chemicals | R1: 434-91795; R2: 436-91995 |
| TG kit | Spinreact | 1001314 |
| ELISA FGF21 mouse/rat | Biovendor | RD291108200R |
| Ketone kit | Wako chemicals | R1: 415-73301; R2: 413-73601 |
| TSH ELISA Kit | Crystal Chem | 80564 |
| T3 ELISA Kit | Crystal Chem | 80985 |
| T4 ELISA Kit | Crystal Chem | 80983 |
| Experimental Models: Organisms/Strains | ||
| Sprague-Dawley rats | Animalario Central USC (Spain) | N/A |
| Sprague-Dawley rats (for experiments in University of Iowa, USA) | Harlan Sprague-Dawley (Indianapolis, IN, USA) | Model 002; RRID: RGD_70508 |
| JNK1 KO: B6.129S1-Mapk8tm1Flv/J (in the paper: null Jnk1 mice) | Howard Hughes Medical Institute (Dr. Roger J Davis) and CNIO (Dr. Guadalupe Sabio) | RRID: IMSR_JAX:004319 |
| JNK2 KO-JNK1flox/flox:B6.129-Mapk8LoxP/LoxP Mapk9m1Flv/J (in the paper: null Jnk2 and Jnk1flox/flox) | Howard Hughes Medical Institute (Dr. Roger J Davis) and CNIO (Dr. Guadalupe Sabio) | N/A |
| C57BL/6 wildtype | Fundación Centro Nacional de Investigaciones Cardiovasculares Carlos III (Madrid, Spain) | N/A |
| SF1-Cre AMPKα1flox/flox | In this paper | N/A |
| Mixed Background AMPKα1flox/flox | In this paper | N/A |
| Mouse SF1-Cre:(Tg(Nr5a1-cre)Lowl/J | The Jackson Laboratory | JAX: 012462; RRID: IMSR_JAX:012462 |
| Mouse AMPKα1flox/flox: Prkaa1tm1.1Sjm/J | The Jackson Laboratory | JAX: 014141; RRID: IMSR_JAX:014141 |
| Oligonucleotides | ||
| Genotyping primer AMPKα1(Prkaa1) loxP site Forward: 5′-CCCACCATCACTCCATCTCT-3′ | Eurofins | The Jackson laboratory (stock number: 014141); NM_001013367 |
| Genotyping primer AMPKα1 (Prkaa1) loxP site Reverse: 5′-AGCCTGCTTGGCACACTTAT-3′ | Eurofins | The Jackson laboratory (stock number: 014141); NM_001013367 |
| Genotyping primer AMPKα1 (Prkaa1) deleted allele Forward: 5′-CCCACCATCACTCCATCTCT-3′ | Eurofins | The Jackson laboratory (stock number: 014141); NM_001013367 |
| Genotyping primer AMPKα1 (Prkaa1) deleted allele Reverse: 5′-CCCACATAGGAAAGCGTGTT-3′ | Eurofins | The Jackson laboratory (stock number: 014141); NM_001013367 |
| SF1-Cre transgene Forward: 5′-CTGAGCTGCAGCGCAGGGACAT-3′ | Eurofins | The Jackson laboratory (stock number: 012462); NC_000068.7 |
| SF1-Cre transgene Reverse: 5′-TGCGAACCTCATCACTCGTTGCAT-3′ | Eurofins | The Jackson laboratory (stock number: 012462); NC_000068.7 |
| In situ hybridization primer TRH 5′- ATACCAGTTAGGGTGAAGATCAAAGCCAGAGCCAGCAGCAACCAA-3′ | Eurofins | NM_013046 |
| In situ hybridization primer TRH (Trh) AMPKa1 (5′- GCTCTCCTCCAGAGACATATTCCATCACCATGA-3′ | Eurofins | NM_013046 |
| RT-PCR primers | See Table S1 | N/A |
| Software and Algorithms | ||
| Bruker Albira Suite Software Version 5.0. Scatter | Bruker Biospin | https://www.bruker.com/ |
| FLIR-Tools-Software | FLIR | http://www.flir.com/instruments/display/?id=54865 |
| ImageJ | NIH | https://imagej.nih.gov/ij/index.html; RRID: SCR_003070 |
| Xcalibur | Thermo Fisher Scientific | OPTON-2050; RRID: SCR_014593 |
| MassLynx | Waters | http://www.waters.com/waters/es_ES/MassLynx-Mass-Spectrometry-Software-/nav.htm?cid=513164&locale=es_ES; RRID: SCR_014271 |
| MZmine 1 v.0.60 | MZmine | http://mzmine.github.io/download.html; RRID: SCR_012040 |
| Prism | Graph Pad | https://www.graphpad.com/scientific-software/prism/; RRID: SCR_002798 |
| AMIDE | AMIDE | http://amide.sourceforge.net/; RRID: SCR_005940 |
| LabChart (version 5) | ADInstruments | https://www.adinstruments.com; RRID: SCR_001620 |
| Other | ||
| Osmotic Minipump | Durect Corporation (Alzet Osmotic Pumps) | Model 2001 |
| Osmotic Minipump | Durect Corporation (Alzet Osmotic Pumps) | Model 1007D |
| Osmotic Minipump | Durect Corporation (Alzet Osmotic Pumps) | Model 1004D |
| Stereotaxic Frame | David Kopf Instruments | Model 900 |
| 22-gauge needle | Hamilton | 1702N |
| 25-gauge needle | Hamilton | 7001N |
| 28-gauge stainless steel cannula (Imbernon et al., 2013, Martínez-Sánchez et al., 2017) | Plastics One | N/A |
| Polyethylene Tubes (PE50) | Becton Dickinson and Company | 427411 |
| Polyethylene Tubes (PE20) | Becton Dickinson and Company | 427406 |
| Whatman paper 3MM Chr | GE Healthcare | 3030-931 |
| Catheter tubes | Degania Medical | 2110060149IZ |
| Seahorse Bioscience XF24-3 Extracellular Flux Analyzer | Seahorse Bioscience (Agilent technologies) | N/A |
| XF24-3 fluxpak | Seahorse Bioscience (Agilent technologies) | 102070-001 |
| XF24 Islet Capture Microplates | Seahorse Bioscience (Agilent technologies) | 101122-100 |
| Albira PET/CT Preclinical Imaging System | Bruker Biospin | https://www.bruker.com/ |
| Multi-anode photomultiplier tubes | Bruker Biospin | https://www.bruker.com/ |
| AMIDE medical imaging viewer | Stanford University | http://amide.sourceforge.net/ |
| Calorimetric System LabMaster | TSE Systems | N/A |
| B335: Compact-Infrared-Thermal-Imaging-Camera | FLIR | N/A |
| HIP-511: High-impedance probe | Grass Instruments | N/A |
| P5 AC pre-amplifier. | Grass Instruments | N/A |
| Nerve traffic analysis system (Model 706C) | University of Iowa Bioengineering | N/A |
| Oscilloscope (model 54501A) | Hewlett-Packard | N/A |
| Resetting voltage integrator (Model B600c) | University of Iowa Bioengineering | N/A |
| JEM-1400 Transmission Electron Microscope | Jeol | N/A |
| Thermo Finnigan Focus GC | Thermo Scientific | N/A |
| Thermo Scientific TR-FAME column | Thermo Scientific | N/A |
| Thin-layer chromatography (TLC) silica sheets 20x20 cm | Merck Millipore | 1055530001 |
| 300SL Liquid Scintillation Counter | LabLogic | N/A |
| API 3000 PE Sciex LC-ESI-MS/MS System | Spectralab Scientific | N/A |
| OA-ToF Premier Mass Spectrometer | Waters | N/A |
| Q-ToF Premier Mass Spectrometer | Waters | N/A |
| UPLC/MS | Waters | N/A |
| Acquity UPLC BEH C8 | Waters | 186002878 |
| Acquity UPLC BEH C18 | Waters | 186002350 |
| 7500 Real Time PCR System | Thermo Fisher Scientific | 4351105 |
| PVDF transfer membrane | MERCK Millipore | IPVH00010 |
| Olympus XC50 | Olympus Corporation | N/A |
| Olympus IX51 | Olympus Corporation | N/A |
| EcoMRI 700: Body Composition Analyzer | EcoMRI | Model 700 |
| Cryostat | Leica Biosystems | CM 1850 UV |
| Serum Vacutainer | BD | 367957 |
| Lock Spray Mass Ionization Source | Waters | N/A |
| Hyperfilm β-Max | Amersham | N/A |
| Medical X- Ray Film | Fujifilm | 47410 19289 |
| BioMax MR Film | Kodak | 871 5187 |
Contact for Reagent and Resource Sharing
Further information and requests for resources and reagents should be directed to and will be fulfilled by the Lead Contact, Miguel López (m.lopez@usc.es).
Experimental Model and Subject Details
Animals
Adult male Sprague-Dawley rats (8-10 weeks old, 200-250 g; Animalario General USC, Santiago de Compostela, Spain), adult male null Jnk1 mice (C57BL/6 background; 8-10 weeks old), adult male null Jnk2 and Jnk1flox/flox and their wild-type mice (C57BL/6 background; 8-10 weeks old; Fundación Centro Nacional de Investigaciones Cardiovasculares Carlos III, Madrid, Spain), and adult male null SF1-Cre AMPKα1flox/flox mice (mixed background; 20 weeks old; The Jackson Laboratory, Bar Harbor, ME, USA) and their littermates were used. During all experimental approaches the animals were daily monitored for food intake and body weight changes, at the same hour. Protocols used for animals that received radiolabeled lipid were in accordance with the United Kingdom Home Office legislation (Animal Scientific Procedure Act 1986). All the other experiments were performed in agreement with the International Law on Animal Experimentation and were approved by the USC Ethical Committee (Project ID 15010/14/006) and University of Iowa Institutional Animal Care and Use Committee.
To generate SF1 neuron-specific AMPKα1 knock-out mice (SF1-Cre AMPKα1flox/flox), SF1-Cre mice (Tg(Nr5a1-cre)Lowl/J, stock number 012462; The Jackson Laboratory, Bar Harbor, ME, USA) were crossed with AMPKα1 floxed mice (AMPKα1flox/flox mice, Prkaa1tm1.1Sjm/J; stock number 014141; The Jackson Laboratory; Bar Harbor, ME, USA) that possess loxP sites flanking exon 3 of Prkaa1 gene. Littermates of the same mixed background strain generation were used as controls. Animals were genotyped by PCR with the following set of primers: AMPKα1 loxP site: Forward: 5′-CCCACCATCACTCCATCTCT-3′, Reverse: 5′-AGCCTGCTTGGCACACTTAT-3′; AMPKα1 deleted allele: Forward: 5′-CCCACCATCACTCCATCTCT-3′, Reverse: 5′-CCCACATAGGAAAGCGTGTT-3′ and SF1-Cre transgene: Forward: 5′-CTGAGCTGCAGCGCAGGGACAT-3′, Reverse: 5′-TGCGAACCTCATCACTCGTTGCAT-3′. The deleted allele produced an amplicon of 530 bp.
Housing conditions
The animals were housed with an artificial 12 hr light (8:00 to 20:00)/12 hr dark cycle, under controlled temperature and humidity conditions and allowed to free access to standard laboratory chow and tap water. For all the procedures, the animals (rats and mice) were caged individually, unless otherwise stated, and used for experimentation 5-7 days later. During this post-operative recovery period the animals became accustomed to the handling procedure under non-stressful conditions. SF1-Cre AMPKα1flox/flox mice and their littermates were housed in groups, except for food intake analyses, calorimetric system and the β3-AR antagonist experiment, for which they were caged individually. During the induction of hyperthyroidism and VGX recovery time the rats were housed in groups (4 rats/cage).
Method Details
Induction of hyperthyroidism
Hyperthyroidism was induced by chronic subcutaneous (s.c.) administration of L-thyroxine (T4, 100 μg/day, dissolved in 200 μL of saline; Sigma-Aldrich; St Louis, MO, USA) for a period of three weeks (21 days), as previously described (López et al., 2010, Varela et al., 2012, Martínez-Sánchez et al., 2017). Euthyroid (control) rats were treated with vehicle (saline).
Intracerebroventricular treatments
Intracerebroventricular (ICV) cannulae were stereotaxically implanted under ketamine/xylazine anesthesia or a mix of inhaled isoflurane and oxygen, as previously described using the following coordinates 1.6 mm lateral to bregma, 0.6 mm posterior, 4.5 mm deep (López et al., 2010, Varela et al., 2012, Martínez de Morentin et al., 2014, Contreras et al., 2014). For the chronic experiments, rats and mice received either a single ICV daily administration of triiodothyronine (T3; for rats 4 ng/day, during 5 days, dissolved in 5 μL of saline; for mice 8 ng/day, during 5 days, dissolved in 1 μL of saline; Sigma-Aldrich; St Louis, MO, USA) at 20:00, just before turning the light off (López et al., 2010, Varela et al., 2012, Martínez-Sánchez et al., 2017). For the acute SNA recording, c-FOS analyses in the DMV and 14C-oleate experiments rats received the same single dose of T3 or 1:50 saline:DMSO during 3 hr. The JNK inhibitor SP600125 (Tocris Bioscience; Bristol, UK) was given ICV (0.5 μg/μl/day, dissolved in 15:50 saline:DMSO) (Imbernon et al., 2013) during 7 days using osmotic minipump flow moderator (Model 2001; Alzet Osmotic Pumps, Cupertino, CA, USA). The PKC inhibitor, rottlerin (Calbiochem; Billerica, USA) was given ICV (60 μmol/L, dissolved in saline) (Breen et al., 2011) for 7 days using osmotic minipump flow moderator (Model 2001; Alzet Osmotic Pumps, Cupertino, CA, USA). The C6 ceramide (N-Hexanoyl-D-sphingosine) and the C6-DHC (C6-dihydroceramide) were given ICV (1.25 mg/ml dissolved in saline containing 1/3 of DMSO; Sigma-Aldrich; St Louis, MO, USA) or vehicle (saline containing 1/3 of DMSO; control rats) for 7 days using osmotic minipump flow moderator (Model 2001; Alzet Osmotic Pumps, Cupertino, CA, USA) (Imbernon et al., 2013, Contreras et al., 2014).
14C-oleate infusions
Rats equipped with ICV cannulae were given 7 days to recover before infusions. Rats anesthetized with α-chloralose (2.5% solution, 50 mg/kg; MP Biomedical; Solon, OH, USA) were placed on heating pads before a catheter is inserted into the femoral vein. Anesthesia was infused (25 mg/kg/hr) alongside the 14C-oleate tracer (3000 Bq/min, total dose 0.6 MBq in 0.3 μmol of oleate; 14C labeled 2-Deoxy-Glucose (Deoxy-D-glucose, 2-[14C(U)]; Perkin Elmer, Waltham, MA, USA) (Klieverik et al., 2009). After 30 min baseline, serum measurements were taken and rats dosed with vehicle (DMSO) or T3 (4 ng for 3 hr, dissolved in 5 μL of DMSO; Sigma-Aldrich, St Louis, MO, USA) via ICV cannulae. Blood samples were taken at regular intervals until the experiment was terminated by sacrificing the animals and collecting tissues.
Stereotaxic microinjection of T3 and viral vectors
Animals were placed in a stereotaxic frame (David Kopf Instruments; Tujunga, CA, USA) under ketamine/xylazine anesthesia. The ARC and the VMH were targeted bilaterally using a 25-gauge needle (Hamilton; Reno, NV, USA). The injections were directed to the following stereotaxic coordinates: a) for the VMH of rats: 2.8 mm and 3.2 mm posterior to the bregma, ± 0.6 mm lateral to midline and 10.1 mm deep; b) for the VMH of mice: 1.7 mm posterior to the bregma, ± 0.5 mm lateral to midline and 5.5 mm deep c) for the ARC of rats 2.8 mm posterior, ± 0.3 mm lateral to bregma and 10.2 mm deep. For acute treatments, T3 (Sigma-Aldrich, St Louis, MO, USA; 16 ng in 1 μL of 1:50 saline:DMSO; during 12 hr) or vehicle (100 nL of 1:50 saline:DMSO) were given. For chronic nuclei-specific treatments, T3 was given at 4 ng/day (in saline + 1 mM NaOH) and vehicle (saline + 1 mM NaOH) used as control. The selection of these doses was based on previous reports (López et al., 2010, Varela et al., 2012, Martínez-Sánchez et al., 2017). Nuclei-specific injections were delivered via a permanent 28-gauge stainless steel cannula (Plastics One, Roanoke, VA, USA) inserted bilaterally either in the VMH or ARC. A catheter tube was connected from each infusion cannula to an osmotic minipump flow moderator (Model 1007D; Alzet Osmotic Pumps, Cupertino, CA, USA). These pumps had a flow rate of 0.5 μL/hour during 7 or 28 days of treatment. The osmotic minipumps were inserted in a subcutaneous pocket on the dorsal surface created using blunt dissection and the treatment was given for 7 or 28 days (Imbernon et al., 2013, Contreras et al., 2014).
Adenoviral (GFP, AMPKα-DN, AMPKα-CA, GRP78-DN, TR-DN and SPTLC1-2; Viraquest; North Liberty, IA, USA and SignaGen; Rockville, MD, USA) or adeno-associated (Cre; SignaGen; Rockville, MD, USA) vectors were delivered in the VMH of rats or mice using the aforementioned coordinates at a rate of 200 nl/min for 5 min for rat and 10 min for mouse (1 μl/injection site) as previously reported (López et al., 2010, Varela et al., 2012, Martínez de Morentin et al., 2014, Contreras et al., 2014). Animals were treated for 5-7 days (adenovirus) or 30 days (Cre).
Peripheral treatments
To test whether T3 ICV leaked to the periphery, T3 (Sigma-Aldrich; St Louis, MO, USA) was given intraperitoneally (IP; 4 ng/day, dissolved in 200 μL of 1:50 saline:DMSO) during 4 days (López et al., 2010). The adrenergic receptor beta 3 (β3-AR) specific antagonist SR59230A ([3-(2-ethylphenoxy)-1-[(1,S)-1,2,3,4-tetrahydronapth-1-ylamino]-2S-2-propanol-oxalate]; 3 mg/Kg/day dissolved in saline:DMSO, 1:50 saline:DMSO; Tocris Bioscience; Bristol, UK) (López et al., 2010, Martínez de Morentin et al., 2014) was administrated subcutaneously (s.c.) and animals were treated during 2 days before the T3 injections for rats and 7 days for SF1-Cre AMPKα1flox/flox mice.
Vagotomy
To investigate the impact of the vagus nerve on T3 effects on hepatic metabolism, sham control and VGX rats were infused ICV or VMH with T3 at the doses previously described. The vagotomy surgical procedure was performed as previously described (Imbernon et al., 2013). Briefly, under ketamine–xylazine anesthesia rats were placed on their backs and a midline abdominal incision was made. The liver was then carefully moved to the right exposing the esophagus. Dorsal and ventral branches of the vagus nerve were exposed and dissected from the esophagus. Each branch of the nerve was ligated with surgical suture at two points as distally as possible to prevent bleeding, and then cauterized between the sutures. The abdominal muscles and the skin were then sutured with surgical silk. Sham surgeries were also performed, in which each trunk of the nerve was exposed but not tied or cauterized. The animals were allowed to recover for 15 days before other procedures. The effectiveness of the vagotomy was assessed at the end of the study by post-mortem analysis of the stomach. Only the rats that showed an evident increase in stomach size after vagotomy (due to motoric dysfunction) were included in the analysis (Imbernon et al., 2013).
Positron emission tomography–computed tomography
Chemicals
2-18F-Fluoro-2-Deoxy-2-Glucose (18F-FDG) was produced on a TRACERlab MX synthesizer (GE Healthcare; Little Chalfont, UK), cassettes and reagent kits were from ABX (Advanced Biochemical Compounds, Radeberg, Germany) with the standard method supplied from GE (nucleophilic substitution). The final product had a radiochemical purity more than 95% with a specific activity closely of 1000 Mbq/ml and the osmolality was around 200-300 mOsm/kg.
PET imaging system
Whole-body microPET/CT images were acquired with the Albira PET/CT Preclinical Imaging System (Bruker Biospin; Woodbridge, CT, US). The PET subsystem comprises three rings of eight compact modules based on monolithic crystals coupled to multi-anode photomultiplier tubes (MAPMTs), which form an octagon with an axial FOV of 40 mm/ring and a transaxial FOV of 80 mm in diameter. The PET radial spatial resolution is 1.55 mm (full width at half-maximum) and the absolute sensitivity of the system is 2% for a 350-650 keV energy window and a 5 ns timing window.
Image acquisition
Rats were anesthetized with a gaseous mixture of 2.5% isoflurane in oxygen in an anesthesia chamber before the injection of (7.4 ± 1.85) MBq of 18F-FDG on the tail vein. The anesthesia was interrupted immediately after the injection and the rats were placed back on the cage and remained awake during the uptake period. The acquisition was performed 45 ± 10 min after the 18F-FDG injections. Again, animals were pre-anesthetized with 2.5% isoflurane in oxygen in an anesthesia chamber, approximately during two minutes, and then transported to the scanner bed, where they were kept asleep under a concentration of 2% isoflurane in oxygen. Two bed positions were acquired during 30 min for scanning the whole-body of the animal. Images were generated by using the Bruker Albira Suite Software Version 5.0. Scatter and random coincidences were corrected by using the algorithms provided by the manufacturer. Attenuation correction was not performed. Images were reconstructed by using the maximum likelihood expectation maximization (MLEM) algorithm: 6 iterations were performed with an output pixel size of 0.4 × 0.4 × 0.4 mm3.
Image analysis and statistics
The brown fat area was delineated by using image tools implemented the AMIDE Software (http://amide.sourceforge.net/) to generate a three-dimensional spherical volume of interest with radius of 6 mm and centered on the brown fat area. Thus, mean standardized uptake values (SUV) were calculated. The PET-CT analysis was performed in the Molecular Imaging Unit of the Department of Nuclear Medicine of University of Santiago de Compostela.
Calorimetric system and nuclear magnetic resonance
Animals were analyzed for EE, RQ and LA using a calorimetric system (LabMaster; TSE Systems; Bad Homburg, Germany). Animals were placed in a temperature-controlled (24°C) box through which air was pumped. After calibrating the system with the reference gases (20.9% O2, 0.05% CO2 and 79.05% N2), the metabolic rate was measured for 2-3 days, as previously shown (Imbernon et al., 2013, Martínez de Morentin et al., 2014). EE, RQ (VCO2/VO2) and LA were recorded every 30 min. Animals were placed for adaptation for 1 week before starting the measurements.
For the measurement of body composition, we used nuclear magnetic resonance (NMR) (Whole Body Composition Analyzer; EchoMRI; Houston, TX). EchoMRI is a body composition analyzer for live subjects measuring body fat and lean masses with short scan times to keep the comfort of the animals. Animals do not need to be anesthetized neither other special preparation before measurement. They are placed in a holder of custom-defined size during the measurement (measuring time: 0.5-3.2 min). Two measurements were done for animal, as previously shown (Imbernon et al., 2013, Martínez de Morentin et al., 2014).
BAT Temperature measurements
Skin temperature surrounding BAT was recorded with an infrared camera (B335: Compact-Infrared-Thermal-Imaging-Camera; FLIR; West Malling, Kent, UK) and analyzed with a specific software package (FLIR-Tools-Software, FLIR; West Malling, Kent, UK) as previously shown (Martínez de Morentin et al., 2014, Contreras et al., 2014). For each image, the area surrounding BAT was delimited and the average temperature of the skin area was calculated as the average of 2 pictures/animal.
Sympathetic nerve activity recording
Multi-fiber recording of sympathetic nerve activity (SNA) was obtained from the nerve subserving BAT as previously described (López et al., 2010, Martínez de Morentin et al., 2014, Contreras et al., 2014). Animals were anesthetized using intraperitoneal ketamine (91 mg/kg) and xylazine (9.1 mg/kg) and maintained anesthesia with α-chloralose (initial dose: 25 mg/kg, sustain dose: 50 mg/kg/h) via a catheter inserted in the femoral vein. The trachea was cannulated, and each rat was allowed to breathe spontaneously oxygen-enriched air. Rectal temperature was maintained at 37.5°C using a temperature-controlled surgical table and a lamp. We obtained multi-fiber recording of SNA from the nerve subserving BAT. Using a dissecting microscope, a nerve fiber innervating interscapular BAT was identified, placed on the bipolar platinum-iridium electrode. Each electrode was attached to a high-impedance probe (HIP-511, Grass Instruments, Warwick, RI, USA) and the nerve signal was amplified 105 times with a Grass P5 AC pre-amplifier (Grass Instruments, Warwick, RI, USA). After amplification, the nerve signal was filtered at a 100- and 1000-Hz cutoff with a nerve traffic analysis system (Model 706C, University of Iowa Bioengineering; Iowa City, IA, USA). The nerve signal was then routed to an oscilloscope (Model 54501A, Hewlett-Packard; Palo Alto, CA, USA) for monitoring the quality of the sympathetic nerve recording and to a resetting voltage integrator (Model B600c, University of Iowa Bioengineering, Iowa City, IA, USA). BAT SNA measurements were made every 15 min during 6 hr for the T3 ICV treatment in rats. For the analysis of SNA in SF1-Cre AMPKα1flox/flox mice and their control littermates, basal measurements were performed during 30 min. To ensure that electrical noise was excluded in the assessment of sympathetic outflow, we corrected each SNA recording for post-mortem background activity.
Sample processing
Rats and mice were killed by cervical dislocation. From each animal, either the whole brain (for IHC), the hypothalamus, or the MBH, VMH and ARC (dissected from the whole hypothalamus), as well as the liver and the BAT (for western blot or RT-PCR) were harvested and immediately homogenized on ice to preserve phosphorylated protein levels. Samples were stored at −80°C until further processing. Dissection of the VMH and ARC was performed by micropunches under the microscope (López et al., 2010, Martínez de Morentin et al., 2014, Contreras et al., 2014, Martínez-Sánchez et al., 2017). The specificity of the VMH dissections was confirmed by analyzing the mRNA of steroidogenic factor 1 (SF1) and proopiomelanocortin (POMC) (data not shown).
Quantification of lipids
Tissues (30 mg) were homogenized with 10 volumes of ice-cold phosphate buffered saline (PBS) in a Potter homogenizer (20 strokes). Fatty acids were measured in homogenates using a kit (Wako Chemicals; Richmond, VA; US) and TG were quantified as described (Martínez-Uña et al., 2015). Briefly, lipids were extracted from 1.5 mg of protein from homogenates (Folch et al., 1957) and TG were measured in the lipid extract with a kit (A. Menarini Diagnostics; Ripolli, Italy).
De novo lipogenesis in tissues
De novo lipogenesis was performed as previously described (Nassir et al., 2013) with slight modifications (Aspichueta et al., 2005). Freshly isolated tissue slices (40 mg) were incubated in high glucose Dulbecco’s Modified Eagle Medium (DMEM) with insulin (150 nM) and 20 μM acetate with [3H] acetic acid 20 μCi/ml for 4 hr. Tissue slices were washed five times in cold PBS, homogenated in PBS and lipids were extracted as previously described (Folch et al., 1957). Then, lipids were separated by thin-layer chromatography (TLC) (Ruiz and Ochoa, 1997), the band corresponding to TG was scraped and the radioactivity was measured in a scintillation counter.
Fatty acid oxidation in tissues
Beta oxidation was assessed as described before (Hirschey et al., 2010, Gao et al., 2015). Fresh liver and BAT pieces were homogenated in a Potter homogenizer (5 strokes) in cold buffer (25 mM Tris-HCl, 500 nM sucrose, 1 mM EDTA-Na2 pH 7,4) and sonicated for 10 s. Then, the homogenates were centrifuged at 500 xg for 10 min at 4°C. Approximately 500 μg of protein from the homogenates supernatant was used for the assay in a volume of 200 μl. The reaction started by adding 400 μl of assay mixture containing 200 μM of 0.5 μCi/ml [1-14C] palmitic acid to the samples which were incubated for 1 hr at 37°C in eppendorf tubes with a Whatman paper circle in the cap. The reaction was stopped by adding 300 μl of 3 M perchloric acid and 1 M NaOH was added to impregnate the Whatman cap. After 2 hr the Whatman caps were retired and the radioactivity associated was measured in a scintillation counter. The eppendorf tubes were centrifugated at 21.000 xg 10 min at 4°C. Four hundred μl from the supernatant were collected and the radioactivity was counted in a scintillation counter. The supernatant contained the acid soluble metabolites (ASM) and the Whatman caps captured the released CO2.
Measurements of oxygen consumption rate
The respiration of primary hepatocytes, intact BAT, and liver and BAT mitochondria was measured at 37°C by high-resolution respirometry with the Seahorse Bioscience XF24-3 Extracellular Flux Analyzer. For the measurement of the oxygen consumption rate (OCR), as the rate change of dissolved O2, primary mouse hepatocytes were seeded respectively in a collagen I coated XF24 cell culture microplate (Seahorse Bioscience; Agilent Technologies; Santa Clara, CA, US), at 2.0 × 10⁴ cells/well. After 2 hr of plating, growth medium was removed and replaced with 500 μL of assay medium pre-warmed to 37°C, composed of DMEM without bicarbonate containing 1 mM sodium pyruvate, 2 mM L-glutamine, and cultured at 37°C in room air. Basal measurements of OCR were performed after equilibration in assay medium for 1h. The normalized data were expressed as pmol of O2/minute/μg protein for primary hepatocytes. OCR in BAT was measured short after sacrifice and small pieces of tissue were seeded in Seahorse plates with the above-mentioned assay medium and trapped using islet capture microplates provided by the company. At the end of experiment, OCR values were normalized to protein tissue content. For mitochondrial respiration experiments, liver and BAT mitochondria were isolated by a method similar to Schnaitman and Greenawalt (Schnaitman and Greenawalt, 1968) and basal respiration measurements were made in the presence of succinate and rotenone. The normalized data were expressed as pmol of O2/minute/μg protein for isolated mitochondria.
Electron microscopy and stereological analysis
For electron microscopy experiments, small pieces of BAT samples (1 mm3) were fixed with 1% glutaraldehyde/2% paraformaldehyde in 0.1 M cacodylate buffer for 6-8 hr at 4°C and postfixed with 1% OsO4 in 0.1 M cacodylate buffer (2 hr at 4°C). Samples were then dehydrated and embedded in EMbed 812 resin (Electron Microscopy Sciences, Hatfield, PA, USA) for 48 hr at 65°C. After trimming, resin blocks were sectioned in an Ultracut Reicher Ultramicrotome to obtain ultrathin (40-60 nm) sections, which were contrasted with 2% uranyl acetate for 7 min, and 3% lead citrate for 6 min at 37°C and in the absence of CO2. Samples were visualized in a JEOL JEM-1400 Transmission Electron Microscope (Jeol; Peabody, MA, USA) by a blinded investigator. Between 5 and 10 high resolution images/animal (n = 4) and experimental condition were acquired and processed using ImageJ 1.44 software (NIH; Bethesda, MD, USA). Briefly, mitochondrial and lipid droplet ultrastructure and stereology were assessed from low-magnification micrographs (4,000 X) containing whole brown adipocytes, from which planimetric parameters (lipid droplet and mitochondria number/area unit, area, and circularity coefficient) were calculated. For planimetric measurements more than 2,000 lipid droplets and 10,000 mitochondria/experimental group were scored. Lipid droplet and mitochondria size frequency distributions were calculated using the total number of organelles visualized/experimental condition.
Blood biochemistry
The blood of the animals was collected in specific tubes (BD Vacutainer; Plymouth, UK) and centrifuged during 15 min at 2000 xg to separate the serum. Levels of TSH, T3 and T4 were measured using rat ELISA kits (Crystal Chem; Downers Grove IL, USA) (López et al., 2010, Varela et al., 2012). Serum levels of FGF21 were measured using a rat kit (Biovendor; Karasek, Czech Republic). Ketone bodies were quantified using a commercially available kit from Wako Chemicals GmbH (Richmond, VA, USA). All measurements were done following the manufacturer’s instructions specifically.
Fatty acid analysis
Total lipids were extracted from 15 mg of frozen liver tissue using a modified Folch extraction method. Deuterated tridecanoic acid (C13D25O2H, Cambridge Isotopes; Andover, MA, USA) was used as internal standard. Total lipids were saponified and derivatized into fatty acid methyl esters using boron trifluoride (Morrison and Smith, 1964). Samples were resuspended in hexane and analyzed on a Thermo Finnigan Focus GC coupled to a FID detector. A Thermo Scientific TR-FAME column (length: 30 m, inter diameter: 0.25 mm, film size: 0.25 μm; Thermo Scientific; Surrey, UK) was used with helium as carrier gas at 1.9 ml/min. Inlet temperature was 230°C and detector temperature was 250°C. Temperature program was as follows: 100°C for 2 min, 25°C/min for 2 min, 2.5°C/min for 4.8 min, hold for 3.8 min, 4.5°C/min for 2.4 min, hold for 5 min, 5°C/min for 7.4 min, 40°C/min for 0.5 min and hold for 0.5 min. Chromatograms were analyzed and quantified using Xcalibur 2.0 (Thermo Scientific; Surrey, UK). Identification of FAME peaks was made by comparing retention times against external standards (Restek 35077 Food industry FAME mix; Bellefonte, PA, USA; and Supelco 46904 Vaccenic Methyl ester; Sigma-Aldrich, St Louis, MO, USA). Data were normalized to internal standard and followed by adjustment for tissue weight. Results are expressed as molar percentages normalized to control animals.
TLC separation of lipids for 14C experiments
Extracted total lipids were resuspended in chloroform and spotted onto TLC plates (Plastic Backed Silica Matrix, Merck; Hoddesdon, UK) for separation of TG and FA. Chromatography was performed using toluene:chloroform:methanol (85:15:5) as the migrating solvent. Lipid bands were visualized using a primuline solution and scraped into scintillation vials for 14C quantification once plates had dried.
Calculation of 14C specific activity
Tissue/serum lysates or lipid extracts were resuspended in Beta-Fluor Scintillans (National Diagnostics; Atlanta; USA) and decays/min measured using a scintillation counter (LabLogic 300SL, LabLogic; Broomhill, UK).
Ceramide quantification
Ceramides were extracted and analyzed using liquid chromatography-mass spectrometer consisted of a Waters Acquity UPLC System connected to a Waters LCT Premier Orthogonal Accelerated Time of Flight Mass Spectrometer (Waters; Millford, MA, USA), operated in positive electrospray ionization mode. Full scan spectra from 50 to 1500 Da were acquired and individual spectra were summed to produce data points each 0.2 s. Mass accuracy and reproducibility were maintained by using an independent reference spray by the LockSpray interference. The analytical column was a 100 mmL 2.1 mm i.d., 1.7 mm C8 Acquity UPLC BEH (Waters; Millford, MA, USA). The two mobile phases were phase A: methanol; phase B: water, both contained 0.2% formic acid (v/v) and 2 mM ammonium formate. A linear gradient was programmed (0.0 min: 20% B; 3 min: 10% B; 6 min: 10% B; 15min: 1% B; 18 min: 1% B; 20 min: 20% B; 22 min: 20% B). The flow rate was 0.3 mL/min. The column was held at 30°C. Quantification was carried out using the extracted ion chromatogram of each compound, using 50 mDa windows. The linear dynamic range was determined by injecting standard mixtures. Positive identification of compounds was based on the accurate mass measurement with an error < 5 ppm and its LC retention time, compared to that of a standard (±2%). Concentrations were measured by multiple reaction monitoring experiments using N-lauroyl-D-erythro-sphingosine (C12-ceramide) and N-Heptadecanoyl-D-erytro-Sphingosine (C17-ceramide) as internal standards and using as patrons N-Palmitoyl-D-erytro-sphingosine (C16-ceramide), N-Stearoyl-D-erytro-sphingosine (C18-ceramide), N-lignoceroyl-D-erythro-sphingosine (C24-ceramide) and N-nervonoyl-D-erythro-sphingosine (C24:1-ceramide) (Avanti Polar Lipids; Alabaster, AL, USA). The ceramide analyses were performed in the Research Unit on Bioactive Molecules (RUBAM) of the Institut de Química Avançada de Catalunya (IQAC-CSIC).
Lipidomics
Sample preparation
Hypothalami were dissected weighed and 20 μL of an internal standard mixture and 100 μL of NaCl (0.9%) were added to the sample. Lipids were extracted from the samples with 400 μL of chloroform:methanol (2:1) solvent and the tissue was homogenized. After vortexing for 2 min and incubating for 1 hr at room temperature, the lower layer (approximately 100 μL) was separated by centrifugation at 10,000 rpm for 3 min at room temperature. Ten μL of labeled standard mixture was added to the lipid extract. The internal standard mixture contained the following lipid compounds with heptadecanoic acid (C17:0) as the esterified fatty acid: ceramide (d18:1/17:0) (91.6 μg/mL; Avanti Polar Lipids; Alabaster, AL, USA), GPCholine (17:0/17:0) (9.9 μg/mL; Avanti Polar Lipids; Alabaster, AL, USA), GPEthanolamine (17:0/17:0) (89.5 μg/mL; Avanti Polar Lipids; Alabaster, AL, USA) and TG (17:0/17:0/17:0) (103.6 μg/mL; Larodan Fine Chemicals; Limhamn, Sweden). The labeled standard mixture consisted of GPCholine (16:0/0:0-D3) (92.8 μg/mL; Larodan Fine Chemicals, Limhamn, Sweden), GPCholine (16:0/16:0-D6) (116.8 mg/mL; Larodan Fine Chemicals, Limhamn, Sweden) and TG (16:0/16:0/16:0-13C3) (99.6 μg/mL; Larodan Fine Chemicals, Limhamn, Sweden).
Lipidomic analysis
Lipid extracts were analyzed at VTT Technical Research Centre of Finland (Espoo, Finland) on a Q-ToF Premier mass spectrometer (Waters; Milford, MA, USA) combined with an Acquity Ultra Performance Liquid chromatography (UPLC/MS; Chicago, IL, USA). The column was an Acquity UPLC BEH C18 10x50 mm with 1.7 μm particles and kept at 50°C. The binary solvent system A included water (1% 1M NH4Ac, 0.1% HCOOH) and solvent system B included LC/MS grade acetonitrile/isopropanol (5:2, 1% 1M NH4Ac, 0.1% HCOOH) (Rathburn; Walkerburn, UK). The gradient started from 65% A/ 35% B, reached 100% B in 6 min and remained there for the next 7 min. The total run time including a 5 min re-equilibration step was 18 min. The flow rate was 0.2 mL/min and injection volume 1 μL. The temperature of the sample organizer was set at 10°C. The lipid profiling was carried out using positive ion mode. The data was collected at mass range of m/z 300-2000 with scan duration of 0.2 s. The source temperature was set at 120°C and nitrogen was used as desolvation gas (800 L/h) at 250°C. The voltages of the sampling cone and capillary were 39 V and 3.2 KV, respectively. Reserpine (50 μg/L) was used as the lock spray reference compound (5 μL/min; 10 s scan frequency).
Lipidomic data processing and analysis
The obtained data was converted into netCDF file format using Dbridge Software from MASSLYNX (Waters; Milford, MA, USA). The converted data was processed using MZmine Software version 0.60. Lipids were identified based on their retention time (RT) and mass to charge ratio (MZ) using our in-house built lipid database. All the identified lipids were quantified by normalizing with corresponding internal standards. All monoacyl lipids except cholesterol esters, such as monoacylglycerols and monoacyl-glycerophospholipids were normalized with GPCho (17:0/0:0). All diacyl lipids, except ethanolamine phospholipids, were normalized with GPCho (17:0/17:0). The diacyl ethanolamine phospholipids were normalized with GPEth (17:0/17:0) and the triacylglycerols and cholesterol esters normalized with TG (17:0/17:0/17:0).
Immunohistochemistry
Enzymatic immunohistochemistry was performed as previously described (López et al., 2010, Varela et al., 2012, Martínez de Morentin et al., 2014), using a rabbit anti-c-FOS (Santa Cruz Biotechnology, CA, USA). After perfusion of the animals through the ascending aorta with 150 mL 0.9% NaCl, followed by 500 mL of 4% formaldehyde in 100 mM phosphate buffer (PB), pH 7.4, under deep anesthesia with ketamine-xylazine. The tissues were fixed in 10% buffered formaldehyde and subsequently treated for histological study by dehydration (increasing alcohol concentrations), mounting in xylene and immersion in paraffin. The paraffin blocks were sliced into 3 μm sections that were processed, deparaffinized in xylene, rehydrated and rinsed in distilled water, then stained with the specific primary antibody and incubated overnight, washed and incubated with the secondary antibody (Dako EnVision system, peroxidase; Glostrup, Denmark). c-FOS positive cells were counted by using ImageJ-1.33 (NIH; Bethesda, MD, USA). Seven-11 bilateral image sections per animals were analyzed. Direct detection of GFP fluorescence was performed after perfusion of the animals; on 40 μm sections. Images were taken with a fluorescence microscope Olympus IX51 (Olympus Corporation; Tokyo, Japan).
Hepatic lipid content was analyzed by Red Oil O staining as previously shown (Imbernon et al., 2013, Contreras et al., 2014, Martínez-Sánchez et al., 2017). Hepatic frozen sections were cut (8 μm) and fixed in 10% buffered formaldehyde. Sections were stained in filtered Oil Red O (Sigma-Aldrich; St. Louis, MO, USA), washed in distilled water, counterstained with Harris hematoxylin (Bio-Optica; Milan, Italy) and washed in distilled water again. Sections were mounted in aqueous mounting medium (Bio-Optica; Milan, Italy). Images were taken with a digital camera Olympus XC50 (Olympus Corporation; Tokyo, Japan) at 20x (for rats) and 40x (for mice). Digital images for liver were quantified with ImageJ-1.33 (NIH; Bethesda, MD, USA).
In situ hybridization
Coronal brain sections (16 μm) were cut on a cryostat and immediately stored at −80°C until hybridization. In situ hybridization was performed as previously described (López et al., 2010, Martínez de Morentin et al., 2014). Sections were probed with a specific oligonucleotide for TRH (Trh; GenBank: NM_013046; 5′- ATA CCA GTT AGG GTG AAG ATC AAA GCC AGA GCC AGC AGC AAC CAA–3’) or AMPKα1 (Prkaa1; GenBank: NM_001013367; 5′- GCT CTC CTC CAG AGA CAT ATT CCA TCA CCA TGA-3′). These probes were 3′ end labeled with 35S-αdATP (Perkin Elmer, Waltham, MA, USA) using terminal deoxynucleotidil transferase (New England Biolabs; Ipswich, MA). The specificity of the probes was confirmed by incubating the sections with an excess of the unlabeled probes. The frozen sections were fixed with 4% paraformaldehyde in 0.1M phosphate buffer (pH 7.4) at room temperature for 30 min. They were then dehydrated using 70, 80, 90, 95%, and absolute ethanol (5 min each). The hybridization was carried out overnight at 37°C in a moist chamber. Hybridization solution contained 0.5x10⁶ cpm (for both TRH and AMPKα1) per slide of the labeled probe, 4X saline-sodium citrate buffer (SSC), 50% deionized formamide, 1X Denhardt's solution, 10% dextran sulfate and 10 μg/ml sheared, single-stranded salmon sperm DNA (all of them, Sigma-Aldrich; St. Louis, MO, USA). Afterward, the hybridization sections were sequentially washed in 1X SSC at room temperature, four times in 1X SSC at 42°C (30 min per wash), one time in 1X SSC at room temperature (1 h), and then rinsed in water and ethanol. Finally, the sections were air-dried and exposed to Hyperfilm β-Max (KODAK; Rochester, NY, USA) at room temperature for 7 days for TRH and 14 days for AMPKα1. The slides from all experimental groups were exposed to the same autoradiographic film and then they were developed in developer/replenisher (Developer G150, AGFA HealthCare: Mortsel, Belgium) and fixator (Manual Fixing G354; AGFA HealthCare: Mortsel, Belgium). Sections were scanned and the hybridization signal was quantified by densitometry using ImageJ-1.33 software (NIH; Bethesda, MD, USA). The optical density of the hybridization signal was determined and subsequently corrected by the optical density of its adjacent background value. A rectangle, with the same dimensions in each case, was drawn enclosing the hybridization signal over each nucleus and over adjacent brain areas of each section (background) (López et al., 2010, Martínez de Morentin et al., 2014). Sixteen-20 sections for each animal (4-5 slides with 4 sections/slide) were used. The mean of these 16-20 values was used as densitometry value for each animal.
Real-time quantitative RT-PCR
Real-time PCR (TaqMan; Applied Biosystems; Foster City, CA, USA) was performed using specific primers and probes (Table S1) as previously described (López et al., 2010, Martínez de Morentin et al., 2014, Martínez-Sánchez et al., 2017). Total RNA was isolated by using Trizol Reagent (Invitrogen; Carlsbad, CA, USA) according to the manufacturer’s protocol (RNA was precipitated with chloroform and isopropanol, washed with 75% ethanol, and finally dissolved in RNase-free water). cDNA synthesis was performed with M-MLV enzyme (Invitrogen; Carlsbad, CA, USA) following the supplier’s protocol. All reactions were carried out using the following cycling parameters: 50°C for 2 min, 95°C for 10 min followed by 40 cycles of 95°C for 15 s, 60°C for 1 min. Values were expressed in relation to hypoxanthine-guanine phosphoribosyl-transferase (Hprt) levels.
Western blotting
Protein lysates from hypothalamus (total, MBH or VMH), liver, muscle, WAT and BAT were homogenized in lysis buffer (consisting of a mix of 0.05 M Tris-HCl, 0.01 M EGTA, 0.001 M EDTA, 0.016 M Triton X-100, 0.001 M sodium orthovanadate, 0.05 M sodium fluoride, 0.01 M sodium pyrophosphate and 0.25 M sucrose, made up with distilled water and adjusted to 7.5 pH; all of them from Sigma-Aldrich; St. Louis, MO, USA) and freshly added protease inhibitor cocktail tablets (Roche Diagnostics; Indianapolis, IN, USA). The protein concentration was determined by the Bradford Method (Protein assay dye concentrate, Bio-Rad Laboratories; Hercules, CA, USA), and the total protein content of the tissues was calculated. The protein lysates were subjected to SDS-PAGE, electrotransferred to polyvinylidene difluoride membranes (PVDF; Millipore; Billerica, MA, USA) with a semidry blotter and probed with antibodies against ACC, AMPKα1, AMPKα2 (Millipore; Billerica, MA, USA), GRP78, IREα, pACCα (Ser79), pAMPKα (Thr172), p-c-Jun (Ser63), pHSL (Ser660), PERK, pJNK (Thr183/Tyr185), pSTAT3 (Ser727) (Cell Signaling; Danvers; MA, USA); FAS (BD; Franklin Lakes, NJ, USA); ATF6α, CHOP, JNK1/3, NFκB p65, peIF2α (Ser52), p-IKKα/β, pPERK (Thr981), PKCδ (Santa Cruz; Santa Cruz, CA,USC); HSL, pIREα (Ser724), PKCε, SPTLC1, SPTLC2, UCP1, UCP3 (Abcam; Cambridge, UK); α-tubulin or β-actin (Sigma-Aldrich; St. Louis, MO, USA) as described (López et al., 2010, Varela et al., 2012, Martínez de Morentin et al., 2014, Contreras et al., 2014, Martínez-Sánchez et al., 2017). Each membrane was then incubated with the corresponding secondary antibody: anti-mouse, anti-rabbit or anti-goat (all of them from DAKO; Glostrup, Denmark). The membranes were exposed to an X-ray film (Fujifilm; Tokyo, Japan) and developed using developer (Developer G150; AGFA HealthCare: Mortsel, Belgium) and Fixator (Manual Fixing G354; AGFA HealthCare: Mortsel, Belgium).
Autoradiographic films were scanned and the bands signal was quantified by densitometry using ImageJ-1.33 software (NIH; Bethesda, MD, USA). Values were expressed in relation to β-actin (hypothalamus, liver and WAT) or α-tubulin (muscle and BAT). In Figure 1A data are expressed as a percentage of vehicle ICV for each tissue. Representative images for all proteins are shown; in the case of the loading controls a representative gel is displayed, although each protein was corrected by its own internal control (β-actin or α-tubulin), as explained above. In all the Figures showing images of gels, all the bands for each picture come always from the same gel, although they may be spliced for clarity. In the ACC westerns, the bands represent ACCα for liver, WAT and BAT and ACCβ for the muscle. In the pACC westerns, the upper band corresponds to pACCβ and the lower band to pACCα.
Quantification and Statistical Analysis
ImageJ-1.33 software (NIH; Bethesda, MD, USA) was used to count c-FOS positive cells and to process electron microscopy, western blot analyses and in situ hybridization and liver histologic images (López et al., 2010, Varela et al., 2012, Martínez de Morentin et al., 2014, Contreras et al., 2014, Martínez-Sánchez et al., 2017). Statistical analysis was conducted using GraphPad Prism 6 Software (GraphPad Software; La Jolla, CA, USA). Data are expressed as mean ± SEM as percentage of stained area in the image of the appropriate controls (euthyroid, vehicle-treated, GFP, sham-vehicle rats or WT mice). Error bars represent SEM. Statistical significance was determined by t-Student (when two groups were compared) or ANOVA (when more than two groups were compared) followed of post hoc two-tailed Bonferroni test. p < 0.05 was considered significant. The number of animals used in each experimental setting and analysis are specified in each Figure Legend.
Author Contributions
N.M.-S., P.S.-C., C.C., L.V., J.V., E.R.-P., I.G.-G., P.B.M.M., T.L.-G., and L.L.-P. performed the in vivo experiments and analytical methods (NMR, blood biochemistry, immunohistochemistry, RT-PCR in situ hybridization, and western blotting), and collected and analyzed the data. P.S.-C. generated and fully phenotyped the SF1-Cre AMPKα1flox/flox mouse model; J.R. conducted part of the genotyping and characterization of this mouse model. X.B., I.A., B.G.-S., and P.A. performed the lipogenesis, lipolysis, and lipid oxidation studies. A.J.W., Y.C.L.T., P.J.V., A.P.C., and A.V.-P. performed the radiolabeled lipid infusions. T.C.D. and M.L.M.-C. performed the Seahorse studies. R.V.-M. and M.M.M. performed the electron microscope studies. V.V. and M.O. performed the lipidomics. D.A.M. and K.R. performed and analyzed the sympathetic nerve activity recording studies. K.C. generated TR-DN constructs and validated the TR-DN encoding adenoviruses. N.C. performed the ceramide quantification. R.J.D. and G.S. provided the null Jnk1 mice and the null Jnk2 and Jnk1flox/flox mice. N.M.-S., P.S.-C., J.M., M.T.-S., M.M.M., C.D., M.L.M.-C., P.A., K.R., R.N., G.S., F.V., and M.L. analyzed, interpreted, and discussed the data. N.M.-S., P.S.-C., C.C., I.G.-G., A.J.W., F.G., G.M.-G., T.S., R.J.D., J.M., M.T.-S., M.M.M., C.D., M.L.M.-C., P.A., K.R., R.N., G.S., F.V., and M.L. reviewed and edited the manuscript. N.M.-S., P.S.-C., C.C., I.G.-G., and M.L. made the figures. N.M.-S., P.S.-C., and M.L. conceived and designed the experiments. M.L. developed the hypothesis, secured funding, coordinated and led the project, and wrote the manuscript.
Acknowledgments
We dedicate this work to the bright memory of our colleague and friend Rafael Vázquez-Martínez. The research leading to these results has received funding from the European Community’s Seventh Framework Programme (FP7/2007-2013) under grant agreements n° 260464 – the OBECAN project (G.S.) and n° 281854 – the ObERStress project (M.L.), Xunta de Galicia (F.G., ED431C-2016-025 and ED341D-R2016-032; R.N., 2015-CP080 and 2016-PG057; M.L., 2015-CP079 and 2016-PG068), Junta de Andalucía (M.T.-S., P12-FQM-01943), Gobierno Vasco-Departamento de Salud (M.L.M.-C., 2013111114), EITB (M.L.M.-C., BIO15/CA/014), Ayudas para apoyar grupos de investigación del sistema Universitario Vasco (P.A., IT971-16), Generalitat de Catalunya (N.C., 2014SGR465), Fundació La Marató de TV3 (N.C., 87/C/2016), Instituto de Salud Carlos III co-funded by FEDER (F.G., RD16/0008/0003; M.L.M.-C., PIE14/00031), Ministerio de Economía y Competitividad (MINECO) co-funded by the FEDER Program of EU (N.C., SAF2014-52223-C2-2-R; M.T.-S., BFU2014-57581-P -P; M.M.M., BFU2013-44229-R; C.D., BFU2014-55871-P; M.L.M.-C., SAF2014-54658-R; P.A., SAF2015-64352-R; R.N., BFU2015-70664R; G.S., SAF2013-43506-R; F.V., SAF2014 55725; M.L., SAF2015-71026-R; G.M., M.M.M., F.V., and M.L., BFU2015-70454-REDT/Adipoplast), Asociación Española contra el Cáncer (T.C.D. and M.L.M.-C.), Medical Research Council (MRC) Metabolic Diseases Unit (A.J.W., Y.C.L.T., A.P.C., and A.V.-P., MRC_MC_UU_12012/1 and MRC_UU_12015/5), MRC Programme Grant (Y.C.L.T. and A.P.C., G9824984), MRC Disease Model Core (P.J.V. and A.V.-P.), Wellcome Trust Investigator Award (K.C., 095564/Z/11/Z), Deutsche Forschungsgemeinschaft (J.M., Mi1242/2-1), NIH (R.J.D., DK107220 and DK112698; K.R., HL084207), American Heart Association (K.R., EIA#14EIA18860041) and the University of Iowa Fraternal Order of Eagles Diabetes Research Center (K.R.), EFSD/Lilly Programme (G.S., GIM/EFS1601), Astra Zeneca Foundation (R.N.) and the European Foundation for the Study of Diabetes (R.N.), and Atresmedia Corporación (M.L.). C.C. is recipient of a Sara Borrell Contract (CD14/0007) from ISCIII; J.V. is recipient of a Juan de la Cierva Contract (IJDC-2014-19681) from MINECO; E.R.-P. is recipient of a fellowship from MINECO (BES-2015-072743); I.G.-G. is recipient of a fellowship from MINECO (FPU12/01827); L.L.-P. is recipient of a fellowship from Xunta de Galicia (ED481A-2016/094); T.C.D. is supported by AECC (AIO2013); T.S. is recipient of a Miguel Servet Contract (CP12/03121) from ISCIII; R.J.D. is an Investigator of the Howard Hughes Medical Institute; and F.V. is an ICREA Academia researcher, Generalitat de Catalunya. The CiMUS is supported by the Xunta de Galicia (2016–2019, ED431G/05) and the CNIC is supported by the MINECO and the Pro-CNIC Foundation. Pro-CNIC Foundation is a Severo Ochoa Center of Excellence (MINECO award SEV-2015-0505). The technical assistance of Luz Casas in performing the in situ hybridization, Maria Jesus Sanchez-Tapia in performing genotyping analyses, and Tuulikki Seppänen-Laakso and Ulla Lahtinen in performing lipidomics analyses is cordially appreciated. CIBER de Fisiopatología de la Obesidad y Nutrición and CIBER de Enfermedades hepáticas y Digestivas are initiatives of ISCIII. The funders had no role in study design, data collection and analysis, decision to publish, or preparation of the manuscript.
Published: July 5, 2017
Footnotes
Supplemental Information includes seven figures and one table and can be found with this article online at http://dx.doi.org/10.1016/j.cmet.2017.06.014.
Supplemental Information
References
- Aspichueta P., Pérez S., Ochoa B., Fresnedo O. Endotoxin promotes preferential periportal upregulation of VLDL secretion in the rat liver. J. Lipid Res. 2005;46:1017–1026. doi: 10.1194/jlr.M500003-JLR200. [DOI] [PubMed] [Google Scholar]
- Bartelt A., Bruns O.T., Reimer R., Hohenberg H., Ittrich H., Peldschus K., Kaul M.G., Tromsdorf U.I., Weller H., Waurisch C. Brown adipose tissue activity controls triglyceride clearance. Nat. Med. 2011;17:200–205. doi: 10.1038/nm.2297. [DOI] [PubMed] [Google Scholar]
- Benoit S.C., Kemp C.J., Elias C.F., Abplanalp W., Herman J.P., Migrenne S., Lefevre A.L., Cruciani-Guglielmacci C., Magnan C., Yu F. Palmitic acid mediates hypothalamic insulin resistance by altering PKC-theta subcellular localization in rodents. J. Clin. Invest. 2009;119:2577–2589. doi: 10.1172/JCI36714. [DOI] [PMC free article] [PubMed] [Google Scholar]
- Beylot M., Martin C., Laville M., Riou J.P., Cohen R., Mornex R. Lipolytic and ketogenic fluxes in human hyperthyroidism. J. Clin. Endocrinol. Metab. 1991;73:42–49. doi: 10.1210/jcem-73-1-42. [DOI] [PubMed] [Google Scholar]
- Breen D.M., Yue J.T., Rasmussen B.A., Kokorovic A., Cheung G.W., Lam T.K. Duodenal PKC-δ and cholecystokinin signaling axis regulates glucose production. Diabetes. 2011;60:3148–3153. doi: 10.2337/db11-0852. [DOI] [PMC free article] [PubMed] [Google Scholar]
- Cachefo A., Boucher P., Vidon C., Dusserre E., Diraison F., Beylot M. Hepatic lipogenesis and cholesterol synthesis in hyperthyroid patients. J. Clin. Endocrinol. Metab. 2001;86:5353–5357. doi: 10.1210/jcem.86.11.7981. [DOI] [PubMed] [Google Scholar]
- Cannon B., Nedergaard J. Thyroid hormones: igniting brown fat via the brain. Nat. Med. 2010;16:965–967. doi: 10.1038/nm0910-965. [DOI] [PubMed] [Google Scholar]
- Cheung C.C., Krause W.C., Edwards R.H., Yang C.F., Shah N.M., Hnasko T.S., Ingraham H.A. Sex-dependent changes in metabolism and behavior, as well as reduced anxiety after eliminating ventromedial hypothalamus excitatory output. Mol. Metab. 2015;4:857–866. doi: 10.1016/j.molmet.2015.09.001. [DOI] [PMC free article] [PubMed] [Google Scholar]
- Chiappini F., Catalano K.J., Lee J., Peroni O.D., Lynch J., Dhaneshwar A.S., Wellenstein K., Sontheimer A., Neel B.G., Kahn B.B. Ventromedial hypothalamus-specific Ptpn1 deletion exacerbates diet-induced obesity in female mice. J. Clin. Invest. 2014;124:3781–3792. doi: 10.1172/JCI68585. [DOI] [PMC free article] [PubMed] [Google Scholar]
- Contreras C., González-García I., Martínez-Sánchez N., Seoane-Collazo P., Jacas J., Morgan D.A., Serra D., Gallego R., González F., Casals N. Central ceramide-induced hypothalamic lipotoxicity and ER stress regulate energy balance. Cell Rep. 2014;9:366–377. doi: 10.1016/j.celrep.2014.08.057. [DOI] [PMC free article] [PubMed] [Google Scholar]
- Coppola A., Liu Z.W., Andrews Z.B., Paradis E., Roy M.C., Friedman J.M., Ricquier D., Richard D., Horvath T.L., Gao X.B., Diano S. A central thermogenic-like mechanism in feeding regulation: an interplay between arcuate nucleus T3 and UCP2. Cell Metab. 2007;5:21–33. doi: 10.1016/j.cmet.2006.12.002. [DOI] [PMC free article] [PubMed] [Google Scholar]
- Dhillon H., Zigman J.M., Ye C., Lee C.E., McGovern R.A., Tang V., Kenny C.D., Christiansen L.M., White R.D., Edelstein E.A. Leptin directly activates SF1 neurons in the VMH, and this action by leptin is required for normal body-weight homeostasis. Neuron. 2006;49:191–203. doi: 10.1016/j.neuron.2005.12.021. [DOI] [PubMed] [Google Scholar]
- Dietrich M.O., Liu Z.W., Horvath T.L. Mitochondrial dynamics controlled by mitofusins regulate Agrp neuronal activity and diet-induced obesity. Cell. 2013;155:188–199. doi: 10.1016/j.cell.2013.09.004. [DOI] [PMC free article] [PubMed] [Google Scholar]
- Erion M.D., Cable E.E., Ito B.R., Jiang H., Fujitaki J.M., Finn P.D., Zhang B.H., Hou J., Boyer S.H., van Poelje P.D., Linemeyer D.L. Targeting thyroid hormone receptor-beta agonists to the liver reduces cholesterol and triglycerides and improves the therapeutic index. Proc. Natl. Acad. Sci. USA. 2007;104:15490–15495. doi: 10.1073/pnas.0702759104. [DOI] [PMC free article] [PubMed] [Google Scholar]
- Finan B., Clemmensen C., Zhu Z., Stemmer K., Gauthier K., Müller L., De Angelis M., Moreth K., Neff F., Perez-Tilve D. Chemical hybridization of glucagon and thyroid hormone optimizes therapeutic impact for metabolic disease. Cell. 2016;167:843–857.e14. doi: 10.1016/j.cell.2016.09.014. [DOI] [PubMed] [Google Scholar]
- Fliers E., Klieverik L.P., Kalsbeek A. Novel neural pathways for metabolic effects of thyroid hormone. Trends Endocrinol. Metab. 2010;21:230–236. doi: 10.1016/j.tem.2009.11.008. [DOI] [PubMed] [Google Scholar]
- Folch J., Lees M., Sloane Stanley G.H. A simple method for the isolation and purification of total lipides from animal tissues. J. Biol. Chem. 1957;226:497–509. [PubMed] [Google Scholar]
- Gao X., van der Veen J.N., Hermansson M., Ordoñez M., Gomez-Muñoz A., Vance D.E., Jacobs R.L. Decreased lipogenesis in white adipose tissue contributes to the resistance to high fat diet-induced obesity in phosphatidylethanolamine N-methyltransferase-deficient mice. Biochim. Biophys. Acta. 2015;1851:152–162. doi: 10.1016/j.bbalip.2014.11.006. [DOI] [PubMed] [Google Scholar]
- Higo T., Hamada K., Hisatsune C., Nukina N., Hashikawa T., Hattori M., Nakamura T., Mikoshiba K. Mechanism of ER stress-induced brain damage by IP(3) receptor. Neuron. 2010;68:865–878. doi: 10.1016/j.neuron.2010.11.010. [DOI] [PubMed] [Google Scholar]
- Hirschey M.D., Shimazu T., Goetzman E., Jing E., Schwer B., Lombard D.B., Grueter C.A., Harris C., Biddinger S., Ilkayeva O.R. SIRT3 regulates mitochondrial fatty-acid oxidation by reversible enzyme deacetylation. Nature. 2010;464:121–125. doi: 10.1038/nature08778. [DOI] [PMC free article] [PubMed] [Google Scholar]
- Imbernon M., Beiroa D., Vázquez M.J., Morgan D.A., Veyrat-Durebex C., Porteiro B., Díaz-Arteaga A., Senra A., Busquets S., Velásquez D.A. Central melanin-concentrating hormone influences liver and adipose metabolism via specific hypothalamic nuclei and efferent autonomic/JNK1 pathways. Gastroenterology. 2013;144:636–649.e6. doi: 10.1053/j.gastro.2012.10.051. [DOI] [PMC free article] [PubMed] [Google Scholar]
- Izquierdo J.M., Cuezva J.M. Thyroid hormones promote transcriptional activation of the nuclear gene coding for mitochondrial beta-F1-ATPase in rat liver. FEBS Lett. 1993;323:109–112. doi: 10.1016/0014-5793(93)81459-d. [DOI] [PubMed] [Google Scholar]
- Kahn B.B., Alquier T., Carling D., Hardie D.G. AMP-activated protein kinase: ancient energy gauge provides clues to modern understanding of metabolism. Cell Metab. 2005;1:15–25. doi: 10.1016/j.cmet.2004.12.003. [DOI] [PubMed] [Google Scholar]
- Kalyanaraman H., Schwappacher R., Joshua J., Zhuang S., Scott B.T., Klos M., Casteel D.E., Frangos J.A., Dillmann W., Boss G.R., Pilz R.B. Nongenomic thyroid hormone signaling occurs through a plasma membrane-localized receptor. Sci. Signal. 2014;7:ra48. doi: 10.1126/scisignal.2004911. [DOI] [PMC free article] [PubMed] [Google Scholar]
- Klieverik L.P., Coomans C.P., Endert E., Sauerwein H.P., Havekes L.M., Voshol P.J., Rensen P.C., Romijn J.A., Kalsbeek A., Fliers E. Thyroid hormone effects on whole-body energy homeostasis and tissue-specific fatty acid uptake in vivo. Endocrinology. 2009;150:5639–5648. doi: 10.1210/en.2009-0297. [DOI] [PubMed] [Google Scholar]
- Klöckener T., Hess S., Belgardt B.F., Paeger L., Verhagen L.A., Husch A., Sohn J.W., Hampel B., Dhillon H., Zigman J.M. High-fat feeding promotes obesity via insulin receptor/PI3K-dependent inhibition of SF-1 VMH neurons. Nat. Neurosci. 2011;14:911–918. doi: 10.1038/nn.2847. [DOI] [PMC free article] [PubMed] [Google Scholar]
- Lindberg D., Chen P., Li C. Conditional viral tracing reveals that steroidogenic factor 1-positive neurons of the dorsomedial subdivision of the ventromedial hypothalamus project to autonomic centers of the hypothalamus and hindbrain. J. Comp. Neurol. 2013;521:3167–3190. doi: 10.1002/cne.23338. [DOI] [PubMed] [Google Scholar]
- López M., Varela L., Vázquez M.J., Rodríguez-Cuenca S., González C.R., Velagapudi V.R., Morgan D.A., Schoenmakers E., Agassandian K., Lage R. Hypothalamic AMPK and fatty acid metabolism mediate thyroid regulation of energy balance. Nat. Med. 2010;16:1001–1008. doi: 10.1038/nm.2207. [DOI] [PMC free article] [PubMed] [Google Scholar]
- López M., Alvarez C.V., Nogueiras R., Diéguez C. Energy balance regulation by thyroid hormones at central level. Trends Mol. Med. 2013;19:418–427. doi: 10.1016/j.molmed.2013.04.004. [DOI] [PubMed] [Google Scholar]
- López M., Nogueiras R., Tena-Sempere M., Diéguez C. Hypothalamic AMPK: a canonical regulator of whole-body energy balance. Nat. Rev. Endocrinol. 2016;12:421–432. doi: 10.1038/nrendo.2016.67. [DOI] [PubMed] [Google Scholar]
- Martínez de Morentin P.B., González-García I., Martins L., Lage R., Fernández-Mallo D., Martínez-Sánchez N., Ruíz-Pino F., Liu J., Morgan D.A., Pinilla L. Estradiol regulates brown adipose tissue thermogenesis via hypothalamic AMPK. Cell Metab. 2014;20:41–53. doi: 10.1016/j.cmet.2014.03.031. [DOI] [PMC free article] [PubMed] [Google Scholar]
- Martínez-Sánchez N., Moreno-Navarrete J.M., Contreras C., Rial-Pensado E., Fernø J., Nogueiras R., Diéguez C., Fernández-Real J.M., López M. Thyroid hormones induce browning of white fat. J. Endocrinol. 2017;232:351–362. doi: 10.1530/JOE-16-0425. [DOI] [PMC free article] [PubMed] [Google Scholar]
- Martínez-Uña M., Varela-Rey M., Mestre D., Fernández-Ares L., Fresnedo O., Fernandez-Ramos D., Gutiérrez-de Juan V., Martin-Guerrero I., García-Orad A., Luka Z. S-adenosylmethionine increases circulating very-low density lipoprotein clearance in non-alcoholic fatty liver disease. J. Hepatol. 2015;62:673–681. doi: 10.1016/j.jhep.2014.10.019. [DOI] [PMC free article] [PubMed] [Google Scholar]
- Mohammad H., Marchisella F., Ortega-Martinez S., Hollos P., Eerola K., Komulainen E., Kulesskaya N., Freemantle E., Fagerholm V., Savontous E. JNK1 controls adult hippocampal neurogenesis and imposes cell-autonomous control of anxiety behaviour from the neurogenic niche. Mol. Psychiatry. 2017 doi: 10.1038/mp.2017.21. Published online February 14, 2017. [DOI] [PMC free article] [PubMed] [Google Scholar]
- Morrison W.R., Smith L.M. Preparation of fatty acid methyl esters and dimethylacetals from lipids with boron fluoride–methanol. J. Lipid Res. 1964;5:600–608. [PubMed] [Google Scholar]
- Morrison S.F., Madden C.J., Tupone D. Central neural regulation of brown adipose tissue thermogenesis and energy expenditure. Cell Metab. 2014;19:741–756. doi: 10.1016/j.cmet.2014.02.007. [DOI] [PMC free article] [PubMed] [Google Scholar]
- Mullur R., Liu Y.Y., Brent G.A. Thyroid hormone regulation of metabolism. Physiol. Rev. 2014;94:355–382. doi: 10.1152/physrev.00030.2013. [DOI] [PMC free article] [PubMed] [Google Scholar]
- Nakada D., Saunders T.L., Morrison S.J. Lkb1 regulates cell cycle and energy metabolism in haematopoietic stem cells. Nature. 2010;468:653–658. doi: 10.1038/nature09571. [DOI] [PMC free article] [PubMed] [Google Scholar]
- Narayanan R., Dougherty K.J., Johnston D. Calcium store depletion induces persistent perisomatic increases in the functional density of h channels in hippocampal pyramidal neurons. Neuron. 2010;68:921–935. doi: 10.1016/j.neuron.2010.11.033. [DOI] [PMC free article] [PubMed] [Google Scholar]
- Nassir F., Adewole O.L., Brunt E.M., Abumrad N.A. CD36 deletion reduces VLDL secretion, modulates liver prostaglandins, and exacerbates hepatic steatosis in ob/ob mice. J. Lipid Res. 2013;54:2988–2997. doi: 10.1194/jlr.M037812. [DOI] [PMC free article] [PubMed] [Google Scholar]
- Ouellet V., Labbé S.M., Blondin D.P., Phoenix S., Guérin B., Haman F., Turcotte E.E., Richard D., Carpentier A.C. Brown adipose tissue oxidative metabolism contributes to energy expenditure during acute cold exposure in humans. J. Clin. Invest. 2012;122:545–552. doi: 10.1172/JCI60433. [DOI] [PMC free article] [PubMed] [Google Scholar]
- Ruiz J.I., Ochoa B. Quantification in the subnanomolar range of phospholipids and neutral lipids by monodimensional thin-layer chromatography and image analysis. J. Lipid Res. 1997;38:1482–1489. [PubMed] [Google Scholar]
- Sabio G., Cavanagh-Kyros J., Barrett T., Jung D.Y., Ko H.J., Ong H., Morel C., Mora A., Reilly J., Kim J.K., Davis R.J. Role of the hypothalamic-pituitary-thyroid axis in metabolic regulation by JNK1. Genes Dev. 2010;24:256–264. doi: 10.1101/gad.1878510. [DOI] [PMC free article] [PubMed] [Google Scholar]
- Sayre N.L., Lechleiter J.D. Fatty acid metabolism and thyroid hormones. Curr. Trends Endocrinol. 2012;6:65–76. [PMC free article] [PubMed] [Google Scholar]
- Schnaitman C., Greenawalt J.W. Enzymatic properties of the inner and outer membranes of rat liver mitochondria. J. Cell Biol. 1968;38:158–175. doi: 10.1083/jcb.38.1.158. [DOI] [PMC free article] [PubMed] [Google Scholar]
- Schneeberger M., Dietrich M.O., Sebastián D., Imbernón M., Castaño C., Garcia A., Esteban Y., Gonzalez-Franquesa A., Rodríguez I.C., Bortolozzi A. Mitofusin 2 in POMC neurons connects ER stress with leptin resistance and energy imbalance. Cell. 2013;155:172–187. doi: 10.1016/j.cell.2013.09.003. [DOI] [PMC free article] [PubMed] [Google Scholar]
- Segal J.P., Stallings N.R., Lee C.E., Zhao L., Socci N., Viale A., Harris T.M., Soares M.B., Childs G., Elmquist J.K. Use of laser-capture microdissection for the identification of marker genes for the ventromedial hypothalamic nucleus. J. Neurosci. 2005;25:4181–4188. doi: 10.1523/JNEUROSCI.0158-05.2005. [DOI] [PMC free article] [PubMed] [Google Scholar]
- Sherrin T., Blank T., Hippel C., Rayner M., Davis R.J., Todorovic C. Hippocampal c-Jun-N-terminal kinases serve as negative regulators of associative learning. J. Neurosci. 2010;30:13348–13361. doi: 10.1523/JNEUROSCI.3492-10.2010. [DOI] [PMC free article] [PubMed] [Google Scholar]
- Silva J.E. Thermogenic mechanisms and their hormonal regulation. Physiol. Rev. 2006;86:435–464. doi: 10.1152/physrev.00009.2005. [DOI] [PubMed] [Google Scholar]
- Sinha R.A., You S.H., Zhou J., Siddique M.M., Bay B.H., Zhu X., Privalsky M.L., Cheng S.Y., Stevens R.D., Summers S.A. Thyroid hormone stimulates hepatic lipid catabolism via activation of autophagy. J. Clin. Invest. 2012;122:2428–2438. doi: 10.1172/JCI60580. [DOI] [PMC free article] [PubMed] [Google Scholar]
- Thomsom J.F., Habeck D.A., Nance S.L., Beetham K.L. Ultrastructural and biochemical changes in brown fat in cold-exposed rats. J. Cell Biol. 1969;41:312–334. doi: 10.1083/jcb.41.1.312. [DOI] [PMC free article] [PubMed] [Google Scholar]
- Tong Q., Ye C., McCrimmon R.J., Dhillon H., Choi B., Kramer M.D., Yu J., Yang Z., Christiansen L.M., Lee C.E. Synaptic glutamate release by ventromedial hypothalamic neurons is part of the neurocircuitry that prevents hypoglycemia. Cell Metab. 2007;5:383–393. doi: 10.1016/j.cmet.2007.04.001. [DOI] [PMC free article] [PubMed] [Google Scholar]
- Tsaousidou E., Paeger L., Belgardt B.F., Pal M., Wunderlich C.M., Brönneke H., Collienne U., Hampel B., Wunderlich F.T., Schmidt-Supprian M. Distinct roles for JNK and IKK activation in agouti-related peptide neurons in the development of obesity and insulin resistance. Cell Rep. 2014;9:1495–1506. doi: 10.1016/j.celrep.2014.10.045. [DOI] [PubMed] [Google Scholar]
- Varela L., Martínez-Sánchez N., Gallego R., Vázquez M.J., Roa J., Gándara M., Schoenmakers E., Nogueiras R., Chatterjee K., Tena-Sempere M. Hypothalamic mTOR pathway mediates thyroid hormone-induced hyperphagia in hyperthyroidism. J. Pathol. 2012;227:209–222. doi: 10.1002/path.3984. [DOI] [PubMed] [Google Scholar]
- Vella K.R., Ramadoss P., Lam F.S., Harris J.C., Ye F.D., Same P.D., O’Neill N.F., Maratos-Flier E., Hollenberg A.N. NPY and MC4R signaling regulate thyroid hormone levels during fasting through both central and peripheral pathways. Cell Metab. 2011;14:780–790. doi: 10.1016/j.cmet.2011.10.009. [DOI] [PMC free article] [PubMed] [Google Scholar]
- Vernia S., Cavanagh-Kyros J., Barrett T., Jung D.Y., Kim J.K., Davis R.J. Diet-induced obesity mediated by the JNK/DIO2 signal transduction pathway. Genes Dev. 2013;27:2345–2355. doi: 10.1101/gad.223800.113. [DOI] [PMC free article] [PubMed] [Google Scholar]
- Wallis K., Dudazy S., van Hogerlinden M., Nordström K., Mittag J., Vennström B. The thyroid hormone receptor alpha1 protein is expressed in embryonic postmitotic neurons and persists in most adult neurons. Mol. Endocrinol. 2010;24:1904–1916. doi: 10.1210/me.2010-0175. [DOI] [PMC free article] [PubMed] [Google Scholar]
- Warner A., Mittag J. Thyroid hormone and the central control of homeostasis. J. Mol. Endocrinol. 2012;49:R29–R35. doi: 10.1530/JME-12-0068. [DOI] [PubMed] [Google Scholar]
- Xu P., Das M., Reilly J., Davis R.J. JNK regulates FoxO-dependent autophagy in neurons. Genes Dev. 2011;25:310–322. doi: 10.1101/gad.1984311. [DOI] [PMC free article] [PubMed] [Google Scholar]
- Xu Y., Nedungadi T.P., Zhu L., Sobhani N., Irani B.G., Davis K.E., Zhang X., Zou F., Gent L.M., Hahner L.D. Distinct hypothalamic neurons mediate estrogenic effects on energy homeostasis and reproduction. Cell Metab. 2011;14:453–465. doi: 10.1016/j.cmet.2011.08.009. [DOI] [PMC free article] [PubMed] [Google Scholar]
Associated Data
This section collects any data citations, data availability statements, or supplementary materials included in this article.