Abstract
T2-weighted cardiovascular magnetic resonance (CMR) using a 3-slice approach has been shown to accurately quantify the edema-based area-at-risk (AAR) in ST-segment elevation myocardial infarction (STEMI). We aimed to compare the performance of a 3-slice approach to full left ventricular (LV) coverage for the AAR by T1 and T2 mapping and MI size. Forty-eight STEMI patients were prospectively recruited and underwent a CMR at 4 ± 2 days. There was no difference between the AARfull LV and AAR3-slices by T1 (P = 0.054) and T2-mapping (P = 0.092), with good correlations but small biases and wide limits of agreements (T1-mapping: N = 30, R2 = 0.85, bias = 1.7 ± 9.4% LV; T2-mapping: N = 48, R2 = 0.75, bias = 1.7 ± 12.9% LV). There was also no significant difference between MI size3-slices and MI sizefull LV (P = 0.93) with an excellent correlation between the two (R2 0.92) but a small bias of 0.5% and a wide limit of agreement of ±7.7%. Although MSI was similar between the 2 approaches, MSI3-slices performed poorly when MSI was <0.50. Furthermore, using AAR3-slices and MI sizefull LV resulted in ‘negative’ MSI in 7/48 patients. Full LV coverage T1 and T2 mapping are more accurate than a 3-slice approach for delineating the AAR, especially in those with MSI < 0.50 and we would advocate full LV coverage in future studies.
Introduction
Myocardial salvage index (MSI) is considered a more accurate measure to assess the cardioprotective efficacy of novel therapies aiming to reduce myocardial infarct (MI) size in reperfused ST-segment elevation myocardial infarction (STEMI) patients1–3 and it has recently been shown to reduce sample size compared to MI size3. To assess MSI, knowledge of both the MI size and the area-at-risk (AAR) are required and can be calculated using the formula MSI = 1 − (MI/AAR). Cardiovascular magnetic resonance (CMR) is considered the gold standard imaging modality for quantifying MI size4, and it can also provide information on the edema-based AAR5–7. T2-weighted short tau inversion recovery (STIR) imaging in the first week following primary percutaneous coronary intervention (PPCI) has been used to delineate the AAR in reperfused STEMI patients, although its robustness has recently been questioned8. T2-mapping9, 10 has emerged as a more robust technique for the AAR and native T1 mapping has also been shown to perform well against T2 mapping in a canine model of MI11, and in clinical patients at 3.0 T5.
The accurate quantification of the AAR conventionally requires full left ventricular (LV) coverage. Recently, a 3-slice approach has been proposed for T2-weighted STIR imaging, with the obvious benefit of shorter scan and analysis time12. The main aim of this study was to assess whether the 3-slice approach will also perform as well as full LV coverage, using T1 and T2 mapping to delineate the AAR. Secondly, we aimed to assess the impact of a 3-slice approach for the AAR and MI size on MSI.
Results
Baseline clinical characteristics of the 48 patients are listed in Table 1. The mean age was 59 ± 13 years and 88% (42/48) male gender. The median onset-to-balloon time was 182 (128–328) minutes. CMR was performed at 4 ± 2 days post PPCI. The mean MI size (using full LV coverage) was 27.4 ± 14.6% LV and late MVO occurred in 63% (30/48) of patients. The average number of T1 and T2 maps for full LV analysis was 8 ± 1 per patient.
Table 1.
Baseline clinical characteristics of STEMI patients.
| Details | Patients with full LV T2 maps | Patients with full LV T1 maps |
|---|---|---|
| Number of patients | 48 | 30 |
| Male | 40 (83%) | 23 (77%) |
| Age | 58 ± 13 | 55 ± 12 |
| Diabetes Mellitus | 9 (19%) | 7 (23%) |
| Hypertension | 15 (31%) | 8 (27%) |
| Smoking | 15 (31%) | 11 (37%) |
| Dyslipidemia | 15 (31%) | 8 (27%) |
| Chest pain onset to PPCI time (minutes) | 182 (128–328) | 213 (131–385) |
| Infarct artery (%) | ||
| LAD | 28 (58%) | 19 (63%) |
| RCA | 18 (38%) | 9 (30%) |
| Cx | 2 (4%) | 2 (7%) |
| Pre-PPCI TIMI flow (%) | ||
| 0 | 38 (80%) | 21 (70%) |
| 1 | 1 (2%) | 1 (3%) |
| 2 | 4 (8%) | 3 (10%) |
| 3 | 5 (10%) | 5 (17%) |
| Post-PPCI TIMI flow (%) | ||
| 0 | 1 (2%) | 1 (3%) |
| 1 | 0 (0%) | 0 (0%) |
| 2 | 10 (21%) | 2 (7%) |
| 3 | 37 (77%) | 27 (90%) |
| Timing of CMR/days | 4 ± 2 | 3 ± 1 |
| CMR findings | ||
| LVEF/% | 49 ± 8 | 52 ± 8 |
| LV Mass/g | 113 ± 35 | 121 ± 27 |
| MI size/% LV | 27.4 ± 14.6 | 25.6 ± 14.1 |
| AAR by T2/% LV | 42.7 ± 11.9 | 42.2 ± 11.9 |
LAD: left anterior descending artery; RCA: right coronary artery; Cx: circumflex artery; TIMI: thrombolysis in myocardial infarction.
T1 mapping versus T2 mapping, n = 30
In the 30 patients with full LV coverage for T1 and T2 maps, The AARfull LV was not significantly different between the 2 mapping techniques (42.6 ± 12.0% LV versus 42.2 ± 11.9% LV, P = 0.44) with an excellent correlation and agreement on Bland-Altman analysis (R2 0.94, bias: 0.4%, limits of agreement ±5.9%).
3-slice versus full LV AAR by T1 mapping, n = 30
There was no difference between the AARfull LV and AAR3-slices by T1 mapping [n = 30, 43 (34–51)% LV versus 40 (32–48)% LV, P = 0.054] and there was a good correlation between the two (R2 0.85). However, there was a small bias of 1.7% LV and the limits of agreement were quite wide at ±9.4% LV.
3-slice versus full LV AAR by T2 mapping, n = 48
Likewise, for T2 mapping, there was no difference between the AARfull LV and AAR3-slices [n = 48, 41 (34–52)% LV versus 40 (32–51)% LV, P = 0.092] and there was a good correlation between the two (R2 0.75) (Fig. 1a). However, there was a small bias of 1.7% LV and the limits of agreement were quite wide at ±12.9% LV (Fig. 1b).
Figure 1.
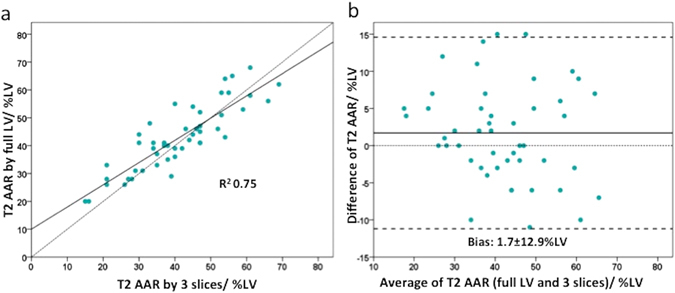
Performance of the full LV coverage versus 3-slice approach for the T2-based AAR. (a) The correlation between the 2 approaches; (b) The Bland-Altman plot.
Full LV coverage MI size versus 3-slice MI size, n = 48
There was no significant difference between MI size3-slices and MI sizefull LV (P = 0.93) with a very good correlation between the two (R2 0.92) as shown in Fig. 2a. Bland-Altman analysis showed a small bias of 0.5% but there was a wide limit of agreement of ±7.7% (Fig. 2b).
Figure 2.
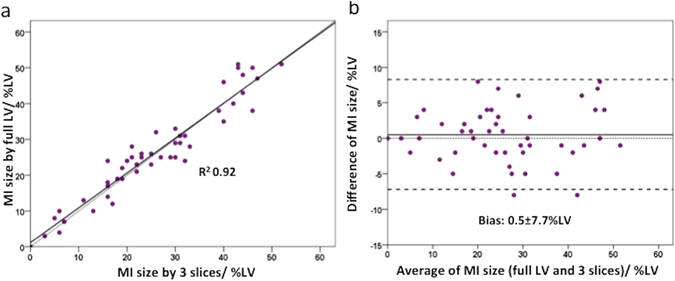
Performance of the full LV coverage versus 3-slice approach for the MI size. (a) The correlation between the 2 approaches; (b) The Bland-Altman plot.
MSI: 3-slice (whole LV coverage for MI size and 3 slices for AAR) versus full LV coverage
MSI was calculated using the formula MSI = 1 − (MI size/AAR), where MI size was quantified using full LV short axis coverage and AAR was quantified by using full LV coverage or 3 slices by T2 mapping and T1 mapping.
For T2 mapping (n = 48), the MSI was 0.35 (0.18–0.55) for T2 AARfull LV and 0.34 (0.14–0.54) for T2 AAR3-slices, P = 0.050 (Fig. 3). Although similar, the MSI3-slices performed poorly when the MSI was <0.50 compared to ≥0.50 (R2 0.45 versus R2 0.91, P < 0.001), Fig. 4. Bland-Altman analysis showed a bias of 0.06 but a wide limit of agreement of ±0.33. Furthermore, the 3-slice strategy underestimated the AAR in 7 out of 48 patients and resulted in a negative MSI (Figs 3 and 4). When these 7 patients were excluded, the R2 of the remaining 41 patients for MSI3-slices versus MSIfull LV was 0.90, with a bias of 0 but limits of agreement of ±0.15, which is still wide for clinical application.
Figure 3.
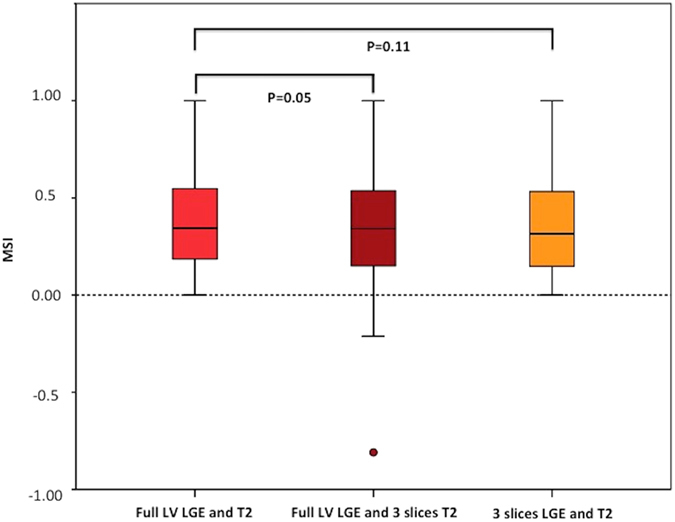
Performance of the 3 approaches for the T2-based MSI. Box and whisker plots of the MSI by T2 using full LV coverage for both the MI size and AAR; 3-slice approach for AAR and full LV coverage for the MI size; and 3-slice approach for both the MI size and AAR. The MSI using 3-slice approach for AAR and full LV coverage for the MI size resulted in negative MSI in 7 patients.
Figure 4.
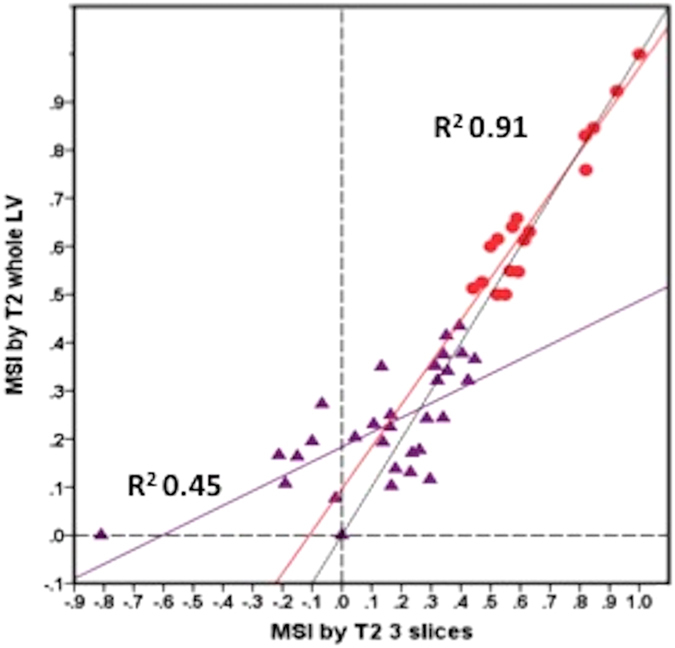
Correlation between the MSI derived by the 2 approaches, subdivided by MSI above or below 0.50. The dotted lines represent the line of identity. The dashed lines represent the lines passing through 0 on the x and y-axis.
The same pattern was observed for T1 mapping (n = 30). The R2 was 0.94 for MSI > 0.50 and was 0.43 for MSI < 0.50 (3 out of 30 patients resulted in a negative MSI using the 3-slice strategy).
MSI: 3-slice (3 slices for both MI size and AAR) versus full LV coverage, n = 48
When MSI was calculated using 3 slices for both MI size and T2 AAR, there was no significant difference between MSIfull LV and the MSI3-slices (P = 0.11) as shown in the box and whisker plots in Fig. 3. There was a moderate correlation between the two (R2 0.79) and Bland-Altman analysis showed a small bias of 0.03 but a wide limit of agreement of ±0.24. Of note, none of the MSI obtained were negative. Visually, there was a wider dispersion between the points and the correlation line for those with MSI < 0.50 than those with MSI > 0.50 in Fig. 5a, which was also reflected in the Bland-Altman plot (Fig. 5b). The R2 was 0.28 for those with MSI < 0.50 and 0.65 for those with MSI > 0.50.
Figure 5.
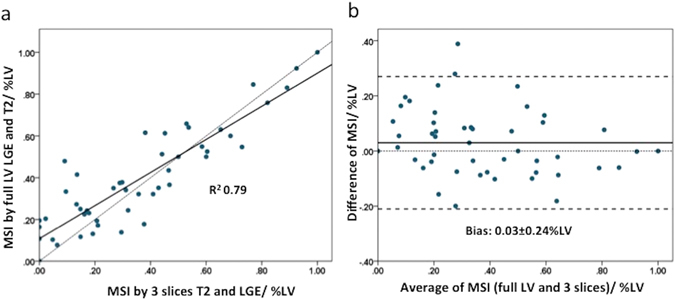
Performance of the full LV coverage versus 3-slice approach (both for the AAR and the MI size) for the MSI. (a) The correlation between the 2 approaches; (b) The Bland-Altman plot.
Discussion
These results suggest that although a 3-slice approach had a good correlation with the full LV approach both for the edema-based AAR and MI size, the limits of agreements were quite wide for clinical application and the derived MSI was inadequate, especially when the MSI was <0.50. Furthermore, when MSI was calculated using whole LV coverage for MI size and the 3 slices for AAR as previously done by Hamshere et al.12, this approach underestimated the AAR in 7/48 patients for T2 mapping and 3/30 patients for T1 mapping and resulted in a negative MSI, which is not plausible in practice and would impact on mean MSI in a cardioprotection study. In the clinical setting, it is difficult to know whether a patient would have MSI more than or less than 0.50 prior to acquiring the images and the analysis the MI size and AAR data and therefore full LV acquisition of T1 or T2 maps is recommended when the edema-based AAR needs to be assessed.
Performing a comprehensive CMR study for research purposes to obtain information on MI size, edema-based AAR, MVO and extracellular volume fraction in a patient with a recent STEMI can take up to 1 hour and therefore shortening the CMR duration is highly desirable. Recently, a 3-slice approach for assessing the AAR by T2-weighted STIR imaging has been shown to perform as well as full LV coverage and offered the possibility to shorten the scan time12. However, T2-weighted imaging has several limitations including the subjective interpretation of the images, variations in regional myocardial intensity due to changes in sensitivity of surface coils, blood-pooling artefacts at the subendocardial border, its relatively low contrast-to-noise ratio between normal and abnormal myocardium, and its susceptibility to breathing and motion artefacts13, 14. T1 and T2 mapping has recently emerged as a more robust technique to delineate the edema-based AAR11 and both these techniques at 1.5 T correlated well with the AAR by single photon emission tomography15 and performed equally well against each other in the clinical setting5. However, unlike in the study by Hamshere et al.12, the 3-slice approach did not perform well against full LV approach using T1 and T2 mapping, especially in those patients with MSI < 0.50. Although they included a larger number of patients, the mean MI size and AAR was much smaller in their cohort (MI size: 18% LV versus 27% LV; AAR: 27% LV versus 41% LV) and MSI was larger (41% versus 35%) when compared to our cohort.
Limitations
Our sample size for comparing 3-slice versus full LV coverage was 48 compared to 85 in the previous study12 and no formal power calculation was performed prospectively. However, we used the more robust edema-based AAR technique (both T1 and T2 mapping) and included patients with a range of MI size and AAR. A retrospective power calculation (PASS 15 Power Analysis and Sample Size Software (2017). NCSS, LLC. Kaysville, Utah, USA, ncss.com/software/pass) for paired measurements from a sample size of 48 achieved 100% power to detect non-inferiority using a one-sided t-test when the margin of non-inferiority was set at 0.00% and the true difference between the mean (1.70%) and the standard deviation (6.45%) were derived from the Bland-Altman analysis (significance level (alpha) of 0.15). We did not have T2-weighted STIR images acquired for these patients for comparison.
Conclusion
Despite the clear benefits of a shorter scan and analysis time, we caution against using a 3-slice approach for the edema-based AAR by T1 and T2 mapping, especially in those with MSI < 0.50. Full LV coverage should remain the quantification approach of choice for the AAR in clinical cardioprotection studies.
Methods
Study Population
48 acute STEMI patients reperfused by PPCI from a recently reported cohort were included in this study16–20. In brief, the London-Harrow Research Ethics Committee approved this study. These patients were prospectively recruited between August 2013 and July 2014 following informed consent. All research-related procedures were performed in accordance with the local guidelines and regulations. The management of STEMI was as per current guidelines21. Study exclusion criteria were known previous MI and standard recognized contraindications to CMR.
Imaging acquisition
All CMR scans were performed on a 1.5 Tesla scanner (Magnetom Avanto, Siemens Medical Solutions) using a 32-channel phased-array cardiac coil. Full LV coverage native T1 mapping was available in 30 patients. Full LV coverage for T2 mapping and late gadolinium enhancement (LGE) were available in all 48 patients.
Native T1 mapping (Work in Progress #448B)
Native T1 maps were acquired with a steady state free precession (SSFP)-based modified Look-Locker inversion recovery (MOLLI) sequence (flip angle = 35°; pixel bandwidth 977 Hz/pixel; voxel size = 1.5 × 1.5 × 6.0 mm; echo time = 1.1 ms; matrix = 256 × 144; slice thickness = 6 mm with 4 mm gap) using a 5s(3s)3s modified sampling protocol22. Motion correction and a non-linear least-square curve fitting of the set of images acquired at different inversion times were performed inline by the scanner to generate a pixel-wise colored T1 map23.
T2 mapping (Work in Progress #448B)
Colored T2 maps consisting of pixel-wise T2 values (Work In Progress 448B, Siemens Healthcare) were generated following motion correction and fitting to estimate T2 relaxation times9 after acquiring 3 single-shot images (flip angle = 70°; pixel bandwidth 930 Hz/pixel; voxel size = 2.0 × 2.0 × 6.0 mm; echo time = 1.1 ms; repetition time = 3 × R-R interval; matrix = 116 × 192; slice thickness = 6 mm with 4 mm gap) at different T2 preparation times (0 ms, 24 ms, and 55 ms, respectively).
LGE imaging
LGE imaging was acquired with a standard segmented ‘fast low-angle shot’ two-dimensional inversion-recovery gradient echo sequence or a respiratory motion-corrected, free-breathing single shot SSFP averaged phase sensitive inversion recovery sequence24, 25 at 10–15 minutes after the injection of 0.1 mmol/kg of Gadoterate meglumine (Gd-DOTA marketed as Dotarem, Guerbet S.A., Paris, France).
Imaging analysis
All imaging analysis was performed using CVI42 software (Version 5.1.2[303], Calgary, Canada). The imaging analysis methods have been previously described16–18. In brief, the endocardial and epicardial borders were manually drawn on the LGE, T1 and T2 maps. Areas of hypo-intense core of microvascular obstruction were included as part of the MI zone and AAR.
For the full LV coverage approach, MI size was quantified using a signal intensity threshold of 5 standard deviations (SD) above the normal remote myocardium4 and expressed as a percentage of the whole LV (% LV). All the short axis LGE images covering the whole LV were used to quantify MI size. The full LV edema-based AAR (AARfull LV) from the T1 and T2 maps were quantified using a threshold of 2-SD above the remote myocardium and expressed as % LV.
For the 3-slice approach, only basal, mid and apical LV slices for MI size and AAR were analyzed using the same approach by Hamshere et al.12 and as illustrated in Fig. 6. In brief, the basal LV slice was chosen as the first short axis slice basally below the LV short axis with left ventricular outflow track. The mid LV slice was the short axis slice with papillary muscle heads visible and at distance of at least 2 slices from the basal LV slice. The apical LV slice was the short axis slice at a distance of at least 2 slices from the mid LV slice and with visible LV cavity present on the short axis. T1, T2 maps and LGE images with matching slice position were used for the AAR3-slices and MI size3-slices quantification.
Figure 6.
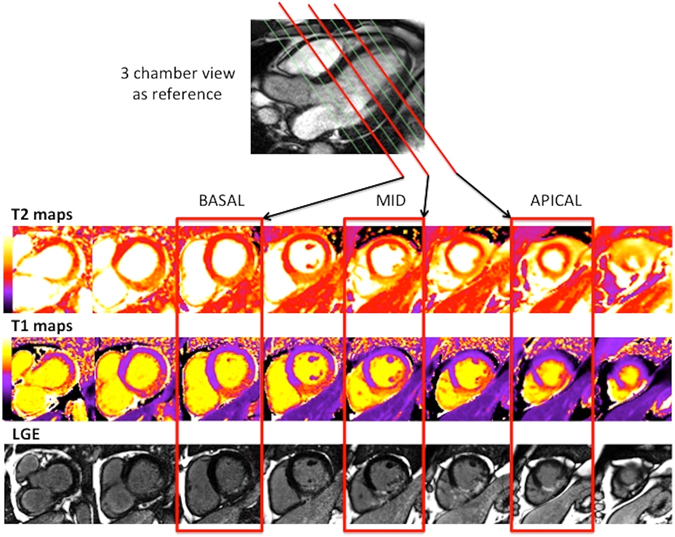
Matching T2 maps, T1 maps and LGE images of a patient with an inferior STEMI. This figure shows the selection of 3 slices (basal, mid and apical) of T2 maps, T1 maps and LGE images from the full LV coverage images of a patient with an inferior STEMI, and with the 3-chamber view as reference.
Statistical analysis
SPSS version 22 (IBM Corporation, Illinois, US) was used for all statistical analysis. Shapiro-Wilk Test was used to assess for normality. Continuous data was expressed as mean ± standard deviation (SD) or median (interquartile range) and categorical data was reported as frequencies and percentages. Groups were compared using paired Student t-test/Wilcoxon signed rank test or unpaired Student t-test/Mann Whitney U test where appropriate. Correlation was assessed using either Pearson’s correlation coefficient for normally distributed data or Spearman’s rho for non-normally distributed data. Bland-Altman analysis was performed for inter-method agreement and expressed as bias and limits of agreement (±2 SD). All statistical tests were two-tailed, and P < 0.05 was considered statistically significant.
Acknowledgements
This work was supported by the British Heart Foundation (FS/10/039/28270), the Rosetrees Trust, and the National Institute of Health Research University College London Hospitals Biomedical Research Centre. HACF is funded by a Startup Grant of the “Excellence Cluster Cardio-Pulmonary System” (ECCPS) from the German Research Foundation (DFG, Bonn, Germany), “Peter und Traudl Engelhorn-Stiftung” (Weilheim, Germany) and by the Russian Government Program for competitive growth of Kazan Federal University.
Author Contributions
All the authors reviewed the manuscript. H.B., M.R., R.F., T.K., D.S.K. and M.F. patient recruitment and CMR acquisition. H.B., J.A.B., M.X.L., H.A.C.F. and X.W.T. performed imaging analysis. H.B. performed statistical analysis. H.B., J.C.M. and D.J.H. prepared the manuscript and managed funding.
Competing Interests
The authors declare that they have no competing interests.
Footnotes
Publisher's note: Springer Nature remains neutral with regard to jurisdictional claims in published maps and institutional affiliations.
References
- 1.Friedrich MG, et al. The salvaged area at risk in reperfused acute myocardial infarction as visualized by cardiovascular magnetic resonance. Journal of the American College of Cardiology. 2008;51:1581–1587. doi: 10.1016/j.jacc.2008.01.019. [DOI] [PubMed] [Google Scholar]
- 2.Botker HE, Kaltoft AK, Pedersen SF, Kim WY. Measuring myocardial salvage. Cardiovascular research. 2012;94:266–275. doi: 10.1093/cvr/cvs081. [DOI] [PubMed] [Google Scholar]
- 3.Engblom, H. et al. Sample Size in Clinical Cardioprotection Trials Using Myocardial Salvage Index, Infarct Size, or Biochemical Markers as Endpoint. Journal of the American Heart Association5, Advance online publication (2016). [DOI] [PMC free article] [PubMed]
- 4.Schulz-Menger J, et al. Standardized image interpretation and post processing in cardiovascular magnetic resonance: Society for Cardiovascular Magnetic Resonance (SCMR) board of trustees task force on standardized post processing. Journal of cardiovascular magnetic resonance: official journal of the Society for Cardiovascular Magnetic Resonance. 2013;15:35. doi: 10.1186/1532-429X-15-35. [DOI] [PMC free article] [PubMed] [Google Scholar]
- 5.Bulluck H, et al. T1 mapping and T2 mapping at 3T for quantifying the area-at-risk in reperfused STEMI patients. Journal of cardiovascular magnetic resonance: official journal of the Society for Cardiovascular Magnetic Resonance. 2015;17:73. doi: 10.1186/s12968-015-0173-6. [DOI] [PMC free article] [PubMed] [Google Scholar]
- 6.Dall’Armellina E, et al. Cardiovascular magnetic resonance by non contrast T1-mapping allows assessment of severity of injury in acute myocardial infarction. Journal of cardiovascular magnetic resonance: official journal of the Society for Cardiovascular Magnetic Resonance. 2012;14:15. doi: 10.1186/1532-429X-14-15. [DOI] [PMC free article] [PubMed] [Google Scholar]
- 7.Berry C, et al. Magnetic Resonance Imaging Delineates the Ischemic Area at Risk and Myocardial Salvage in Patients With Acute Myocardial Infarction. Circulation-Cardiovascular Imaging. 2010;3:527–535. doi: 10.1161/CIRCIMAGING.109.900761. [DOI] [PMC free article] [PubMed] [Google Scholar]
- 8.Kim HW, et al. Relationship of T2-Weighted MRI Myocardial Hyperintensity and the Ischemic Area-At-Risk. Circulation research. 2015;117:254–265. doi: 10.1161/CIRCRESAHA.117.305771. [DOI] [PMC free article] [PubMed] [Google Scholar]
- 9.Giri S, et al. T2 quantification for improved detection of myocardial edema. Journal of cardiovascular magnetic resonance: official journal of the Society for Cardiovascular Magnetic Resonance. 2009;11:56. doi: 10.1186/1532-429X-11-56. [DOI] [PMC free article] [PubMed] [Google Scholar]
- 10.Verhaert D, et al. Direct T2 quantification of myocardial edema in acute ischemic injury. JACC. Cardiovascular imaging. 2011;4:269–278. doi: 10.1016/j.jcmg.2010.09.023. [DOI] [PMC free article] [PubMed] [Google Scholar]
- 11.Ugander M, et al. Myocardial edema as detected by pre-contrast T1 and T2 CMR delineates area at risk associated with acute myocardial infarction. JACC. Cardiovascular imaging. 2012;5:596–603. doi: 10.1016/j.jcmg.2012.01.016. [DOI] [PMC free article] [PubMed] [Google Scholar]
- 12.Hamshere S, et al. Cardiovascular magnetic resonance imaging of myocardial oedema following acute myocardial infarction: Is whole heart coverage necessary? Journal of cardiovascular magnetic resonance: official journal of the Society for Cardiovascular Magnetic Resonance. 2016;18:7. doi: 10.1186/s12968-016-0226-5. [DOI] [PMC free article] [PubMed] [Google Scholar]
- 13.Arai AE. Using magnetic resonance imaging to characterize recent myocardial injury: utility in acute coronary syndrome and other clinical scenarios. Circulation. 2008;118:795–796. doi: 10.1161/CIRCULATIONAHA.108.797373. [DOI] [PMC free article] [PubMed] [Google Scholar]
- 14.Pennell D. Myocardial salvage: retrospection, resolution, and radio waves. Circulation. 2006;113:1821–1823. doi: 10.1161/CIRCULATIONAHA.105.618942. [DOI] [PubMed] [Google Scholar]
- 15.Langhans B, et al. Reproducibility of area at risk assessment in acute myocardial infarction by T1- and T2-mapping sequences in cardiac magnetic resonance imaging in comparison to Tc99m-sestamibi SPECT. The international journal of cardiovascular imaging. 2014;30:1357–1363. doi: 10.1007/s10554-014-0467-z. [DOI] [PubMed] [Google Scholar]
- 16.Bulluck, H. et al. Automated Extracellular Volume Fraction Mapping Provides Insights Into the Pathophysiology of Left Ventricular Remodeling Post-Reperfused ST-Elevation Myocardial Infarction. Journal of the American Heart Association5 (2016). [DOI] [PMC free article] [PubMed]
- 17.Bulluck H, et al. Residual Myocardial Iron Following Intramyocardial Hemorrhage During the Convalescent Phase of Reperfused ST-Segment–Elevation Myocardial Infarction and Adverse Left Ventricular Remodeling. Circulation: Cardiovascular Imaging. 2016;9:e004940. doi: 10.1161/CIRCIMAGING.116.004940. [DOI] [PMC free article] [PubMed] [Google Scholar]
- 18.Bulluck H, et al. Impact of microvascular obstruction on semiautomated techniques for quantifying acute and chronic myocardial infarction by cardiovascular magnetic resonance. Open Heart. 2016;3:e000535. doi: 10.1136/openhrt-2016-000535. [DOI] [PMC free article] [PubMed] [Google Scholar]
- 19.Bulluck H, et al. Defining left ventricular remodeling following acute ST-segment elevation myocardial infarction using cardiovascular magnetic resonance. Journal of cardiovascular magnetic resonance: official journal of the Society for Cardiovascular Magnetic Resonance. 2017;19:26. doi: 10.1186/s12968-017-0343-9. [DOI] [PMC free article] [PubMed] [Google Scholar]
- 20.Bulluck, H. et al. Diagnostic Performance of T1 and T2 Mapping to Detect Intramyocardial Hemorrhage in Reperfused ST-Segment Elevation Myocardial Infarction (STEMI) Patients. Journal of magnetic resonance imaging: JMRI (2017). [DOI] [PMC free article] [PubMed]
- 21.Steg PG, et al. ESC Guidelines for the management of acute myocardial infarction in patients presenting with ST-segment elevation. European heart journal. 2012;33:2569–2619. doi: 10.1093/eurheartj/ehs289. [DOI] [PubMed] [Google Scholar]
- 22.Kellman P, Hansen MS. T1-mapping in the heart: accuracy and precision. Journal of cardiovascular magnetic resonance: official journal of the Society for Cardiovascular Magnetic Resonance. 2014;16:2. doi: 10.1186/1532-429X-16-2. [DOI] [PMC free article] [PubMed] [Google Scholar]
- 23.Xue H, et al. Motion correction for myocardial T1 mapping using image registration with synthetic image estimation. Magnetic resonance in medicine: official journal of the Society of Magnetic Resonance in Medicine/Society of Magnetic Resonance in Medicine. 2012;67:1644–1655. doi: 10.1002/mrm.23153. [DOI] [PMC free article] [PubMed] [Google Scholar]
- 24.Ledesma-Carbayo MJ, Kellman P, Hsu LY, Arai AE, McVeigh ER. Motion corrected free-breathing delayed-enhancement imaging of myocardial infarction using nonrigid registration. Journal of magnetic resonance imaging: JMRI. 2007;26:184–190. doi: 10.1002/jmri.20957. [DOI] [PubMed] [Google Scholar]
- 25.Kellman P, Arai AE. Cardiac imaging techniques for physicians: late enhancement. Journal of magnetic resonance imaging: JMRI. 2012;36:529–542. doi: 10.1002/jmri.23605. [DOI] [PMC free article] [PubMed] [Google Scholar]


