

Abstract
Protein-bound water molecules are essential for the structure and function of many membrane proteins, including G-protein-coupled receptors (GPCRs). Our prior work focused on studying the primate green- (MG) and red- (MR) sensitive visual pigments using low-temperature Fourier transform infrared (FTIR) spectroscopy, which revealed protein-bound waters in both visual pigments. Although the internal waters are located in the vicinity of both the retinal Schiff base and retinal β-ionone ring, only the latter showed differences between MG and MR, which suggests their role in color tuning. Here, we report FTIR spectra of primate blue-sensitive pigment (MB) in the entire mid-IR region, which reveal the presence of internal waters that possess unique water vibrational signals that are reminiscent of a water cluster. These vibrational signals of the waters are influenced by mutations at position Glu113 and Trp265 in Rh, which suggest that these waters are situated between these two residues. Because Tyr265 is the key residue for achieving the spectral blue-shift in λmax of MB, we propose that these waters are responsible for the increase in polarity toward the retinal Schiff base, which leads to the localization of the positive charge in the Schiff base and consequently causes the blue-shift of λmax.
Introduction
Vision constitutes 80% of human sensory information. One important function of vision is color discrimination. Many vertebrates share this sense and have evolved to adapt to different life environments, such as blue, green, and red (RGB) color perception in humans and more than four types of color perception in birds, fishes, insects, and crustaceans1–3. A remaining issue is how humans distinguish this wide range of wavelengths using the same chromophore. Four types of light-sensitive molecules and visual pigments exist in our retina: rhodopsin (Rh), which is responsible for the highly sensitive twilight vision, and three cone pigments that mediate color discrimination. Each cone pigment absorbs blue (λmax = 425 nm), green (λmax = 530 nm) or red (λmax = 560 nm) light4–6, which corresponds to our RGB primary colors. All pigments possess the common chromophore 11-cis-retinal, which is covalently bound to the protein moiety. The specific interaction between 11-cis-retinal and the protein moiety determines the absorption of various wavelengths of light7. In spectral tuning, chromophore-protein interactions include (I) chromophore distortion, (II) electrostatic interactions between the protonated Schiff base and its specific counterion amino acid, e.g., glutamic acid at position 113 in Rh, and (III) polarity modulation around the β-ionone ring and polyene chain7.
For G protein-coupled receptors (GPCRs), the largest family of membrane proteins that mediate most of our cellular responses (including vision) are protein-bound internal water molecules, which play a critical role in protein stabilization, ligand recognition and G protein activation8, 9. Note that water molecules also play an active role in modulating the polarity of their ligand binding pocket7.
Fourier transform infrared (FTIR) spectroscopy has been extensively used to investigate not only the chromophore structure and chromophore-protein interactions but also protein-bound water molecules10–13. Previously, we reported light-induced differences in the FTIR spectra of primate green- (MG) and red- (MR) sensitive pigments at 77 K, which provided direct evidence of the presence of internal water molecules in the retinal binding pocket and new insight into the spectral tuning mechanism14–16. The observed vibrational signals of the water molecules in MG and MR were slightly different from each other, and these water molecules were proposed to be situated in the β-ionone ring region of the chromophore. Thus, protein-bound water molecules around the β-ionone ring may also be responsible for the 30 nm difference in λmax between MG and MR.
Herein, we report the first difference in the FTIR spectra of the primate blue-sensitive pigment (MB) that contains vital information regarding the retinal chromophore, protein moiety, and internal water molecules. In comparison with other pigments, MB displayed significant differences in its retinal conformation and the peptide-backbone structure of α-helices. Additionally, the unique hydrogen-bonding network of water was found in the vicinity of 11-cis-retinal. In contrast, previous site-directed mutagenesis studies have reported that several mutations in the vicinity of the retinal chromophore of the human blue-sensitive pigment (HB) induced a spectral shift in λmax 17, 18. Among them, Y265W in HB resulted in a significant red-shift of approximately 10 nm in λmax 18. Then, in our report, mutation studies, which were focused on the spectral blue shift in λmax of MB (like Y265W and/or E113D), revealed a dipole effect in the specific internal water cluster. Unique retinal-protein interactions can be clarified using the present comprehensive vibrational spectral analysis of cone pigments.
Results and Discussion
Batho minus MB, MRh, MG, and MR infrared spectra in the 1800–800 cm−1 region
Figure 1 shows a comparison of all-trans minus 11-cis difference FTIR spectra that correspond to primary structural changes in the visual excitation of each cone pigment. The overall spectral features of MB are similar to that of MRh, MG, and MR, although they share ~50% of the sequence identity in the 26 amino acid residues that surround the retinal chromophore (Figure S1)5. A pair of peaks at 1576 (−)/1560 (+) cm−1 corresponds to the ethylenic C=C stretching vibration of MB, and a spectral down-shift in this vibrational mode of the retinal chromophore at 1580–1500 cm−1 corresponds to a red-shift in the visible region7, which is evident from the linear correlation between λmax and the negative frequency of the 11-cis form (Figure S2d).
Figure 1.
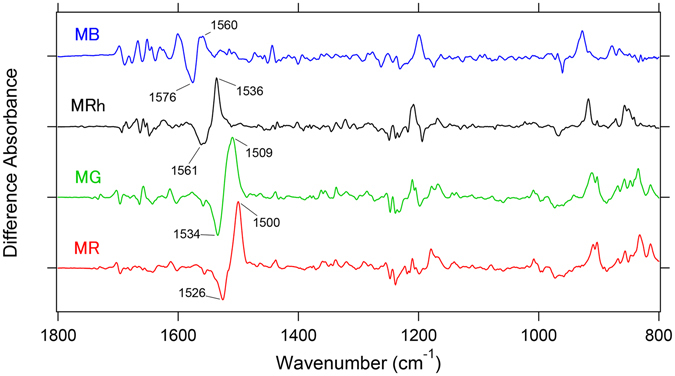
Light-induced difference FTIR spectra of MB, MRh, MG and MR in the 1800–800 cm−1 region at 77 K. Light-induced all-trans minus 11-cis difference FTIR spectra of MB, MRh, MG and MR in the 1800–800 cm−1 region measured at 77 K in D2O. The negative bands originate from the 11-cis form in the unphotolyzed state, whereas the positive bands originate from the all-trans form (batho-intermediate; Batho) after retinal photoisomerization. One division of the y-axis corresponds to 0.0015 absorbance units. A pair of bands at 1600–1500 cm−1 for each pigment corresponds to the ethylenic C=C stretching vibration of the retinal chromophore, and their spectral down-shifts correspond to the red-shift in the visible region.
The retinal chromophore exhibits hydrogen out-of-plane (HOOP) wagging modes in the frequency region of 1000–800 cm−1 and reflects a structurally perturbed and/or distorted chromophore. Previous resonance Raman spectroscopic studies for rhodopsin reported that C11=C12 HOOP modes of the dark state appeared at 969 cm−1 19. In contrast to the vibrational modes of rhodopsin, the batho-intermediate state provided two bands: C11H wagging at 921 cm−1 and C12H wagging at 858 cm−1 19–21. This is in part because the strongly coupled double bond at C11 and C12 of the retinal polyene chain are decoupled by photoisomerization, in which a specific geometric distortion occurred. This interpretation is consistent with the structural comparison between rhodopsin22 and the batho-intermediate state23 (Figure S3a). Figure 2a shows the HOOP mode region of the retinal chromophore. In MB, C11=C12 HOOP modes of the dark state appear at 961 cm−1 and C11H and C12H wagging modes of the corresponding batho-intermediate state emerge at 928 and 865 cm−1, respectively. Note that the frequency of the C11H wagging mode is linearly correlated with λmax of each pigment, including the (Trp/Tyr) 265 mutants of both MB and MRh (Figs 2 and S4). Generally, HOOP modes are not correlated with absorption because they monitor local out-of-phase modes that intensify upon retinal geometric distortion as described above19–21. However, this observation indicates that a highly distorted C11 position influences the electronic state that leads to vibrational frequency changes. In fact, previous Raman spectroscopy studies suggest that the electrostatic interaction between the protonated Schiff base and counterion is relevant to the perturbation of C11=C12 HOOP vibrational modes, in which electrostatic interactions also play an important role in the spectral tuning as discussed later24.
Figure 2.
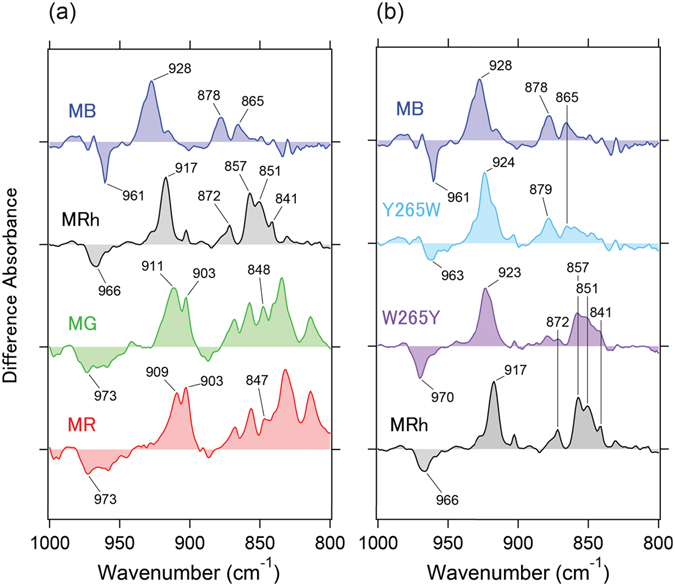
Spectral comparison of the mutant protein in the 1000–800 cm−1 region. (a) Expanded spectra from Fig. 1 in the 1000–800 cm−1 region. One division of the y-axis corresponds to 0.0009 absorbance units. (b) Light-induced all-trans minus 11-cis difference FTIR spectra of MB, MB-Y265W, MRh-W265Y and MRh in the 1000–800 cm−1 region measured at 77 K in D2O. One division of the y-axis corresponds to 0.0009 absorbance units.
Band shapes of coupled C11=C12 HOOP modes for each pigment are clearly different in the dark states, as shown in Fig. 2. Notably, the spectral features of MB are sharper relative to MG and MR (Fig. 2, left panel). Figure S4c presents the relationship between the band area of the C11=C12 HOOP mode and λmax for each pigment, which shows that the shorter wavelength absorbing pigments have smaller band areas. This result reveals that the C11=C12 HOOP mode of MB represents the strongest coupling, namely, a double bond at the C11 and C12 positions that retains its geometric planar structure compared with MG and MR in their dark states. Alternatively, the extent of decoupling of the C11=C12 HOOP mode upon photoisomerization reflects the geometric distortion of the retinal chromophore and thus can be interpreted as frequency differences between the splitting C11H and C12H wagging modes. Figure S4d and Table 1 compares the positions of the HOOP bands for C11H and C12H in the batho-intermediate states and the frequency difference values between them. Remarkably, all WT and mutated pigments display a similar pattern, which indicates both a similar distortion in the bound all-trans retinal and a common cis-trans isomerization mechanism.
For Rh, the formation of the batho-intermediate state occurs on an ultrafast timescale of 200 fs with an extremely high quantum yield of 0.6725, 26. This unique photochemical event was significantly affected by 1) the structure of the retinal binding pocket, 2) the retinal structural planarity or 3) a combination of both factors. Previous femtosecond-stimulated Raman spectroscopy measurements revealed that geometric changes that were involved in the photoisomerization of the retinal chromophore occurred on the ground potential surface from the electronically excited state to batho-intermediate state of Rh, which enabled a fast reaction rate on an approximate 200 fs timescale27. Additionally, the main alteration was only observed in the retinal conformation from the twisted 11-cis form in the dark state to the extended all-trans form22, 23. However, only minor changes in the retinal binding pocket were observed from the crystal structures of the dark and batho-intermediate states of Rh22, 23. Therefore, the chromophore structure is the most important attribute for the ultrafast photoisomerization and high quantum yield of the isomerization of Rh. However, our results indicate that the retinal conformation of MB, especially the polyene chain, retains its planar structure, unlike MRh, MG, and MR. Therefore, the environment of the retinal binding pocket also contributes to efficient retinal photoisomerization of MB. In fact, previous photocurrent measurements in photoreceptors of larval salamanders (not primates) provided similar photosensitivities of Rh, and red- and blue-sensitive cone pigments, which strongly indicate that cone pigments also have high quantum efficiencies of photoisomerization such as Rh (although the actual values of those quantum yields of retinal photoisomerization have not been determined)28.
Figure 3 shows the different FTIR spectra in the 1700–1620 cm−1 range, which mainly monitors the C=O stretch of the peptide backbone (amide-I vibration). Although the band intensity of the amide-I vibration is generally weak, which is in agreement with the comparison of the two protein conformations before and after retinal isomerization, MB showed remarkably strong peaks in the amide-I frequency of the α-helix at 1660 (−)/1651 (+) cm−1. This suggests that retinal photoisomerization accompanies large structural changes in α-helices, which correspond to approximately nine amino acid residues that were estimated by a calculation of the band intensity at 1660 cm−1 of MB in Fig. 3 and extinction coefficient of the α-helix29. Note that the band intensity of MB-Y265W dramatically decreased compared with the MB-WT, which indicates that only a single mutation at position 265 alters the environment of the retinal binding pocket between MB and other pigments. In the crystal structures of both, rhodopsin22 and its batho-intermediate23, W265 is highly conserved for class-A GPCRs and plays a role as a part of the agonist binding site30 that faces in the direction of the C11 and C12 atoms. Consequently, the structure of the retinal chromophore is curved and allows a fast rate of retinal isomerization into the extended all-trans form (Figure S3b). Thus, we postulate that the MB-Y265W mutation reduces the constraint along the polyene chain of retinal, which results in a planar conformation of the chromophore.
Figure 3.
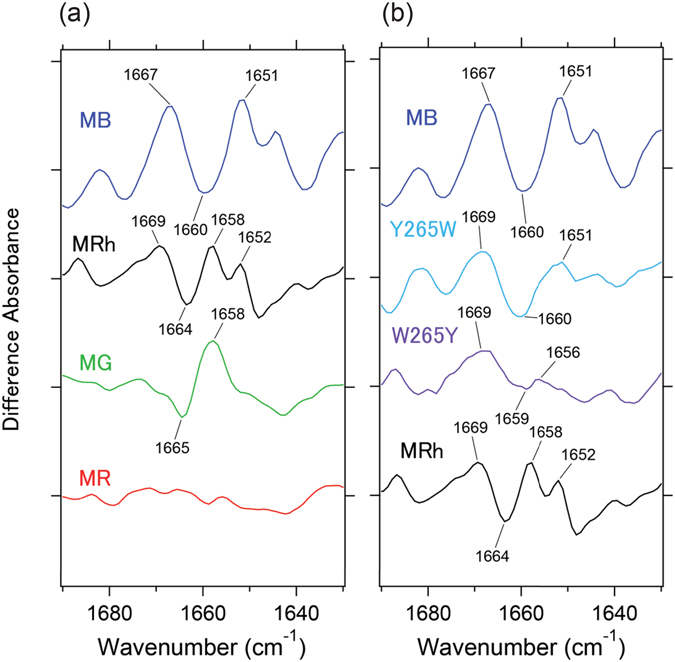
Spectral comparison of the mutant protein in the 1690–1630 cm−1 region. (a) Expanded spectra from Fig. 1 in the 1690–1630 cm−1 region. One division of the y-axis corresponds to 0.00055 absorbance units. (b) Light-induced all-trans minus 11-cis difference FTIR spectra of MB, MB-Y265W, MRh-W265Y and MRh in the 1000–800 cm−1 region measured at 77 K in D2O. One division of the y-axis corresponds to 0.00055 absorbance units.
Interestingly, the spectral feature of the amide-I band for MRh-W265Y does not reproduce the large structural change in the α-helix compared with MB. Rather, this result seems reasonable because MB and MRh share a sequence identity of only 42% in the retinal binding pocket (Figure S1). Thus, the retinal binding pocket is specially designed to achieve an efficient photoconversion for each pigment. Furthermore, it is known that the corresponding N-H stretch of the peptide backbone (amide-A vibration) appears in the 3400–3200 cm−1 region. In Figure S5, MB shows dominant pair bands at 3278 (−)/3248 (+) cm−1, whose intensity is affected by the Y265W mutation (light blue line), which is consistent with the observation in the amide-I region.
Comparison of the X-D stretching vibrations of MB, MRh, MG and MR
Figure 4 shows the X-D stretching frequency region in D2O that contains information regarding water hydrogen bonding. The observed water O-D stretch bands in both the dark and batho-intermediate states are defined as four and three, respectively. Notably, the MB-specific water band presents a broad and high intensity peak, which appears in the 2600–2500 cm−1 region. These frequencies correspond to a moderate hydrogen bonding strength of water molecules and appear similar to that of pure deuterated water in the form of ice (gray curve from 2800–1800 cm−1 in Fig. 4). Since deuterated water ice forms a tetrahedral hydrogen bonding network31, 32, the observed unique water signals strongly suggest the presence of a water cluster in the retinal binding pocket of MB. In fact, from a previous theoretical study, additional water molecules that form a hydrogen bonding network between Tyr265 and Glu113 in the vicinity of the retinal chromophore were observed33. Therefore, the present result strongly supports the presence of additional water near the retina. In Fig. 5, MB shows four negative and three positive peaks of water molecules that are smaller in number than other pigments, which does not necessarily indicate less internal water molecules in MB because peaks in the 2600–2500 cm−1 region are stronger than others and consist of multiple water signals, as described above.
Figure 4.
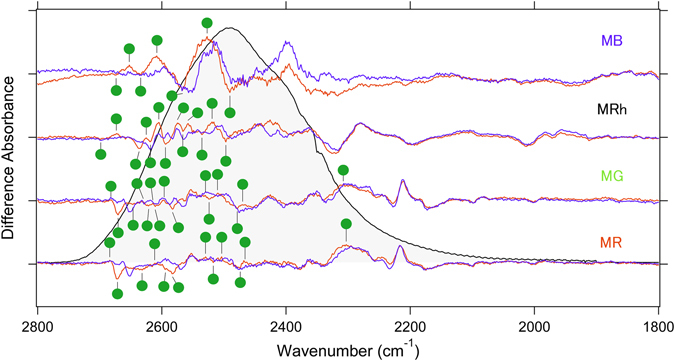
Spectral comparison of the X-D stretching vibrations of MB, MRh, MG and MR in the 28000–1800 cm−1 region at 77 K. Red and blue lines represent the spectra in D2O and D2 18O, respectively, and green labeled frequencies correspond to those identified as water-stretching vibrations. The gray curve in the 2700–2000 cm−1 regions represents O-D stretching vibrations of D2O at room temperature. One division of the y-axis corresponds to 0.0002 absorbance units.
Figure 5.
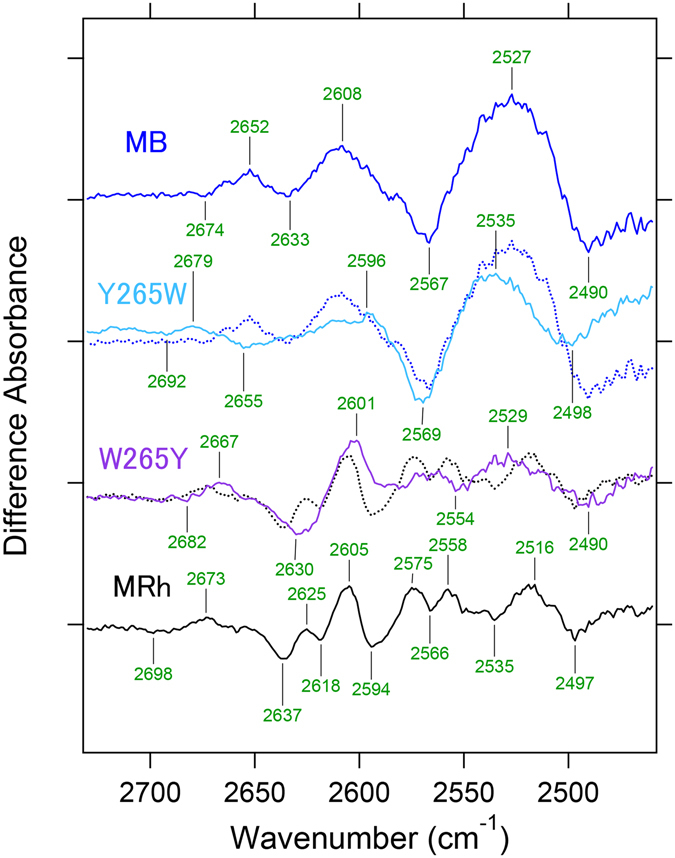
Spectral comparison of the mutant protein in the 2730–2460 cm−1 region at 77 K. Light-induced all-trans minus 11-cis difference FTIR spectra of MB, MB-Y265W, MRh-W265Y and MRh in the 2730–2460 cm−1 region measured at 77 K in D2O. Blue and black dotted lines correspond to MB and MRh, respectively. One division of the y-axis corresponds to 0.00016 absorbance units.
Since the retinal and/or retinal binding pocket has a hydrophobic environment in Rh, the content of water molecules near the retinal chromophore is restricted except for two ordered water molecules: Wat2a and Wat2b. Wat2a involves three hydrogen bonds to Ser186, Cys187, and Glu181, and Wat2b is located near Glu113 and stabilizes the protonated Schiff base of the retinal chromophore34. Alternatively, a previous analysis of the water signals for MG and MR indicated that the negative dipole moment of the oxygen side of the water molecule, which was possibly localized at the β-ionone ring side of retinal for MR, would associate with a spectral red-shift in absorbance15. The identification of MB water signals using site-directed mutational studies provides several insights into the mechanism of the spectral blue-shift. Figure 5 compares water O-D stretches of wild-type MB and MRh with each mutation at the 265 position. In the spectrum of MB-Y265W, the intensities of MB-specific water peaks at 2527 (+)/2490 (−) cm−1 are reduced. Presumably, considering the rhodopsin structure, the introduction of the bulky amino acid tryptophan to position 265 of MB prevents the presence of water molecules in the space near the retinal chromophore. Additionally, this result positively suggests that the MB-specific water cluster is located near residue 265. In the amide-I band region (Fig. 3), MB exhibits a higher signal intensity than other pigments, which corresponds to a larger structural change during retinal photoisomerization, presumably because the water cluster may correlate with the α-helical structural change.
In a previous rhodopsin study, it was postulated that the bands at 2618 or 2640 cm−1 originated from either Wat2a or Wat2b O-D stretching modes35, and both bands of MRh appear at 2618 and 2637 cm−1. Similar O-D stretch bands are also confirmed in MB at 2633 cm−1. Interestingly, frequencies of this band are down shifted to 2631 cm−1 in MB-E113D (Figure S6), which indicates that at least one water molecule is located near the Schiff base similar to rhodopsin. Moreover, the stretching frequency that corresponds to this band is affected by MB-Y265W, although the band shift is opposite to 2655 cm−1. This finding strongly suggests the existence of a water hydrogen bonding network between Tyr265 and Glu113 in MB. In fact, the band feature of the MB-specific broadened water O-D stretch is also slightly changed in MB-E113D (Figure S6). Notably, the spectrum of MRh-W265Y provides a similar water signal to that of MB. The O-D stretching vibrational bands at 2637 or 2618 cm−1, which originate from Wat2a or Wat2b, respectively, are apparently shifted to 2630 cm−1. These results also indicate the presence of a water hydrogen bonding network between Trp265 and Glu113, even though rhodopsin does not have water molecules along the retinal polyene chain. It is conceivable that a reduction in the steric bulkiness from tryptophan to tyrosine at position 265 may alter the environment between MRh and MRh-W265Y.
The spectral comparison of the X-H stretching vibration provides further structural insights into the water containing hydrogen bonding network. Under D2O hydration, vibrational bands in the 4000–2700 cm−1 region (X-H stretching vibration) originate from H-D, which are unexchangeable O-H and N-H stretching vibrations of amino acids that are involved in a hydrophobic environment. The sharp pair bands at 3485 (+)/3467 (−) cm−1 in MRh originate from the O-H stretch of Thr11814, 36, and similar bands at 3485 (+)/3428 (−) cm−1 in MG and 3486 (+)/3432 (−) cm−1 in MR are expected because of the O-H stretches of the corresponding Ser residues (Figure S7). Similarly, in MB, the pair bands at 3521 (+)/3463 (−) cm−1 correspond with other pigments in Figure S7. Note that the frequency at 3463 cm−1 in the dark state of MB is almost identical with MRh (3467 cm−1), which indicates a similar environment around Thr118. Thr118 is conserved in all vertebrate rhodopsins (Rh1 family) and also all short-wavelength sensitive pigments, which belong to the SWS1 family with λmax in the 355–445 nm37 range. The crystal structure of rhodopsin shows that Thr118 is one of the residues that form the retinal binding pocket (Figure S3b). Since Thr118 is deeply embedded inside the pocket that is surrounded by hydrophobic residues, it is inaccessible to the internal and/or bulk water, which is in good agreement with the H-D unexchangeable O-H stretching vibration of the Thr118 side chain from FTIR results38. Additionally, Glu113 exists in a position 7.8 Å away from Thr118 on the same Helix-III (Figure S3b). Therefore, the observed water clusters in MB may not be located near Thr118 but rather the retinal Schiff base side.
Molecular mechanism of spectral tuning for primate blue-sensitive visual pigment
Regarding the spectral tuning mechanism of visual pigments, it is necessary to understand the unique interaction of the retinal chromophore with their protein moieties. Vibrational spectroscopies, such as resonance Raman and infrared, have been widely utilized for retinal configuration and retinal-protein interaction investigations. However, less is known about MB due to the difficulties in sample preparation and handling39. Previously, Sakmar’s group performed Raman spectroscopy on blue-rho chimera, in which nine amino acids were swapped between the blue pigment and rhodopsin, and determined that its spectral features resembled the spectrum of the protonated Schiff base in a methanol solvent17. Thus, they inferred that the three introduced serine residues, G90S, A292S, and A295S, produced a more hydrophilic environment for the retinal Schiff base, which is similar to methanol. Additionally, these amino acids that were placed in the vicinity of the retinal Schiff base caused a reduction in π-electron delocalization along the polyene chain. However, based on the systematic sequence comparison, the serine residues at positions 90 and 295 were completely conserved in primates (including human blue pigment), whereas the residue at position 292 is alanine for all of the primate blue pigments, except for human (serine). Hence, the mechanism underlying the spectral blue-shift of primate blue pigment has been controversial. Based on FTIR studies and mutagenesis analyses, we have provided a novel model for the spectral tuning mechanism of primate blue pigment, as shown in Fig. 6.
Figure 6.
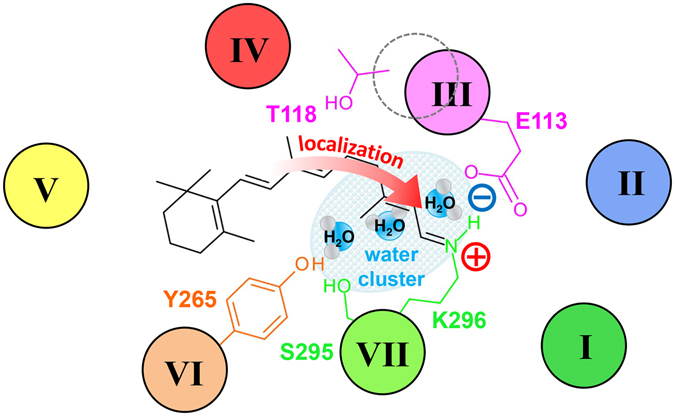
Structural model of the retinal binding pocket in MB that leads to the spectral blue-shift of λmax. MB-specific water cluster is situated in the vicinity of retinal Schiff base using a unique hydrogen bonding network with two key residues: Y265 and E113. Consequently, π-electrons along the polyene chain is highly localized towards the protonated Schiff base, which causes the spectral blue-shift of λmax in MB.
In spectral tuning, the polarity around the retinal β-ionone ring and polyene chain is a key factor, and water molecules also play a role in polarity7. The observed MB-specific water O-D stretching band in the 2500 cm−1 region (Fig. 4) has been assigned to a water cluster that was located in the vicinity of the retinal chromophore. Moreover, this water cluster is localized in between two residues at position 265 and 113 because this water band is affected by both Y265W and E113D mutations. Alternatively, the environment around Thr118 in MB is similar to rhodopsin because of a similar O-H vibrational frequency at 3463 cm−1, which originates from Thr118 that is exhibited in the unphotolized state (Figure S7). Combined with our FTIR observations and the case of spectral blue shift by the Ser295 mutation described in the previous study18, Fig. 6 shows that both the polarity of the hydrophilic amino acid (like Ser295 and water molecules) synergistically reduced π-electron delocalization along the retinal polyene chain, which successfully led to the spectral blue shift of λmax in MB.
It is known that the vibrational HOOP mode of the retinal chromophore generally influences the chromophore distortion40, 41. However, these modes do not influence the wavelength because they monitor local out-of-phase modes that intensify upon retinal geometric distortion19–21. Figure S4a,b show the linear correlation between the C11=C12 HOOP mode frequency and λmax among all pigments, including MB, for both dark and batho-intermediate states. These observations indicate that among π-conjugation systems along the polyene chain of the chromophore, only one double bond at C11 and C12 influences the electronic state of the retinal chromophore. For MB, we observed the C11=C12 HOOP mode for the dark state at 961 cm−1. This frequency and band shape were considerably distinct for all pigments, as shown in Fig. 2. Intriguingly, in Figure S4c, the relationship between the band area of the C11=C12 HOOP mode and λmax for each pigment was linear, which is consistent with the results of their frequency-λmax relationships (Figure S4a,b). Because the band shape generally reflects the vibrational coupling, the C11=C12 HOOP mode in MB appears to be strongly coupled (unlike other pigments), which indicates a geometric planar structure at the C11 and C12 atoms in the dark state. Although our results provide a plausible explanation that one double bond affects the electronic state that leads to vibrational frequency changes, additional studies with experiments and theoretical calculations42 will be required to fully understand the molecular vibrations that cause spectral tuning in cone pigments.
Even if the extent of distortions in unphotolyzed 11-cis-retinal for each pigment is variable (Figs 2 and S4), cis-trans photoisomerization commonly occurs in all pigments (Figure S4d). This can be accomplished by the specific interaction of the retinal chromophore with the protein moiety for all pigments. In fact, peptide-backbone alteration is significantly large in MB after retinal isomerization as compared with other pigments (Fig. 3). Notably, the MB-Y265W mutation led to a significant decrease in amide-I band intensity, such as other pigments. Trp265 is one of three conserved aromatic residues on helix 6 in all class-A GPCRs, and previous solid-state NMR measurements revealed that the interaction between Trp265 and the retinal chromophore stabilizes rhodopsin in the dark state conformation41. Moreover, NMR studies implied that Trp265 is a key residue that triggers the opening motion of helix 6 after the photoisomerization of the retinal chromophore43. Similar tryptophan-chromophore interactions in a similar position on a helix (F-helix) have also been observed in bacterial rhodopsin for both bacteriorhodpsin (bR) and halorhodopsin (hR) possessing functions as a light-driven proton or chloride pumps, respectively44. Moreover, the mutation of Y265W in blue pigment results in a significant spectral red-shift in λmax in the rhodopsin direction18. Therefore, we speculate that the observation of a large helical structural change in MB may originate from perturbations in helix 6 during cis-trans isomerization.
It is known that hydrogen bonding strength of the Schiff base is important for spectral tuning in relation to the electrostatic interaction between the Schiff base and counterion7. In D2O, the Schiff base N-D stretch appears in the 2150–1930 cm−1 region in Figure S8, where the frequency is decreased as the hydrogen bond strengthens11. Recently, our FTIR study successfully identified the Schiff base N-D stretch of MG at 2099 cm−1 using a C15-D-substituted retinal derivative, which showed a slight down-shift upon retinal isomerization16. Importantly, MR had an identical peak pair at the same frequency, and we concluded that the hydrogen bonding strength of the Schiff base of MG and MR was identical. Additionally, the bands at 2013 and 1971 cm−1 were tentatively assigned to N-D stretching vibrations of the retinal Schiff base for rhodopsin from the previous report35. These frequencies are much lower than those of MG and MR, which is consistent with the stronger hydrogen bond of the Schiff base compared with those in MG and MR, and the spectral blue shift in λmax. In the present study, MB shows peaks at 2050–2000 cm−1, which are possibly N-D stretching vibrations. If these peaks originate from the Schiff base N-D stretch, then the hydrogen bonding of the Schiff base in MB is stronger than in MG and MR, but slightly weaker than in MRh. This result suggests that electrostatic interactions in the Schiff base region of MB contributes to spectral blue-shift compared with MG and MR, but is similar to MRh. Then, two important structural aspects: the retinal distortion and the polarity of water molecules around the β-ionone ring and polyene chain, contribute to the ~80 nm blue-shift relative to rhodopsin. Therefore, it will be interesting to identify the Schiff base N-D stretch in MB, which promotes a better understanding of the proposed spectral tuning mechanism.
In conclusion, the presented FTIR study identifies the signals of protein-bound water molecules in MB and elucidates the presence of a water cluster in the vicinity of the retinal chromophore. This water cluster is localized between Tyr265 and Glu113 because their corresponding water signals are affected by their point mutations in MB. Presumably, the observed water molecules near the retina play a role in increasing the polarity, which leads to the characteristic spectral blue shift in λmax of MB. Furthermore, in the HOOP mode region at 1000–800 cm−1 where signal intensity increases upon retinal distortion, the coupled C11=C12 HOOP mode frequency exhibits a linear correlation with λmax among all pigments (including MB) for both unphotolyzed and photolyzed states. This finding suggests that cis-trans photoisomerization commonly occurs in all pigments. However, the retinal geometry in MB possesses the best planar structure as compared with other pigments, as indicated by the spectral sharpness of the C11=C12 HOOP mode in the unphotolyzed state. Interestingly, MB shows large spectral change in the amide-I vibration of the α-helix upon retinal isomerization, which strongly indicates that retinal isomerization is accompanied by large structural changes in α-helices. Presently, we cannot identify the protonated Schiff base N-D stretch, which typically provides information regarding the hydrogen bonding strength of the Schiff base. Furthermore, spectroscopic analysis by extensive mutations and isotope labeling will enable us to understand the retinal-protein interaction involved in our spectral tuning mechanism.
Methods
The cDNA of monkey blue (MB) was tagged using the Rho1D4 epitope sequence and introduced into the expression vector pcDNA3.1. This vector was expressed in the HEK293T cell line and regenerated with 11-cis-retinal14, 15. The regenerated sample was solubilized with a buffer that contained 2% (w/v) n-dodecyl-β-D-maltoside (DDM), 50 mM HEPES, 140 mM NaCl, and 3 mM MgCl2 (pH 6.5) and purified by adsorption on an antibody-conjugated column. Then, the purified sample was eluted with a buffer that contained 0.12 mg/mL 1D4 peptide, 0.02% DDM, 0.004% cholesteryl hemisuccinate (CHS), 50 mM HEPES, 140 mM NaCl, and 3 mM MgCl2 (pH 6.5).
Site-directed mutagenesis was performed using the Quik Change Multisite-Directed Mutagenesis Kit (Agilent Technologies, Inc., Santa Clara, CA, USA)
For the FTIR spectroscopy measurements, MB was reconstituted into phosphatidylcholine (PC) liposomes with a protein-to-lipid molar ratio of 1:30 by dialysis to remove DDM. The reconstituted sample was suspended in a buffer that contained 2 mM phosphate and 10 mM NaCl (pH 7.25), placed onto a BaF2 window and dried with an aspirator. Low-temperature FTIR spectroscopy was applied to the films that were hydrated with H2O, D2O, or D2 18O at 77 K, as previously described10, 45. For the formation of the batho-intermediate state of MB, the samples were irradiated with 400 nm light (using an interference filter) for 5 min. For the reversion of the batho-intermediate state to the dark state, the samples were irradiated with >520 nm light for 5 min. For each measurement, 128 interferograms were collected and 40 recordings were averaged. FTIR spectra were recorded at a 2 cm−1 resolution.
Electronic supplementary material
Supplementary Information for publication
Acknowledgements
We thank Dr. R.S. Molday for providing 293T cell lines and 1D4 antibodies. We also thank Mr. S. Gulati for valuable discussion and helpful comments regarding this manuscript. This work was supported by KAKENHI grants from the Japan Society for the Promotion of Science to K.T. (25891012), H.I. (26117512, 15H05242, 26304008), and H.K. (25104009, 15H02391). Research Fellowships from the Japan Society for the Promotion of Science for Young Scientists to K.K., and the Cooperative Research Program of Primate Research Institute, Kyoto University.
Author Contributions
K.K. and Y.N. designed most of the reported experiments. H.K. provided guidance throughout the investigations. K.K. and H.K. wrote the manuscript. K.K. K.T., H.I. and H.K. advised on the experiments and manuscript preparation. K.K. and Y.N. collected and analyzed the data. All authors discussed the results of the paper.
Competing Interests
The authors declare that they have no competing interests.
Footnotes
Kota Katayama and Yuki Nonaka contributed equally to this work.
Electronic supplementary material
Supplementary information accompanies this paper at doi:10.1038/s41598-017-05177-4
Publisher's note: Springer Nature remains neutral with regard to jurisdictional claims in published maps and institutional affiliations.
References
- 1.Okano T, Kojima D, Fukada Y, Shichida Y, Yoshizawa T. Primary structures of chicken cone visual pigments: vertebrate rhodopsins have evolved out of cone visual pigments. Proc. Natl. Acad. Sci. USA. 1992;89:5932–5936. doi: 10.1073/pnas.89.13.5932. [DOI] [PMC free article] [PubMed] [Google Scholar]
- 2.Shichida Y, Imai H. Visual pigment: G-protein-coupled receptor for light signals. Cell. Mol. Life. Sci. 1998;54:1299–1315. doi: 10.1007/s000180050256. [DOI] [PMC free article] [PubMed] [Google Scholar]
- 3.Hunt MD, Carvalho SL, Cowing AJ, Davies LW. Evolution and spectral tuning of visual pigments in birds and mammals. Philos. Trans. R. Soc. Lond. B. Biol. Sci. 2009;364:2941–2955. doi: 10.1098/rstb.2009.0044. [DOI] [PMC free article] [PubMed] [Google Scholar]
- 4.Wald G. Molecular basis of visual excitation. Science. 1968;162:230–239. doi: 10.1126/science.162.3850.230. [DOI] [PubMed] [Google Scholar]
- 5.Nathans J, Thomas D, Hogness DS. Molecular genetics of human color vision: The genes encoding blue, green and red pigments. Science. 1986;232:193–201. doi: 10.1126/science.2937147. [DOI] [PubMed] [Google Scholar]
- 6.Oprian DD, Asenjo AB, Lee N, Pelletier SL. Design, chemical synthesis, and expression of genes for the three human color vision pigments. Biochemistry. 1991;30:11367–11372. doi: 10.1021/bi00112a002. [DOI] [PubMed] [Google Scholar]
- 7.Ernst OP, et al. Microbial and animal rhodopsins: Structures, functions, and molecular mechanisms. Chem. Rev. 2014;114:126–163. doi: 10.1021/cr4003769. [DOI] [PMC free article] [PubMed] [Google Scholar]
- 8.Katritch V, Cherezov V, Stevens RC. Structure-Function of the G-protein-Coupled Receptor Superfamily. Annu Rev Pharmacol Toxicol. 2013;53:531–556. doi: 10.1146/annurev-pharmtox-032112-135923. [DOI] [PMC free article] [PubMed] [Google Scholar]
- 9.Yuan S, Filipek S, Palczewski K, Vogel H. Activation of G-protein-coupled receptors correlates with the formation of a continuous internal water pathway. Nat. Commun. 2014;5:1–10. doi: 10.1038/ncomms5733. [DOI] [PubMed] [Google Scholar]
- 10.Kandori H, Maeda A. FTIR spectroscopy reveals microscopic changes of the protein around the rhodopsin chromophore upon photoisomerization. Biochemistry. 1995;34:14220–14229. doi: 10.1021/bi00043a029. [DOI] [PubMed] [Google Scholar]
- 11.Kandori H. Role of internal water molecules in bacteriorhodopsin. Biochim. Biophys. Acta. 2000;1460:177–191. doi: 10.1016/S0005-2728(00)00138-9. [DOI] [PubMed] [Google Scholar]
- 12.Rothschild KJ, Cantore WA, Marrero H. Fourier transform infrared difference spectra of intermediatesin rhodopsin bleaching. Science. 1983;219:1333–1335. doi: 10.1126/science.6828860. [DOI] [PubMed] [Google Scholar]
- 13.Rath P, Delange F, Degrip WJ, Rothschild KJ. Hydrogen bonding changes of internal water molecules in rhodopsin during metarhodopsin I and metarhodopsin II formation. Biochem J. 1998;329(Pt 3):713–717. doi: 10.1042/bj3290713. [DOI] [PMC free article] [PubMed] [Google Scholar]
- 14.Katayama K, Furutani Y, Imai H, Kandori H. An FTIR study of monkey green- and red-sensitive visual pigments. Angew. Chem. Int. Ed. 2010;49:891–894. doi: 10.1002/anie.200903837. [DOI] [PubMed] [Google Scholar]
- 15.Katayama K, Furutani Y, Imai H, Kandori H. Protein-bound water molecules in primate red- and green-sensitive visual pigments. Biochemistry. 2012;51:1126–1133. doi: 10.1021/bi201676y. [DOI] [PubMed] [Google Scholar]
- 16.Katayama K, Okitsu T, Imai H, Wada A, Kandori H. Identical Hydrogen-Bonding Strength of the Retinal Schiff Base between Primate Green- and Red-Sensitive Pigments: New Insight into Color Tuning Mechanism. J. Phys. Chem. Lett. 2015;6:1130–1133. doi: 10.1021/acs.jpclett.5b00291. [DOI] [PubMed] [Google Scholar]
- 17.Lin SW, et al. Mechanisms of spectral tuning in blue cone visual pigments. Visible and raman spectroscopy of blue-shifted rhodopsin mutants. J. Biol. Chem. 1998;273:24583–24591. doi: 10.1074/jbc.273.38.24583. [DOI] [PubMed] [Google Scholar]
- 18.Fasick JI, Lee N, Oprian DD. Spectral tuning in the human blue cone pigment. Biochemistry. 1999;38:11593–11596. doi: 10.1021/bi991600h. [DOI] [PubMed] [Google Scholar]
- 19.Eyring G, Curry B, Broek A, Lugtenburg J, Mathies R. Assignment and interpretation of hydrogen out-of-plane vibrations in the resonance Raman spectra of rhodopsin and bathorhodopsin. Biochemistry. 1982;21:384–393. doi: 10.1021/bi00531a028. [DOI] [PubMed] [Google Scholar]
- 20.Palings I, van den Berg EM, Lugtenburg J, Mathies RA. Complete assignment of the hydrogen out-of-plane wagging vibrations of bathorhodopsin: chromophore structure and energy storage in the primary photoproduct of vision. Biochemistry. 1989;28:1498–1507. doi: 10.1021/bi00430a012. [DOI] [PubMed] [Google Scholar]
- 21.Yan EC, et al. Resonance Raman analysis of the mechanism of energy storage and chromophore distortion in the primary visual photoproduct. Biochemistry. 2004;43:10867–10876. doi: 10.1021/bi0400148. [DOI] [PMC free article] [PubMed] [Google Scholar]
- 22.Palczewski K, et al. Crystal structure of rhodopsin: A G protein-coupled receptor. Science. 2000;289:739–745. doi: 10.1126/science.289.5480.739. [DOI] [PubMed] [Google Scholar]
- 23.Nakamichi H, Okada T. Crystallographic Analysis of Primary Visual Photochemistry. Angew. Chem. Int. Ed. 2006;118:4376–4379. doi: 10.1002/ange.200600595. [DOI] [PubMed] [Google Scholar]
- 24.Lin SW, Sakmar TP, Frank RR, Khorana HG, Mathies RA. Resonance Raman microprobe spectroscopy of rhodopsin mutants: Effect of substitutions in the third transmembrane helix. Biochemistry. 1992;31:5105–5111. doi: 10.1021/bi00137a003. [DOI] [PubMed] [Google Scholar]
- 25.Schoenlein RW, Peteanu LA, Mathies RA, Shank CV. The first step in vision: femtosecond isomerization of rhodopsin. Science. 1991;254:412–415. doi: 10.1126/science.1925597. [DOI] [PubMed] [Google Scholar]
- 26.Hurley JB, Ebrey TG, Honig B, Ottolenghi M. Temperature and wavelength effects on the photochemistry of rhodopsin, isorhodopsin, bacteriorhodopsin and their photoproducts. Nature. 1977;270:540–542. doi: 10.1038/270540a0. [DOI] [PubMed] [Google Scholar]
- 27.Kukura P, et al. Structural observation of the primary isomerization in vision with femtosecond-stimulated Raman. Science. 2005;310:1006–1009. doi: 10.1126/science.1118379. [DOI] [PubMed] [Google Scholar]
- 28.Makino CL, Taylor WR, Baylor DA. Rapid charge movements and photosensitivity of visual pigments in salamander rods and cones. J. Physiol. 1991;42:761–780. doi: 10.1113/jphysiol.1991.sp018818. [DOI] [PMC free article] [PubMed] [Google Scholar]
- 29.Venyaminov YS, Kalnin NN. Quantitative IR spectrophotometry of peptide compounds in water (H2O) solutions. II. Amide absorption bands of polypeptides and fibrous proteins in a-, b-, and random coil conformations. Biopolymers. 1990;30:1259–1271. doi: 10.1002/bip.360301310. [DOI] [PubMed] [Google Scholar]
- 30.Deupi X, Kobilka BK. Energy landscapes as a tool to integrate GPCR structure, dynamics, and function. Physiology (Bethesda) 2010;25:293–303. doi: 10.1152/physiol.00002.2010. [DOI] [PMC free article] [PubMed] [Google Scholar]
- 31.Li J. Inelastic neutron scattering studies of hydrogen bonding in ices. J. Chem. Phys. 1996;105:6733–6755. doi: 10.1063/1.472525. [DOI] [Google Scholar]
- 32.Liu H, Wang Y, Bowman JM. Vibrational analysis of a ice Ih model from 0 to 4000 cm−1 using the Ab initio WHBB potential energy surface. J. Phys. Chem. B. 2013;117:10046–10052. doi: 10.1021/jp405865c. [DOI] [PubMed] [Google Scholar]
- 33.Frähmcke JS, Wanko M, Elstner M. Building a model of the blue cone pigment based on the wild type rhodopsin structure with QM/MM methods. J. Phys. Chem. B. 2012;116:3313–3321. doi: 10.1021/jp2086472. [DOI] [PubMed] [Google Scholar]
- 34.Okada T, et al. Functional role of internal water molecules in rhodopsin revealed by X-ray crystallography. Proc. Natl. Acad. Sci. USA. 2002;99:5982–5987. doi: 10.1073/pnas.082666399. [DOI] [PMC free article] [PubMed] [Google Scholar]
- 35.Furutani Y, Shichida Y, Kandori H. Structural changes of water molecules during the photoactivation processes in bovine rhodopsin. Biochemistry. 2003;42:9619–9625. doi: 10.1021/bi034592k. [DOI] [PubMed] [Google Scholar]
- 36.Nagata T, Oura T, Terakita A, Kandori H, Shichida Y. Isomer-specific interaction of the retinal chromophore with threonine-118 in rhodopsin. J. Phys. Chem. A. 2002;106:1969–1975. doi: 10.1021/jp0124488. [DOI] [Google Scholar]
- 37.Hunt MD, Carvalho SL, Cowing AJ, Davies LW. Evolution and spectral tuning of visual pigments in birds and mammals. Philos. Trans. R. Soc. Lond. B. Biol. Sci. 2009;364:2941–2955. doi: 10.1098/rstb.2009.0044. [DOI] [PMC free article] [PubMed] [Google Scholar]
- 38.Lórenz-Fonfría VA, Furutani Y, Ota T, Ido K, Kandori H. Protein fluctuations as the possible origin of the thermal activation of rod photoreceptors in the dark. J. Am. Chem. Soc. 2010;132:5693–5703. doi: 10.1021/ja907756e. [DOI] [PubMed] [Google Scholar]
- 39.Ramon E, Mao X, Ridge KD. Studies on the stability of the human cone visual pigments. Photochem. Photobiol. 2009;85:509–516. doi: 10.1111/j.1751-1097.2008.00504.x. [DOI] [PubMed] [Google Scholar]
- 40.Schapiro I, et al. The ultrafast photoisomerizations of rhodopsin and bathorhodopsin are modulated by bond length alteration and HOOP driven electronic effects. J. Am. Chem. Soc. 2011;133:3354–3364. doi: 10.1021/ja1056196. [DOI] [PubMed] [Google Scholar]
- 41.Lin SW, et al. Vibrational assignment of torsional normal modes of rhodopsin: Probing excited-state isomerization dynamics along the reactive C11=C12 torsion coordinate. J. Phys. Chem. B. 1998;102:2787–2806. doi: 10.1021/jp972752u. [DOI] [Google Scholar]
- 42.Sekharan S, Katayama K, Kandori H, Morokuma K. Color vision:”OH-site” rule for seeking red and green. J. Am. Chem. Soc. 2012;134:10706–10712. doi: 10.1021/ja304820p. [DOI] [PMC free article] [PubMed] [Google Scholar]
- 43.Crocker E, et al. Location of trp265 in metarhodopsin II: Implications for the activaton mechanism of the visual receptor rhodopsin. J. Mol. Biol. 2006;357:163–172. doi: 10.1016/j.jmb.2005.12.046. [DOI] [PubMed] [Google Scholar]
- 44.Rothschild KJ, Braiman MS, Mogi T, Stern LJ, Khorana HG. Conserved amino acids in F-helix of bacteriorhodopsin form part of a retinal binding pocket. FEBS Lett. 1989;250:448–452. doi: 10.1016/0014-5793(89)80774-4. [DOI] [PubMed] [Google Scholar]
- 45.Kandori H, Belenky M, Herzfeld J. Vibrational frequency and dipolar orientation of the protonated Schiff base in bacteriorhodopsin before and after photoisomerization. Biochemistry. 2002;41:6026–6031. doi: 10.1021/bi025585j. [DOI] [PubMed] [Google Scholar]
Associated Data
This section collects any data citations, data availability statements, or supplementary materials included in this article.
Supplementary Materials
Supplementary Information for publication