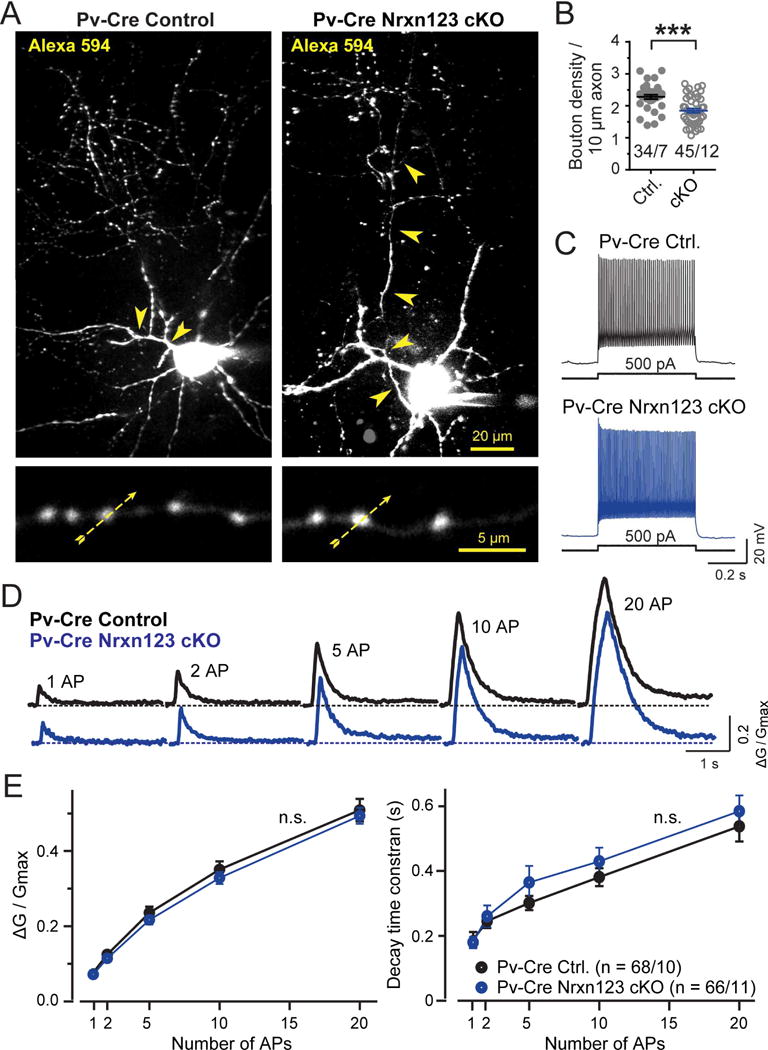
Figure 5. Two-photon microscopy reveals that Pv-Cre mediated pan-neurexin deletion in Pv+ interneurons does not alter action potential-induced Ca2+-influx into presynaptic terminals, but decreases the density of presynaptic axonal boutons.

(A) Pv+ interneurons visualized by Alexa Fluor 594 fluorescence in Pv-Cre control and in Pv-Cre Nrxn123 cKO mice. Neurons identified via virally administered double-floxed mCherry were filled via the patch pipette with Alexa Fluor 594 (50 μM; to visualize the axonal arbor and dendrites) and Fluo-5F (200 μM; to monitor presynaptic Ca2+-transients). The top image depicts a representative z-stack projection of the entire neuron (arrowheads = axon). The bottom image displays an expanded view of axonal boutons (yellow dashed arrows = line scans during action potential stimulation).
(B) Decreased density of axonal boutons of neurexin-deficient Pv+ interneurons (circles, individual axon branches; lines, means ± SEM).
(C) Representative traces depicting the fast-spiking firing pattern of Pv+ interneurons in Pv-Cre and Pv-Cre Nrxn123 cKO interneurons.
(D) Representative traces of Ca2+-transients monitored via Fluo-5F fluorescence in presynaptic boutons by line scans as indicated in A. Trains of action potentials (1, 2, 5,10, 20 APs at 50 Hz) were elicited by injecting current pulses (2 nA, 1 ms) via the recording pipettes.
(E) Summary plots of the peak amplitudes (ΔG/Gmax, left) and decay times (measured from 100% to 37% of peak amplitude, right) of Ca2+-transients as a function of action potential number monitored in presynaptic boutons of Pv+ interneurons.
Data in B and E are means ± SEM (numbers indicate number of axon branches/neurons analyzed [B] or boutons/neurons analyzed [E]); statistical comparisons were performed with Student’s t-test (*P<0.05; **P<0.01; ***P<0.001); non-significant comparisons are not labeled.
