Abstract
Recently, polymeric micelles self-assembled from amphiphilic polymers have been studied for various industrial and biomedical applications. This nanoparticle self-assembly typically occurs in a solvent-exchange process. In this process, the quality of the resulting particles is uncontrollably mediated by polymeric solubility and mixing conditions. Here, we hypothesized that improving the solubility of an amphiphilic polymer in an organic solvent via chemical modification while controlling the mixing rate of organic and aqueous phases would enhance control over particle morphology and size. We examined this hypothesis by synthesizing a poly(2-hydroxyethyl)aspartamide (PHEA) grafted with controlled numbers of octadecyl (C18) chains and oligovaline groups (termed “oligovaline-PHEA-C18”). The mixing rate of DMF and water was controlled either by microfluidic mixing of laminar DMF and water flows or through turbulent bulk mixing. Interestingly, oligovaline-PHEA-C18 exhibited an increased solubility in DMF compared with PHEA-C18, as demonstrated by an increase of mixing energy. In addition, with micelle-forming oligovaline-PHEA-C18, increasing the mixing rate between water and DMF using the microfluidic mixer resulted in a decrease of the diameter of the resulting polymeric micelles, as compared with the particles formed from a bulk mixing process. Overall, these findings will expand the parameter space available to control particle self-assembly while also serving to improve existing nanoparticle processing techniques.
Graphical abstract
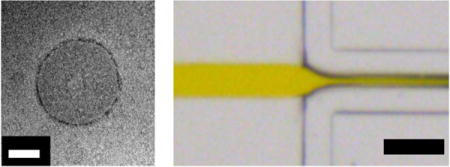
Polymeric micelle self-assembly can be controlled by modulating amphiphilic polymer solubility and mixing conditions.
Introduction
In the past 50 years, nano-sized micelles have been studied as carriers of various molecules for cosmetic, medical, and agricultural products.1–4 These nanocarriers are noted for their structural stability, and can help retain the activity of multifactorial compounds.5 Polymers can be chemically modified to tailor degradation rate and mechanism (e.g., enzymatic digestion, optical trigger) and subsequent molecular release rate.6,7 In addition, the nanoparticle surface can be chemically or physically engineered to present a desired number and type of molecules for the targeted delivery of molecular cargos.8,9
Polymeric micelles are typically formed by the self-assembly of amphiphilic polymers during a solvent exchange process where amphiphilic polymers are first dissolved in an organic solvent and subsequently introduced into an aqueous phase.10–12 These polymers are typically synthesized by connecting a series of water-soluble polymers such as poly(ethylene glycol),13 hyaluronic acid,14 poly(2-hydroxyethyl methacrylate),15 or polypeptides16 with hydrophobic segments to create an amphiphilic block copolymer or graft copolymer. In aqueous media, amphiphilic polymers associate to form micelles, depending on the ratio of hydrophobic and hydrophilic domains in the polymer.17,18
Recently, microfluidic platforms have been considered for various nanofabrication strategies, as these devices can mix small volumes (~nL-μL) of aqueous and organic phases at controlled rates.19–21 Microfluidic systems have been utilized previously to produce highly monodisperse populations of liposomes,22 quantum dots,23 and emulsions.24 In particular, microfluidic platforms that rapidly mix solutions via hydrodynamic flow focusing, where a central organic solvent-polymer stream is sheathed by adjacent aqueous streams, have been utilized to synthesize polymeric nanoparticles, such as nano-precipitated particles consisting of diblock copolymers.25
Additionally, microfluidic devices possess the potential to finely control a given set of reaction or process parameters, in turn reducing batch-to-batch variability.26 However, there is increasing evidence that the quality of microfluidic nanoparticle assembly relies on the solubility of amphiphilic molecules in the organic phase.
With a bulk or microfluidic solvent exchange process, selection of an appropriate organic solvent is vital to: (1) ensure complete dissolution of the amphiphilic polymers and (2) retain functionality of molecular cargos. Meeting both requirements severely limits the types of polymers used as a building block for micelles and also requires efforts to seek or synthesize a good solvent via trial-and-error.27 Another potentially important factor for solvent exchange is the balanced mixing of amphiphilic polymer, organic phase, and aqueous phase. For instance, amphiphilic polymers with an increased fraction of hydrophobic domains can rapidly precipitate as aggregates during the solvent exchange process prior to nanoparticle assembly. However, to date, few efforts have systematically examined and resolved these potential challenges in particle assembly.
This study therefore demonstrates the significant role of amphiphilic polymer mixing conditions in regulating polymeric micelle assembly via combined chemical modification of amphiphilic polymers and mechanical control of the solvent exchange process. We hypothesized that chemical modification of an amphiphilic polymer to thermodynamically improve its solubility in a given organic phase is advantageous to form nanoparticles with desired morphology and size. In addition, the microfluidic solvent exchange rate regulated by the volumetric flow rate ratio (termed FRR) between organic and aqueous phases would further mediate the self-assembly of amphiphilic polymers.
We examined this hypothesis by using a poly(2-hydroxyethyl)aspartamide (PHEA) polymer substituted with a controlled number of octadecyl chains (C18) as a model amphiphilic polymer. The degree of substitution of C18 (DSC18) was varied to create a polymeric micelle. We modified the alkylated PHEA with a controlled number of oligovaline chains to control the solubility of the polymer in an organic solvent such as dimethylformamide (DMF). The solvent exchange rate was modulated by introducing the PHEA polymers dissolved in DMF into an aqueous phase either by dropwise addition, termed off-chip or bulk mixing, or flow focusing in a microfluidic mixer, termed microfluidic or on-chip mixing, at different volumetric flow rate ratios between DMF and water (Figure 1).
Figure 1.
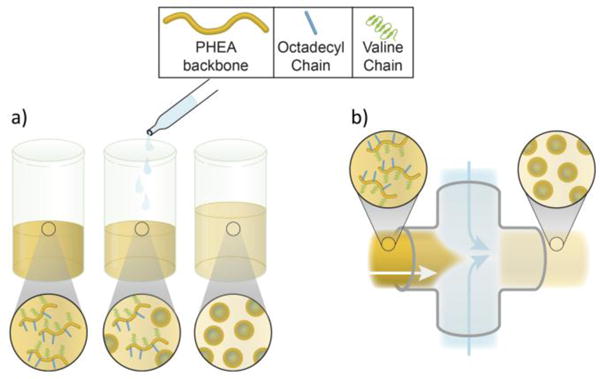
Schematic depicting (a) off-chip and (b) microfluidic/on-chip mixing to prepare PHEA nanoparticles.
The critical role of oligovaline in improving polymer solubility was examined via a thermodynamic analysis. The role of oligovaline in nanoparticle formation was evaluated by quantifying the energy of mixing via computational simulation and experimentation. The microfluidic mixing process was also examined via finite element model-based simulation and microscopic visualization of flow patterns. The morphology and size of the resulting nanoparticles were evaluated with electron microscopy and atomic force microscopy (AFM). Micelle stability was further analysed via dynamic light scattering (DLS). Overall, this study serves to improve nanoparticle fabrication processes by expanding the parameter space available for controlled self-assembly.
Results and Discussion
Synthesis of Oligovaline-PHEA-C18
First, polysuccinimide (PSI) with an average molecular weight of 19,000 g/mol was prepared by the acid-catalysed polycondensation of aspartic acid (NMR spectrum for PSI in Figure S1).28 Then, a controlled number of octadecyl (C18) chains was conjugated to the PSI via the ring-opening nucleophilic addition of octadecylamine (Step 1 in Figure 2). Successful conjugation of the C18 chain was confirmed with the peak at 0.85 ppm on the 1H NMR spectrum (Figure S2). The remaining PSI rings were then substituted with ethanolamine and ethylenediamine (Steps 2 and 3 in Figure 2). To quantify the degree of substitution of the C18 chain, eqn 1 was used.29
| (1) |
Figure 2.
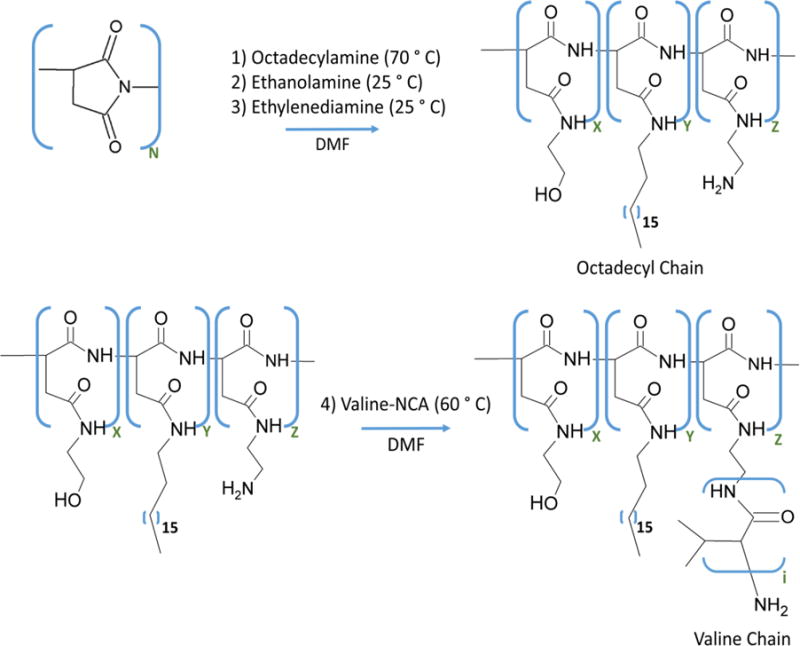
Schematic depicting the synthesis of polyaspartamide substituted with octadecyl and oligovaline groups (termed “Oligovaline-PHEA-C18”). The molar ratio of x, y, and z monomers is determined by changing the mass of octadecylamine, ethanolamine, and ethylenediamine added in Steps 1, 2, and 3, respectively. Note the distribution of x, y, and z in the polymer chain is random.
Note that 3 corresponds to the number of hydrogen atoms per octadecyl chain. According to the 1H NMR spectrum of the PSI substituted with C18, ethanolamine, and ethylenediamine (referred to as NH2-PHEA-C18), reacting octadecylamine and PSI at a mass ratio of 0.28 resulted in DSC18 of approximately 20 % (eqn 1).
Separately, valine-n-carboxyanhydride (valine-NCA; structure and NMR spectrum in Figure S3 and S4, respectively) was prepared from the Fuchs-Farthing reaction.30 In this reaction, L-valine underwent ring-closure in the presence of triphosgene, resulting in valine-NCA.31,32 Valine-NCA reacted with the primary amines of NH2-PHEA-C18, in turn opening the ring on valine-NCA. Thus, the amine served as an initiator for the polymerization of the valine groups, and an oligovaline chain was subsequently formed on NH2-PHEA-C18 (Step 4 in Figure 2).33 The presence of oligovaline chains grafted to the PHEA-C18 was confirmed by the distinctive 1H-NMR peaks at approximately 1 ppm.34 To quantify the number ratio of valine units to PHEA units, eqn 2 was used.
| (2) |
Note that 6 corresponds to the number of protons in the isopropyl group per valine group.
The number ratio of oligovaline chains to PHEA units was approximately 1:100 for the oligovaline-PHEA-C18 with a DSC18 of 20%. With a quantified value for DSC18, the hydrophilic mass fraction (f) of the PHEA polymer with DSC18 of 20% was approximated according to the following equation:
| (3) |
Note that valine, an additional hydrophobic group,35 is neglected from this calculation due to the low number ratio of valine groups to PHEA groups. At DSC18 of 20%, the f of oligovaline-PHEA-C18 was around 0.6. Previous theoretical and experimental studies have indicated that an amphiphilic polymer with an f smaller than 0.35–0.40 self-assembles to form a polymeric vesicle.36,37 Above this range, spherical or cylindrical micelles are typically formed. Therefore, we predicted that oligovaline-PHEA-C18 with DSC18 of 20% would form a micelle.
Solubility Analysis of Oligovaline-PHEA-C18 in DMF
We then evaluated the solubility of the synthesized amphiphilic PHEA molecules in DMF. Polymer solubility in the organic phase is a key consideration for solvent exchange, as the process involves the transitioning of the amphiphilic polymer from a region of high solubility to a region of low solubility. The information gathered in this study will also be useful for the design of other polymer systems as well. Note that some common organic solvents, such as chloroform or hexane, were not considered because the organic solvent used for self-assembly must be miscible in water in order to enable solvent exchange.
The PHEA substituted only with C18 chains and amine groups, termed NH2-PHEA-C18, formed a cloudy, insoluble dispersion in DMF (Figure 3a-i). The addition of the oligovaline chain to NH2-PHEA-C18 dramatically improved solubility of the polymer in DMF. At a DSC18 of 20%, a clear yellow-brown solution was made at 30 mg/mL (Figure 3a-ii). According to measurements of polymer solubility at 0° C, NH2-PHEA-C18 (DSC18 =20 %) had a maximal solubility of only 7 mg/mL, while oligovaline-PHEA-C18 (DSC18 =20%) had a maximal solubility of around 44 mg/mL.
Figure 3.
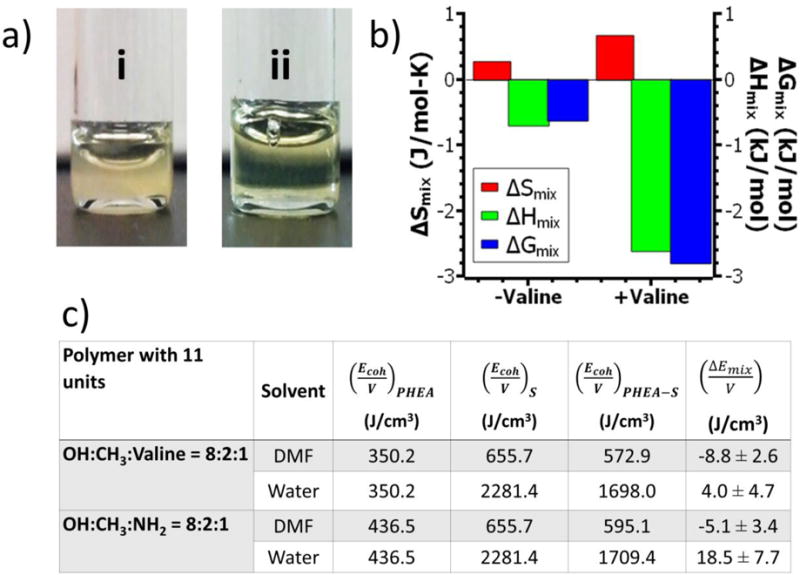
Effects of oligovaline on the solubility of PHEA in DMF. (a) Images of PHEA polymers dissolved in DMF at 30 mg/mL: (i) NH2-PHEA-C18 (DSC18 =20%); (ii) Oligovaline-PHEA-C18 (DSC18 =20%). (b) Changes in Gibb’s free energy of mixing (ΔGmix; blue), the heat of mixing (ΔHmix; green), and the entropy of mixing (ΔSmix; red) for oligovaline-PHEA-C18 (DSC18=20%; termed “+valine”) and NH2-PHEA-C18 (DSC18=20%; “-valine”). All values represent the average of values obtained at three different temperatures (−20, 0, or 25 °C). (c) The computational simulated energy of mixing per unit volume for the oligovaline-PHEA-C18 and the NH2-PHEA-C18 with 11 units dissolved in DMF or water at 30 vol%.
In aqueous conditions, oligovaline-PHEA-C18 (DSC18 =20%) has a critical micelle concentration (CMC) of 5.5 μg/mL (Figure S5). This CMC value is comparable to similar amphiphilic polyaspartamide polymers, further suggesting that this polymer should form micelles under different mixing conditions.8
To examine the underlying mechanism by which the oligovaline group improved the solubility of NH2-PHEA-C18, the thermodynamic properties related to solvation were quantified. Based on the mass of polymers dissolved in DMF at a given temperature, the Gibbs free energy change during mixing (ΔGmix) was calculated using the following equation:
| (4) |
Whereby R is the gas constant (8.314 J/mol-K), and T is temperature (K). Keq is defined as:
| (5) |
For the temperatures considered, ΔGmix for oligovaline-PHEA-C18 was more negative than ΔGmix for NH2-PHEA-C18 (Figure 3b). This trend suggests that the solvation of oligovaline-PHEA-C18 in DMF was more thermodynamically favourable than that of NH2-PHEA-C18 in DMF.
Separately, using the Flory-Huggins solution theory, the entropy of mixing (ΔSmix) was calculated based on the volume fraction of the oligovaline-PHEA-C18 or NH2-PHEA-C18 dissolved in DMF:
| (6) |
whereby φ1 is the volume fraction of DMF, φ2 is the volume fraction of PHEA-based polymer, and N2 is the degree of polymerization of PHEA (approximated as 190).38 Both oligovaline-PHEA-C18 and NH2-PHEA-C18 have a positive entropy of mixing, suggesting a higher amount of disorder is generated as the polymer goes into solution. Interestingly, ΔSmix for oligovaline-PHEA-C18 was approximately 3-fold larger than ΔSmix for NH2-PHEA-C18 (Figure 3b). This increase in ΔSmix is likely due to the higher total fraction of PHEA polymer solubilized for oligovaline-PHEA-C18 than that for NH2-PHEA-C18. The enthalpy of mixing (ΔHmix) was approximated based on ΔGmix (eqn 4) and ΔSmix (eqn 7):
| (7) |
According to the calculation, the negative ΔHmix was approximately 3-fold higher than ΔHmix for NH2-PHEA-C18 (Figure 3b). This increase in the enthalpy of mixing is likely due to the changes in intermolecular interactions between PHEA polymer and DMF that occur when the oligovaline chain is conjugated onto the polymer backbone.
Molecular Simulation of Oligovaline-PHEA-C18 and NH2-PHEA-C18 Solubility
To further examine the role of the oligovaline groups on polymer solubility, the energy of mixing per unit volume (ΔEmix/V) of the model PHEA polymer with 11 repeating units was computationally calculated as follows.39
| (8) |
Here, and are volume fraction of the PHEA-based polymer and solvent (i.e., DMF or water), respectively. , and are the cohesive energy density values of pure PHEA, solvent, and PHEA in the solvent, respectively. For all polymers including oligovaline-PHEA-C18 and NH2-PHEA-C18, the negative energy of mixing indicates that DMF is a better solvent than water (Figure 3c). Also, oligovaline-PHEA-C18 exhibited a more negative energy of mixing, thus indicating a higher solubility in DMF and, furthermore, confirming the results obtained experimentally. While the scope of the MD simulation was limited to a polymer with 11 repeating units for ease of computation (molecular structure in Figure S6), the computational results suggested that the oligovaline chain plays an important role in increasing the solubility of PHEA in DMF.
We propose that this improved solubility of the oligovaline-PHEA-C18 is due to enhanced intermolecular association between the polymer and DMF. The amide groups of the oligovaline chains coupled to the NH2-PHEA-C18 likely formed hydrogen bonds with DMF, a hydrogen bond acceptor (Figure 4). Thus, the oligovaline groups coupled to PHEA increased the number of hydrogen bonds between polymers and DMF, thus improving solubility.40 Without this additional hydrogen bonding, van der Waals interactions between the octadecyl chains drove polymer-polymer association, resulting in insoluble aggregates.41
Figure 4.
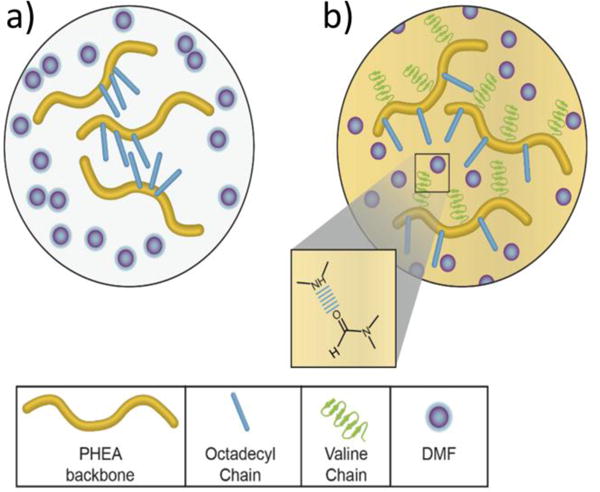
Proposed mechanism for the solubility changes that occur upon the conjugation of the oligovaline chains to NH2-PHEA-C18. (a) Without the oligovaline chains, the PHEA polymer associates with itself, yielding insoluble aggregates. (b) By conjugating oligovaline chains to NH2-PHEA-C18, additional sites for hydrogen bonding with DMF are present in the polymer, thus improving its solubility in DMF. The dashed blue line (see inset) indicates the presence of hydrogen bonding between secondary amines on the valine chain and DMF.
At higher DSC18 values (e.g., 40%) and lower DSC18 (e.g., 0%), the addition of an oligovaline chain results in high PHEA solubility in DMF (Figure S7 and Table S1), suggesting that this chemistry has additional utility for future polymer systems. The observed polymer solubility for a library of different polyaspartamide polymers is reported in Table S1. Taken together, these broad improvements in polymer solubility suggest that the presence of oligovaline chains can increase the solubility of different PHEA molecules in organic solvents.
Determining Mixing Efficiency of the Microfluidic Mixer
Separately, a PDMS microfluidic mixer was prepared, with a port for an aqueous phase (marked with A in Figure 5) and a port for the DMF phase containing amphiphilic PHEA polymers (D in Figure 5). The DMF solution and the aqueous phase were mixed at different ratios starting at the flow focusing junction (zoomed-in region depicted in Figure 5c). Here, the volumetric flow rate of the aqueous phase to the volumetric flow rate of the DMF phase was denoted as the flow rate ratio (FRR). The mixed solution then travelled through a straight channel followed by a curved channel to a single outlet (marked with O in Figure 5a) where the PHEA-DMF-water mixture was collected. All experiments and computational on-chip studies examined FRR at 5, 10, and 20, with a constant total volumetric flow rate of 140 μL/min.
Figure 5.
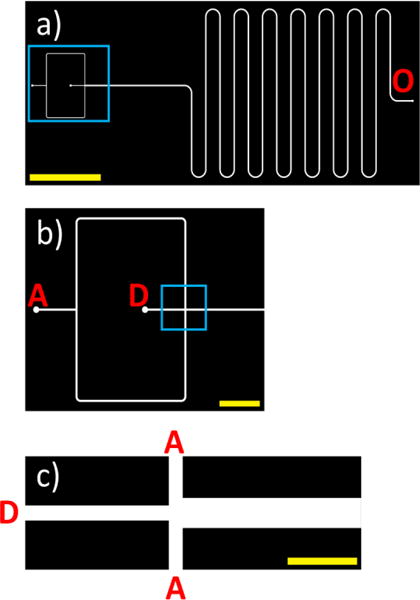
(a) CAD image of the entire microfluidic mixer design. “O” corresponds to the outlet for the mixed DMF/water streams. A region of interest (depicted in b) is denoted with a blue box. The yellow scale bar corresponds to 1 cm. (b) Zoomed-in image of the inlets of the chip. “D” corresponds to the inlet stream for DMF with dissolved polymer, and “A” corresponds to the inlet stream for the aqueous media. A region of interest (termed flow focusing region; depicted in c) is denoted with a blue box. Yellow scale bar corresponds to 2 mm. (c) Zoomed-in image of the flow focusing region. The yellow scale bar corresponds to 0.5 mm.
CFD Simulations to Evaluate Microfluidic Mixing
Experimentally quantifying diffusive mixing of flow focusing systems with two different solvents is particularly challenging due to changes in fluid viscosity, diffusion coefficient, and fluid velocity profile as a function of channel length.42 Therefore, CFD simulations were conducted to qualitatively examine the mixing of DMF and water in the microfluidic device. One key parameter that determines the mixing conditions on-chip is FRR, which directly impacts the diameter of the central focused stream and therefore affects diffusion rate (i.e., thinner focused streams mix faster). Here, we performed 2-D CFD simulations of three different FRRs (5, 10, and 20) utilizing a shorter version of the microfluidic platform, but with identical channel widths. The CFD simulation was run using the Naviér-Stokes equation (eqns S1 and S2) and the convective-diffusion equation (eqn s3). For all FRR values, the Reynold’s number (eqn s4) was constant at around 14, thus indicating that all microfluidic mixing will be done in a laminar region. In contrast, the Reynold’s number for off-chip mixing (eqn s5) is over 3,000, suggesting a mostly turbulent mixing regime.43
CFD simulations indicate the central focused stream narrowed slightly as FRR increased (Figure 6a). Thinner organic streams lead to more rapid solvent exchange, thus suggesting a faster mixing rate. In addition, the role of FRR on the mixing of DMF and water was experimentally examined by using DMF mixed with a colorant. As FRR increased from 5 to 10 and 20, the initial diameter of the DMF stream in the aqueous phase became increasingly smaller, as determined with brightfield images (Figure 6b). For FRR-5, the DMF stream diameter was 50 μm. At FRR-10 and FRR-20, the DMF stream diameter reduced to 36 and 29 μm, respectively.
Figure 6.
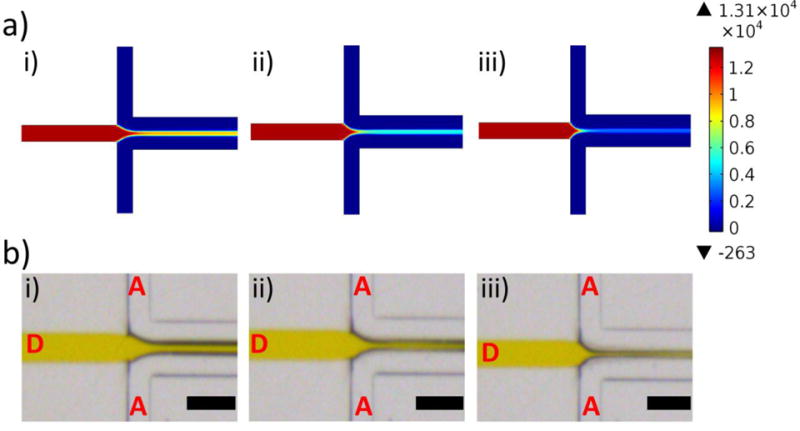
Computational and experimental determination of flow conditions on-chip. (a) CFD-generated concentration profiles depicting DMF and water concentrations on-chip. The colour legend indicates DMF concentration (mol/m3), red corresponds to a high DMF concentration, and blue corresponds to a low DMF concentration. CFD simulations were run for FRR-5 (i), FRR-10 (ii), and FRR-20 (iii). (b) Brightfield microscope images of the chip in operation. A yellow food colorant was used to distinguish the DMF stream (labelled “D”) from the aqueous stream (labelled “A”). The flow rate ratio (FRR) varies from 5 (i) to 10 (ii) and 20 (iii). The black scale bar corresponds to 200 μm.
Based on the computational and experimental quantification of mixing conditions on-chip, the mixing rate of DMF with water is slowest for FRR-5, as determined by the thickness of the organic stream in water. Similarly, the DMF concentration past the flow focusing region was noticeably higher when compared to similar regions in the FRR-10 and FRR-20 conditions (Figure 6a). Based on these observations, it is likely that the high DMF concentration (13% by volume when fully mixed in water) at FRR-5 potentially leads to a heterogeneous micelle population. Therefore, on-chip mixing was performed only at FRR-10 and FRR-20, whereby the final DMF concentration is 10% by volume or less in a fully-mixed condition. We anticipated that micelle self-assembly would occur under more homogenous solvent conditions if the final DMF concentration is within this range, in turn leading to a monodisperse population of micelles.
Polymeric Micelle Assembly
PHEA solutions were injected into the microfluidic chip at different FRR values while keeping total volumetric flow rate constant. In particular, DMF dissolved with the oligovaline-PHEA-C18 with DSC18 of 20% was mixed with the aqueous phase at FRR of 10 and 20. Separately, the aqueous phase was introduced into the DMF-polymer solution dropwise in order to prepare micelles via off-chip precipitation. Independent of FRR and particle assembly process, oligovaline-PHEA-C18 formed a micelle, as confirmed with TEM images (Figure 7).
Figure 7.
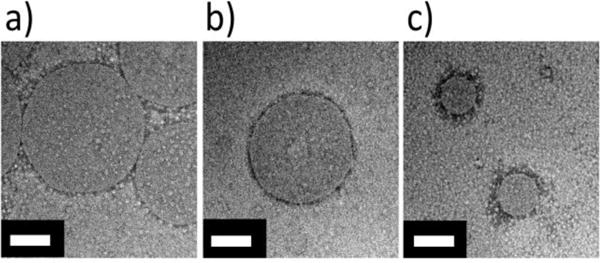
TEM images of PHEA micelles. Oligovaline-PHEA-C18 (DSC18=20%) micelles formed with off-chip mixing (a), with microfluidic mixer at FRR-10 (b), and with microfluidic mixer at FRR-20 (c). The white scale bars represent 100 nm. Additional TEM images are available for reference in Figure S9.
Interestingly, the average diameter of the micelles prepared with the microfluidic mixer ranged from 100 to 200 nm, while the average diameter of the micelles prepared with the off-chip precipitation was around 300±130 nm. More interestingly, as FRR increased from 10 to 20, the micelle diameter decreased from 190±60 nm to 100±40 nm (Figure 8). In addition, solutions of oligovaline-PHEA free of C18 chains and solutions of NH2-PHEA-C18 did not form micelles with off-chip mixing (Figure S8a and S8b), suggesting that both a high degree of hydrophobicity (from the octadecyl chains) and a high solubility in the organic solvent (from the oligovaline group) is necessary for self-assembly in a DMF/water solvent exchange.
Figure 8.
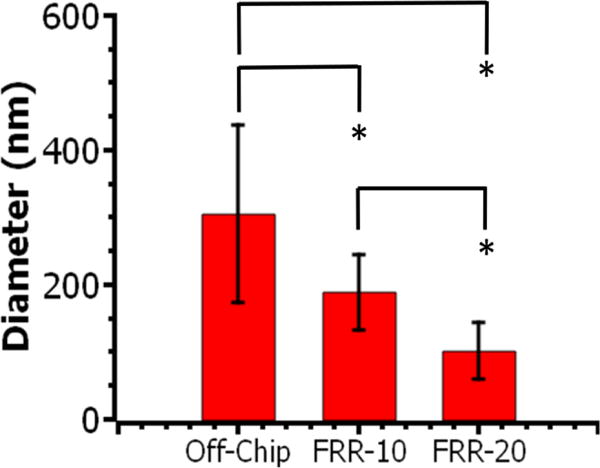
Diameter of oligovaline-PHEA-C18 (DSC18 = 20%) micelles quantified with TEM images. At least 15 particles were analysed per condition. * represents the statistical significance of the difference between conditions (*p < 0.05). Values and bars correspond to averages and standard deviation of one set of size measurements, respectively.
These differences in micelle sizes can be explained by comparing the rate at which DMF and water mix with the rate at which polymer chains self-assemble to form a micelle. As confirmed with computational simulations and experimental visualizations, an increase in FRR increases the mixing rate of DMF and water. It is therefore likely that the C18 chains of oligovaline-PHEA-C18 should be driven to self-associate to form the micelle core more quickly at the higher FRR, thus resulting in the micelles with a smaller diameter.44 This trend was confirmed with micelle images captured with scanning electron microscopy and atomic force microscopy (Figure S10 and S11). Note that AFM captures the particles in a hydrate state while SEM and TEM image the particles in a dried state. Therefore, the micelles imaged with electron microscopic images likely collapsed and subsequently expanded on the solid support by the high vacuum pressure, thus making the nanoparticles appear slightly larger.
Lastly, the long-term stability of the micelles was analysed using dynamic light scattering (DLS) (Figure S12). Interestingly, the micelles prepared at FRR-10 underwent a decrease in hydrodynamic diameter within a day. Then, the particle size remained constant over a week. The micelles prepared at FRR-20 exhibited a minimal change in size over 1 week. This change in micelle stability can be understood by considering the kinetics of microfluidic mixing.
In the microfluidic system, the polymer transitions from a good solvent condition (i.e., DMF) to a poor solvent condition (i.e., water) and self-assembles into a micelle. This process takes place at different rates based on the FRR, and it is likely that the microfluidic mixing process kinetically traps micelles at different non-equilibrium states.45 The micelles would then slowly transition to an equilibrium state over the course of several days. This journey to equilibrium is likely reflected in the Figure S10, as the micelles prepared at FRR-10 and FRR-20 converge to the same (equilibrium) size over several days. It may be possible to permanently trap the micelles at a non-equilibrium state (i.e., the day 0 size) by covalently crosslinking the hydrophobic domains in the micelle, similar to previously reported protocols.46
Conclusions
In conclusion, tuning of the solubility of the amphiphilic polymers in an organic phase and use of a laminar flow-based microfluidic mixing process enables regulating the size of polymeric micelles. The oligovaline groups conjugated to the NH2-PHEA-C18 contributed to thermodynamically improving the solubility of the polymer in DMF, likely due to increased hydrogen bonds between polymer and DMF. Moreover, the microfluidic mixer enabled us to mix laminar streams of DMF and water at controlled rates. Subsequently, increasing the mixing rate in the microfluidic mixer decreased the size of micelles formed by the oligovaline-PHEA-C18 with DSC18 of 20%. Eventually, the micelles would transition to a size around 80 nm, based on a long-term DLS study. We envision that additional modifications to oligovaline-PHEA-C18 can help improve long-term micelle stability.
This study demonstrates the importance of polymer solubility in microfluidic-based solvent exchange process. Although several studies examined the role of microfluidic mixing on nanoparticle assembly, the importance of polymer solubility in controlling particle morphology and size was not addressed. The approach we articulated herein will widen the parameter space used for nanoparticle self-assembly.
Experimental
All chemicals were purchased from Sigma-Aldrich and used without purification, unless otherwise noted. Unless noted, all water was high-pressure liquid chromatography (HPLC) grade water (Macron).
Synthesis of NH2-PHEA-C18
First, 291 mg of polysuccinimide (termed PSI; synthesis details in Supporting Information) was dissolved in DMF (ACS grade) at a concentration of 20–25 mg/mL. Then, 81 or 162 mg of octadecylamine was added to the reaction mixture to form PHEA-C18 with a degree of substitution of octadecyl chains (DSC18) of 20%. After reaction for at least 12 hours under nitrogen at 70 ° C, the reaction mixture was cooled to room temperature. Then, 161 μL (for DSC18 of 20%) of ethanolamine was added dropwise and then reacted for another 24 h. Afterward, a dilute solution of excess ethylenediamine was prepared in dry DMF. Then, the reaction mixture was slowly added to the ethylenediamine solution over several minutes. For this step of the reaction, the molar ratio of ethylenediamine to unreacted PSI rings was at least 5:1. After reacting for 3 hours at room temperature, the reaction mixture was dialyzed for at least 2 days against DI water (MWCO 12,000–14,000, Fisherbrand), frozen, and then lyophilized to form a dry powder (Labconco).
Synthesis of Oligovaline-PHEA-C18
First, 165 mg of NH2-PHEA-C18 with DSC18 of 20% was separately dissolved in 3 mL DMF, and then slowly heated to 60 ° C. In parallel, 29 mg of valine-N-carboxyanhydride (valine-NCA; synthesis details and structure in Supporting Information) were dissolved in 1 mL of DMF. This solution was then added dropwise to the mixture of NH2-PHEA-C18 with DSC18 of 20%. After reacting at 60 ° C for at least 24 h under nitrogen, the reaction mixture was dialyzed (MWCO 3,500, Fisherbrand) against DI water for at least 2 days, while changing water at least three times. The sample was then frozen and lyophilized to form a dry powder (Labconco).
NMR Analysis of PSI, Valine-NCA, and Oligovaline-PHEA-C18
All polymers were dissolved in dimethyl sulfoxide-d6 (Cambridge Isotope Laboratory) at a concentration of at least 10 mg/mL, and then loaded into an NMR tube (Varian VXR 500). To improve the height of the analyte peaks, solvent saturation was used as needed. All scans were done at 35 ° C, and at least 15–20 scans were taken per sample. All spectra were processed with ACDLABS 12.0 software.
Measurement of Critical Micelle Concentration
Oligovaline-PHEA-C18 was dispersed in water at a range of concentrations from 0 to 1 mg/mL. At least 3 mL of each polymer dispersion was prepared in a glass vial. Then, 30 μL of a pyrene solution in acetone was added to each vial (final concentration: 6.16×10⁻⁷ M). Acetone was evaporated overnight in a fume hood. The polymer solution was excited from 300 to 360 nm, and the emission wavelength was collected at 395 nm. Both the emission and excitation bandwidths were set to 2.5 nm in order to obtain a smooth curve. An intensity ratio at two separate peaks (337 nm and 334 nm) in the excitation spectra (defined as I337 nm/I334 nm) was plotted versus polymer concentration and then fitted to two separate linear curves. When pyrene is placed in a hydrophobic environment, this intensity ratio increases. The critical micelle concentration (CMC) was defined as the inflection point in the resulting curve, as previously reported.8
Molecule Dynamics Simulation of PHEA Solubility
Molecular dynamics (MD) simulations were employed to study the effect of the oligovaline chains on the solubility of NH2-PHEA-C18 and oligovaline-PHEA-C18. All computational calculations were performed using Materials Studio simulation software (version 8.0) from BIOVIA equipped with COMPASS II force field.47 Coulomb interactions were calculated using Ewald summation, and van der Waals interactions were determined using an atom-based summation method (15.5 Å cut-off distance). Two model polymers with 11 units were examined, with side chain compositions of (i) hydroxyethyl:C18:aminoethyl = 8:2:1 (for NH2-PHEA-C18), and (ii) hydroxyethyl:C18:oligovaline = 8:2:1 (for oligovaline-PHEA-C18) (Figure S1). The cohesive energy densities of pure polymers, solvents (DMF or water), and polymers in solvents were obtained through the MD simulation to ultimately calculate the energy of mixing per unit volume. A polymer concentration of 30 vol% was selected. Each model polymer was first optimized using Forcite module, and the optimized structure was packed into a lattice typically ca. (50 Å)3 (density 1 g/cm3) using the Amorphous Cell module. Once the lattice was energetically minimized, MD method was implemented for 100 ps with 1 fs time step. The NVT ensemble (Nosé thermostat) was used at 298 K (Q ratio: 0.01).48 The initial 50 ps was for equilibration, and the later 50 ps was for data sampling at 10 ps interval. MD calculations were similarly performed for pure solvents and polymers with 11 units (30vol%) in solvents. Each case was simulated at least three times starting from independent initial structures, and the lowest energy result was chosen for the sampling of five structures. The reported values of cohesive energy density and the energy of mixing per unit volume were the average from five sampled structures.
Determination of Maximal Solubility of PHEA
Information on the labelling of PHEA polymers with fluorescein isothiocyanate (FITC) is included in Supporting Information. Oligovaline-PHEA-C18 and NH2-PHEA-C18 labelled with FITC were dissolved in DMF at varying concentrations ranging from 0 to 250 μg/mL. Then, a linear calibration curve was established for each polymer functionalized with FITC by measuring polymer concentration versus the fluorescence intensity at 485 nm (Tecan Infinite 200 PRO plate reader; gain set to 50). To determine the maximal solubility of oligovaline-PHEA-C18 and NH2-PHEA-C18, a mass of polymer (5–15 mg) was placed in a clean glass scintillation vial, and then dissolved at a given concentration (50 mg/mL for oligovaline-PHEA-C18, or 15 mg/mL for NH2-PHEA-C18). Then, the vial was mechanically agitated briefly, then incubated for 1 h at −20, 0, or 25 °C. After incubation, the polymer solution was separated from the insoluble polymer with centrifugation (two minutes at 10,000 rcf; Eppendorf centrifuge 5424). The mass of insoluble polymer was then dissolved in a large volume of DMF overnight at room temperature in the dark, and the fluorescent intensity of the resulting solution was then taken at 485 nm. The concentration of soluble and insoluble polymer was then back-calculated using the established calibration curve and a mass balance equation.
COMSOL Simulation of Microfluidic Flow Conditions
Two-dimensional computational fluid dynamics (CFD) simulations of flow focusing experiments were performed on COMSOL Multiphysics software (v5.1). Details are described in the Supporting Information.
Preparation of PHEA Nanoparticles Using the Microfluidic Mixer
Oligovaline-PHEA-C18 (DSC18 of 20%) was dissolved in DMF at a concentration of 30 mg/mL. A 1 mL glass syringe containing 300 μL of the PHEA polymer solution was loaded onto a microliter syringe pump (Harvard Apparatus). Separately, a syringe charged with 10 mL of phosphate buffered saline (PBS, Corning Cellgro) was loaded onto a millilitre syringe pump (Harvard Apparatus). For both solutions, care was taken to remove air bubbles. Prior to use, microfluidic chips were flushed with isopropanol and then PBS at a flow rate of 30 μL/min to remove any air pockets. Then, PBS and oligovaline-PHEA-C18 in DMF were pumped through the chip at the following flow rates: 117 μL of PBS/min: 23 μL of DMF solution/min (FRR-5); 127μL of PBS/min:12.7 μL of DMF solution/min (FRR-10); 133 μL of PBS/min:7 μL of DMF solution/min (FRR-20). The outlet from the tube was collected in a centrifuge tube. Afterwards, the nanoparticles were washed twice in a 0.5 mL centrifugal filter (100,000 MWCO; Amicon Millipore) at 1,500 rcf for at least 10 minutes (Eppendorf centrifuge 5424), and each time re-dispersed in water. In order to visualize the mixing conditions on-chip, the experiments described above were repeated, but with DMF containing an orange-red food colorant (McCormick). All images were captured with a light microscope (Leica M205 C).
Off-Chip Preparation of PHEA Nanoparticles
Separately, 100 μL of oligovaline-PHEA-C18 solution was added into a 7 mL scintillation glass vial, and then stirred with a magnetic stir bar (12.7 mm diameter) at 1,000 rpm on a stirring plate. Then, 1 mL of PBS was added in a drop-wise fashion to the PHEA solution over the course of approximately 15 to 30 seconds. The resulting particles were then washed in the same manner as the particles prepared on the microfluidic mixer.
TEM Imaging of PHEA Nanoparticles
PHEA nanoparticles were suspended in water at 0.75–1.5 mg/mL. Separately, a 20 mg/mL solution of phosphotungstic acid (PTA) was prepared and the pH was adjusted to a neutral range (6–8) with concentrated NaOH. Then, the PTA solution and the particle dispersions were mixed in a 1:1 volumetric ratio. Approximately 10 μL of this solution was quickly added to a 200 mesh carbon TEM grid (EMS) on top of a filter paper, and then dried in air for about 20 minutes before imaging. Images were captured (JEOL 2100) at 200 kV, with multiple images taken on at least three different sections of each grid. All images were analysed in ImageJ (NIH). Approximately 13 to 20 nanoparticles were analysed per condition. To analyse the diameter of the oligovaline-PHEA-C18 micelle, a straight line was drawn across the micelle image and then measured.
Nanoparticle Stability Test Using Dynamic Light Scattering (DLS)
Micelle size was analysed using a Zetasizer Nano ZS (Malvern Instrument Ltd.) equipped with a He–Ne laser beam at 633 nm (scattering angle: 173°) over 7 days. The concentration of the micelles was 0.75 mg/mL. Each sample was measured three times, and an average micelle size was obtained.
Statistical Analysis of Data
Statistical significance between all conditions was compared using a one-way ANOVA test with a post-hoc Tukey’s test (R Studio 3.2.2).
Supplementary Material
Acknowledgments
Transmission electron microscopy and dynamic light scattering was carried out in part in the Frederick Seitz Materials Research Laboratory Central Facilities, University of Illinois. Work was funded by the National Institutes of Health (1R01 HL109192 to H.J.K) and partially by Korea Institute of Industrial Technology (JE 140004 to H.K.). N.C. was supported by a Dow Graduate Fellowship and a DuPont Graduate Fellowship.
Footnotes
Electronic Supplementary Information (ESI) available: Additional information on synthesis of valine-NCA and polysuccinimide. Additional details on image analysis, CFD simulations, and chip preparation. Supplemental TEM images and NMR spectra. AFM and SEM images. See DOI: 10.1039/x0xx00000x
The manuscript was written with the contributions of all authors. N.C. and H.K. designed the experiments, analyzed data, and developed the major conclusions. J.W., V.K., J.S., and P.K. provided microfluidic designs, chips, and expertise. J.C., J.H., and J.L optimized polymer synthesis. I.K. and I.C. helped run computational simulations. D.K. provided insights during manuscript preparation. E.L. and Z.J.Z. assisted with AFM measurements.
Notes and references
- 1.Taborga L, Díaz K, Olea AF, Reyes-Bravo P, Flores ME, Peña-Cortés H, Espinoza L. J Agric Food Chem. 2015;63:6890–6896. doi: 10.1021/acs.jafc.5b01920. [DOI] [PubMed] [Google Scholar]
- 2.Xu X, Ni X, Cao Y, Zhuo X, Yang X, Cao G. Electrophoresis. 2014;35:827–835. doi: 10.1002/elps.201300336. [DOI] [PubMed] [Google Scholar]
- 3.Spagnuolo PA, Dalgleish DG, Goff HD, Morris ER. Food Hydrocolloids. 2005;19:371–377. [Google Scholar]
- 4.Levine DH, Ghoroghchian PP, Freudenberg J, Zhang G, Therien MJ, Greene MI, Hammer DA, Murali R. Methods. 2008;46:25–32. doi: 10.1016/j.ymeth.2008.05.006. [DOI] [PMC free article] [PubMed] [Google Scholar]
- 5.Jones MC, Leroux JC. Eur J Pharm Biopharm. 1999;48:101–111. doi: 10.1016/s0939-6411(99)00039-9. [DOI] [PubMed] [Google Scholar]
- 6.Shao Y, Shi C, Xu G, Guo D, Luo J. ACS Appl Mater Interfaces. 2014;6:10381–10392. doi: 10.1021/am501913m. [DOI] [PMC free article] [PubMed] [Google Scholar]
- 7.Kulkarni PS, Haldar MK, Nahire RR, Katti P, Ambre AH, Muhonen WW, Shabb JB, Padi SKR, Singh RK, Borowicz PP, Shrivastava DK, Katti KS, Reindl K, Guo B, Mallik S. Mol Pharmaceutics. 2014;11:2390–2399. doi: 10.1021/mp500108p. [DOI] [PMC free article] [PubMed] [Google Scholar]
- 8.Lai MH, Clay NE, Kim DH, Kong H. Nanoscale. 2015;7:6737–6744. doi: 10.1039/c5nr00736d. [DOI] [PMC free article] [PubMed] [Google Scholar]
- 9.Meng F, Engbers GHM, Feijen J. J Controlled Release. 2005;101:187–198. doi: 10.1016/j.jconrel.2004.09.026. [DOI] [PubMed] [Google Scholar]
- 10.Vijayakrishna K, Mecerreyes D, Gnanou Y, Taton D. Macromolecules. 2009;42:5167–5174. [Google Scholar]
- 11.Houga C, Giermanska J, Lecommandoux S, Borsali R, Taton D, Gnanou Y, Le Meins JF. Biomacromolecules. 2009;10:32–40. doi: 10.1021/bm800778n. [DOI] [PubMed] [Google Scholar]
- 12.Marsden HR, Gabrielli L, Kros A. Polym Chem. 2010;1:1512–1518. [Google Scholar]
- 13.Ahmed F, Discher DE. J Controlled Release. 2004;96:37–53. doi: 10.1016/j.jconrel.2003.12.021. [DOI] [PubMed] [Google Scholar]
- 14.Saadat E, Amini M, Dinarvand R, Dorkoosh FA. J Appl Polym Sci. 2014;131:40944. [Google Scholar]
- 15.Johnson RP, Jeong YI, Choi E, Chung CW, Kang DH, Oh SO, Suh H, Kim I. Adv Funct Mater. 2012;22:1058–1068. [Google Scholar]
- 16.Zhao L, Li N, Wang K, Shi C, Zhang L, Luan Y. Biomaterials. 2014;35:1284–1301. doi: 10.1016/j.biomaterials.2013.10.063. [DOI] [PubMed] [Google Scholar]
- 17.Nagarajan R. Langmuir. 2002;18:31–38. [Google Scholar]
- 18.Maibaum L, Dinner AR, Chandler D. J Phys Chem B. 2004;108:6778–6781. [Google Scholar]
- 19.Lee CY, Chang CL, Wang YN, Fu LM. Int J Mol Sci. 2011;12:3263–3287. doi: 10.3390/ijms12053263. [DOI] [PMC free article] [PubMed] [Google Scholar]
- 20.Stachowiak JC, Richmond DL, Li TH, Liu AP, Parekh SH, Fletcher DA. Proc Natl Acad Sci USA. 2008;105:4697–4702. doi: 10.1073/pnas.0710875105. [DOI] [PMC free article] [PubMed] [Google Scholar]
- 21.Whitesides GM. Nature. 2006;442:368–373. doi: 10.1038/nature05058. [DOI] [PubMed] [Google Scholar]
- 22.Phapal SM, Sunthar P. Chem Phys Lipids. 2013;172–173:20–30. doi: 10.1016/j.chemphyslip.2013.04.006. [DOI] [PubMed] [Google Scholar]
- 23.Tian ZH, Xu JH, Wang YJ, Luo GS. Chem Eng J. 2016;285:20–26. [Google Scholar]
- 24.Shah RK, Shum HC, Rowat AC, Lee D, Agresti JJ, Utada AS, Chu LY, Kim JW, Fernandez-Nieves A, Martinez CJ, Weitz DA. Mater Today. 2008;11:18–27. [Google Scholar]
- 25.Karnik R, Gu F, Basto P, Cannizzaro C, Dean L, Kyei-Manu W, Langer R, Farokhzad OC. Nano Lett. 2008;8:2906–2912. doi: 10.1021/nl801736q. [DOI] [PubMed] [Google Scholar]
- 26.Phillips TW, Lignos IG, Maceiczyk RM, deMello AJ, deMello JC. Lab Chip. 2014;14:3172. doi: 10.1039/c4lc00429a. [DOI] [PubMed] [Google Scholar]
- 27.Lu Y, Park K. Int J Pharm. 2013;453:198–214. doi: 10.1016/j.ijpharm.2012.08.042. [DOI] [PMC free article] [PubMed] [Google Scholar]
- 28.Tomida M, Nakato T, Kuramochi M, Shibata M, Matsunami S, Kakuchi T. Polymer. 1996;37:4435–4437. [Google Scholar]
- 29.Lai MH, Jeong JH, DeVolder RJ, Brockman C, Schroeder C, Kong H. Adv Funct Mater. 2012;22:3239–3246. doi: 10.1002/adfm.201102664. [DOI] [PMC free article] [PubMed] [Google Scholar]
- 30.Daly WH, Poché D. Tetrahedron Lett. 1988;29:5859–5862. [Google Scholar]
- 31.Christian DA, Cai S, Bowen DM, Kim Y, Pajerowski JD, Discher DE. Eur J Pharm Biopharm. 2009;71:463–474. doi: 10.1016/j.ejpb.2008.09.025. [DOI] [PMC free article] [PubMed] [Google Scholar]
- 32.Wibowo SH, Sulistio A, Wong EHH, Blencowe A, Qiao GG. Aust J Chem. 2014;67:598–602. [Google Scholar]
- 33.Wibowo SH, Sulistio A, Wong EHH, Blencowe A, Qiao GG. Chem Commun (Cambridge, UK) 2014;50:4971. doi: 10.1039/c4cc00293h. [DOI] [PubMed] [Google Scholar]
- 34.Senn H, Werner B, Messerle BA, Weber C, Traber R, Wüthrich K. FEBS Lett. 1989;249:113–118. [Google Scholar]
- 35.Dalhus B, Görbitz CH, Kofod P, Larsen E, Nielsen B, Nielsen RI, Olsen CE, Rosendahl CN, Haugg M, Trabesinger-Rüf N, Weinhold EG. Acta Chem Scand. 1996;50:544–548. [Google Scholar]
- 36.Geng Y, Discher DE. J Am Chem Soc. 2005;127:12780–12781. doi: 10.1021/ja053902e. [DOI] [PMC free article] [PubMed] [Google Scholar]
- 37.Rameez S, Bamba I, Palmer AF. Langmuir. 2010;26:5279–5285. doi: 10.1021/la9036343. [DOI] [PMC free article] [PubMed] [Google Scholar]
- 38.Flory PJ. J Chem Phys. 1942;10:51–61. [Google Scholar]
- 39.Jawalkar SS, Raju KVSN, Halligudi SB, Sairam M, Aminabhavi TM. J Phys Chem B. 2007;111:2431–2439. doi: 10.1021/jp0668495. [DOI] [PubMed] [Google Scholar]
- 40.Zhang C, Liu B, Wang X, Wang H, Zhang H. J Chem Eng Data. 2014;59:2732–2740. [Google Scholar]
- 41.Xiao X, Hu J, Charych DH, Salmeron M. Langmuir. 1996;12:235–237. [Google Scholar]
- 42.Capretto L, Carugo D, Cheng W, Hill M, Zhang X. J Colloid Interface Sci. 2011;357:243–251. doi: 10.1016/j.jcis.2011.01.085. [DOI] [PubMed] [Google Scholar]
- 43.Schultz MP, Finlay JA, Callow ME, Callow JA. Biofouling. 2000;15:243–251. [Google Scholar]
- 44.Johnson BK, Prud’homme RK. Phys Rev Lett. 2003;91:118302. doi: 10.1103/PhysRevLett.91.118302. [DOI] [PubMed] [Google Scholar]
- 45.Santos JL, Herrera-Alonso M. Macromolecules. 2014;47:137–145. [Google Scholar]
- 46.Lai MH, Lee S, Smith CE, Kim K, Kong H. ACS Appl Mater Interfaces. 2014;6:10821–10829. doi: 10.1021/am502822n. [DOI] [PMC free article] [PubMed] [Google Scholar]
- 47.Sun H. J Phys Chem B. 1998;102:7338–7364. [Google Scholar]
- 48.Nosé S. J Chem Phys. 1984;81:511–519. [Google Scholar]
Associated Data
This section collects any data citations, data availability statements, or supplementary materials included in this article.


