

Abstract
Phylostratigraphy, originally designed for gene age estimation by BLAST-based protein homology searches of sequenced genomes, has been widely used for studying patterns and inferring mechanisms of gene origination and evolution. We previously showed by computer simulation that phylostratigraphy underestimates gene age for a nonnegligible fraction of genes and that the underestimation is severer for genes with certain properties such as fast evolution and short protein sequences. Consequently, many previously reported age distributions of gene properties may have been methodological artifacts rather than biological realities. Domazet-Lošo and colleagues recently argued that our simulations were flawed and that phylostratigraphic bias does not impact inferences about gene emergence and evolution. Here we discuss conceptual difficulties of phylostratigraphy, identify numerous problems in Domazet-Lošo et al.’s argument, reconfirm phylostratigraphic error using simulations suggested by Domazet-Lošo and colleagues, and demonstrate that a phylostratigraphic trend claimed to be robust to error disappears when genes likely to be error-resistant are analyzed. We conclude that extreme caution is needed in interpreting phylostratigraphic results because of the inherent biases of the method and that reanalysis using genes exhibiting no error in realistic simulations may help reduce spurious findings.
Keywords: computer simulation, disease genes, BLAST, false negatives, de novo gene origination
Introduction
Phylostratigraphy was originally designed as a method for estimating gene ages via homology detection programs, most commonly the BLAST suite of algorithms (Domazet-Lošo et al. 2007). Once homologs of a gene are identified in various species, the gene is said to be as old as the most recent common ancestor of all species in which a homolog is found. Phylostratigraphy is often applied to all genes in a genome, followed by tests for correlations between the estimated age of a gene and various properties of the gene, such as whether it is a known disease-associated gene (Domazet-Lošo and Tautz 2008), its evolutionary rate (Albà and Castresana 2005), and its expression level and patterns (Domazet-Lošo et al. 2007; Carvunis et al. 2012). Such correlations are commonly used in studying patterns and mechanisms of gene origination and evolution (Toll-Riera et al. 2009; Domazet-Lošo and Tautz 2010a, 2010b; Neme and Tautz 2013; Sestak et al. 2013; Sestak and Domazet-Lošo 2014).
The BLAST algorithm (Altschul et al. 1990; Camacho et al. 2009) dictates that homologs are not always correctly identified (Elhaik et al. 2006; Albà and Castresana 2007), because BLAST is designed to detect DNA or protein sequence similarity rather than homology, but homology does not always mean detectable similarity. Specifically, homologs with large sequence divergences may be missed by BLAST. In these cases, a failure to detect homologs reflects the limit of resolution of the BLAST algorithm rather than biological reality. We call this BLAST error or phylostratigraphic error. How such false negative errors impact phylostratigraphy-based inferences of gene origination and evolution is an important subject. We previously addressed this question through the simulation of protein sequence evolution using relevant parameters estimated from extant sequences (Moyers and Zhang 2015, 2016). We simulated all genes to be equally old and hence no genuine correlation existed between gene age and any gene property. We used BLAST to estimate gene ages of the simulated proteins and correlated the estimated gene ages with various gene properties. We demonstrated not only that gene age estimation error was more common than previously believed, but that several previously reported biological trends for genes of different estimated ages are partially or wholly attributable to homology detection error (Moyers and Zhang 2015, 2016).
Recently, a collaboration of researchers, many of whom were authors of the criticized studies, rebutted our work (Domazet-Lošo et al. 2017). The rebuttal claimed that 1) using real sequences as starting sequences, real evolutionary rates, and real among-site rate heterogeneity patterns in simulation is circular, and will by necessity recreate empirical phylostratigraphic trends; 2) associating gene features which are not simulated is inappropriate and circular, and will reproduce known phylostratigraphic trends; 3) homology detection error is virtually nonexistent in some contexts, and if trends are confirmed in these contexts, they must be real; 4) some parameters used in prior simulations, particularly those of the covarion model, are unrealistic; and 5) even in spite of all of these objections, when error-prone genes are removed from phylostratigraphic studies, the results remain unchanged. By clarifying the logic and purpose of simulation studies in general and our prior simulations in particular, conducting new simulations suggested by Domazet-Lošo et al., reassessing a phylostratigraphic observation claimed to be robust to error, and commenting on the theoretical basis of phylostratigraphy laid out by Domazet-Lošo and colleagues, we demonstrate that none of the five claims is valid and that the problems of phylostratigraphy as previously discovered remain. We call for further studies in this area to rectify these problems and discuss potential future directions.
Materials and Methods
Randomization of Parameters for Simulation
We simulated human proteins in three different ways. First, we simulated the sequences as described in Moyers and Zhang (2015), with human sequences used as the ancestral sequences to initiate evolution. Second, we shuffled all amino acids in a human sequence and used the shuffled sequence as the ancestral sequence to initiate evolution; the evolutionary rates of individual amino acid positions, however, are unshuffled. Third, we locked the relationship between an amino acid and its evolutionary rate in a human sequence, and then shuffled all amino acids in the sequence along with their rates to generate the ancestral sequence to initiate evolution. These second and third simulations were performed at the suggestion of Domazet-Lošo et al. (2017), who believe that such simulations are less circular and hence are more trustable.
Simulation of Sequence Evolution
Data used to initiate simulations were from Moyers and Zhang (2015, 2016) unless otherwise mentioned. Simulation procedures followed Moyers and Zhang (2015, 2016), with the exception of randomizing parameters as described earlier. Briefly, we simulated through an evolutionary guide tree based on the divergence times estimated in TimeTree (Hedges et al. 2006), as shown in Moyers and Zhang (2015). We simulated evolution using ROSE (Stoye et al. 1998), which allows the evolutionary rate for each site to be specified by the user. Additionally, following Albà and Castresana (2007), we set an insertion and deletion (indel) threshold to 0.0001. For each branch in the simulation, the expected number of insertion attempts and the expected number of deletion attempts both equal the expected number of amino acid substitutions for that branch times 0.0001. A random location along the protein is chosen to place an indel. If the amino acid substitution rate at the random location is greater than the average substitution rate for the protein, the indel occurs; otherwise, the indel does not occur. A proposed indel length between 1 and 14 amino acids is decided based on a predetermined probability function. We set the probability at 0.1 for any length between 1 and 6 amino acids and 0.05 for any length between 7 and 14 amino acids, following our original methodology. In the case of a deletion, only those sites with amino acid substitution rates higher than the average for the protein will be deleted, with the occurrence of a site with a lower-than-average rate truncating the deletion. In the case of an insertion, all new sites are set to have amino acid substitution rates equal to the average substitution rate of the protein. For each protein, we simulated its evolution using a JTT-f matrix with observed amino acid frequencies from the alignment (Jones et al. 1992). We calculated the mean evolutionary rate of a protein by the number of substitutions per site per MY between human and mouse. Based on TimeTree (Hedges et al. 2006), these species diverged ∼92 Ma. The sequence provided as the start sequence for evolution was the human sequence, unless otherwise mentioned. The simulation of sequence evolution was performed 9 times for each protein.
BLASTP Detection of Homologs
We downloaded BLASTP (version 2.2.28+) from NCBI (ftp://ftp.ncbi.nlm.nih.gov/blast/executables/blast+/2.2.28/; last accessed June 21, 2017), For each run, we used the simulation-generated human database consisting of 5,217 protein sequences as query and performed BLASTP searches against the simulation-generated sequence database consisting of all other species for that run. We used an E-value cutoff of 1E-3 unless otherwise mentioned. All BLAST hits were stored, whether or not they represented a true homolog. We then dated each gene to the most recent common ancestor of the query species and all taxa in which a hit was found. This represented the “age” of the protein for that run.
Reanalysis of Empirical Data
The disease status and estimated ages of human genes were acquired from Domazet-Lošo and Tautz (2008), while yeast data were obtained from Carvunis et al. (2012). For the human data, we identified genes which were 1) able to be simulated in Moyers and Zhang (2015) and 2) found to be error-resistant (i.e., simulated age correctly inferred by phylostratigraphy of simulated sequences). We classified genes into either error-resistant based on the above two criteria, or the complementary set of these genes. After classifying genes in this manner, we estimated the proportion of genes at each phylostratigraphic age determined by Domazet-Lošo and Tautz (2008) in each subset (or the full data set) that were associated with disease.
For the yeast data, we first identified those genes for which 1) parameters could be estimated (i.e., had five sensu stricto Saccharomyces homologs), and 2) estimated phylostratigraphic ages of simulated proteins had no error (Moyers and Zhang 2016). We also classified these genes into subsets in the same manner as for the human genes. Once this was done, we determined in each subset of genes (or in all genes) correlation between ages as determined by Carvunis et al. (2012) and various gene properties provided by the same authors. In these analyses, we universally excluded age group 0, because no phylostratigraphy was actually performed on these genes in the original analysis.
Results
Simulating Random Sequence Evolution
The first two criticisms by Domazet-Lošo et al. concerned the way our simulations were conducted. The first is the suggestion that it is inappropriate to use extant sequences and extant sequence features in performing simulations. Domazet-Lošo et al. wrote, “In their simulations, Moyers and Zhang started with real sequences—rather than in silico generated random sequences—and let them evolve randomly according to rate parameters inferred from real alignments among closely related species. Hence, the true features of these sequences are inherently still implied in the model, i.e., the same sequences that are short or fast-evolving in reality are also short or fast-evolving in the simulations.” In our view, this criticism reflects their failure in understanding the logic of our simulation. In our simulation, all genes were artificially created in the common ancestor of bacteria and eukaryotes. Thus, when a simulated gene was inferred by phylostratigraphy to have a younger age, it must have been a phylostratigraphic error. Furthermore, all genes had the same age in our simulation such that any significant correlation between a gene property and estimated gene age must have been caused by phylostratigraphic bias. These inferences do not depend on whether the sequences used to initiate the simulation are real or random, nor do they depend on whether a genuine phylostratigraphic trend exists in actual data or not. For example, even if young genes truly tend to evolve rapidly, evolutionary rate and estimated gene age should still be uncorrelated in our simulation if phylostratigraphy is unbiased, because that is the truth in our simulation. Using real protein sequences instead of random sequences to initiate the simulation of evolution should make the simulation more realistic and simulation results biologically more relevant. It is inconsistent that some of the same authors previously complained that Elhaik et al.’s (2006) simulation on phylostratigraphy was unrealistic because they neglected among-site variation in evolutionary rate that is common in proteins (Albà and Castresana 2007), but they now criticize our simulation for being too realistic.
Despite that Domazet-Lošo et al.’s criticism is theoretically untenable, we followed their suggestion to perform a new simulation of human gene evolution (Moyers and Zhang 2015) with random instead of actual sequences as starting sequences (see “Materials and Methods” section). In the simulation, the starting protein sequence for each gene was created by randomly shuffling the original human sequence, but the relative evolutionary rate of each position as well as other parameters of the gene were unchanged. All genes were simulated to have originated in the common ancestor of human and bacteria, and homologs were simulated for all extant organisms shown in figure 1. We repeated the simulation 9 times. When human sequences were used to initiate evolutionary simulations, a simulated bacterial homolog was not detected for an average of 9.1% of simulated human genes (fig. 1). When randomly shuffled sequences were used to initiate the simulations, the above value rose slightly but significantly to 9.6% (P = 4.6 × 10⁻⁹, two-tailed t-test) (fig. 1). This increase was likely due to the destruction of any common motifs among proteins, and any latent paralogy which survived simulation when starting from real protein sequences. In addition, we performed a shuffling wherein we locked the relative rate of a site with its associated amino acid and then randomized the location of both the amino acid and relative rate. Unsurprisingly, this randomization broke blocks of conserved sites and consequently increased error rates greatly (fig. 1). Examining homologs in other organisms instead of bacteria yielded similar patterns (fig. 1). Hence, our simulation following Domazet-Lošo et al.’s suggestion directly invalidates their criticism. Note that, although genes were simulated to have the same age, our results are not restricted to genes of equal ages, because age estimation for one gene is independent from that of any other gene in phylostratigraphy.
Fig. 1.—
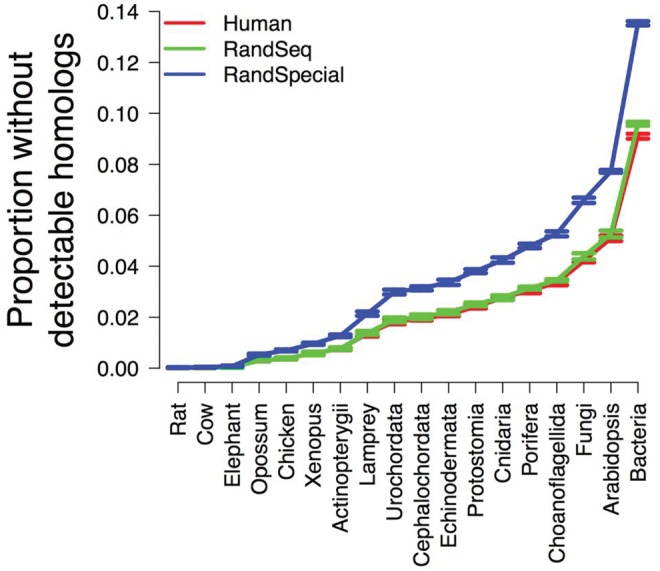
Proportions of simulated human genes with no detectable homologs in various organisms, despite the presence of simulated homologs in all organisms. Human: simulation using human sequences as ancestral sequences to initiate evolution. RandSeq: simulation using randomly shuffled human sequences as ancestral sequences to initiate evolution. RandSpecial: simulation using randomly shuffled human sequences (along with co-shuffled relative evolutionary rates) as ancestral sequences to initiate evolution. Presented are mean proportions ± one SDs from nine simulation replications.
Domazet-Lošo et al.’s second criticism is that associating gene features which are not simulated is inappropriate and circular, and will reproduce known phylostratigraphic trends. This again reflects their lack of understanding of the logic of our simulation. As mentioned, if phylostratigraphy is unbiased, no gene property should show a significant correlation with estimated gene age in our simulation, because all genes are simulated to be equally old. Many gene properties are inter-correlated, and it is precisely these correlations that create spurious results in phylostratigraphy for gene properties that do not directly impact BLAST performance. For instance, BLAST uses only protein (or DNA) sequences, so the expression level of a protein does not directly impact BLAST. But because lowly expressed proteins tend to evolve rapidly in sequence (Pal et al. 2001; Zhang and Yang 2015) and rapid sequence evolution causes gene age underestimation by BLAST (Moyers and Zhang 2015), phylostratigraphy is predicted to produce a spurious positive correlation between estimated gene age and expression level, as observed in our simulation (Moyers and Zhang 2016). Such observations demonstrate that phylostratigraphy is biased rather than that the simulation is wrong.
Reevaluating the Association between Gene Age and Disease Status
Domazet-Lošo and Tautz (2008) published a paper entitled “An ancient evolutionary origin of genes associated with human genetic diseases.” By a phylostratigraphic analysis of human genes, they reported that “genes involved in genetic diseases are not simply a random subset of all genes in the genome but are biased toward ancient genes.” We subsequently showed that this trend can be recapitulated by simulation where all genes are equally old, suggesting that the original discovery results from phylostratigraphic bias (Moyers and Zhang 2015). In their recent critique, Domazet-Lošo et al. (2017) claimed that the trend they discovered still holds when genes found to be subject to BLAST error in simulation are excluded. This control of error, however, is incomplete for the following reason. Our simulation required first estimating various evolutionary parameters such as the relative evolutionary rate of each amino acid site of a protein. In our study, we used protein alignments of 12 specific mammalian species, and only 5,217 proteins have such alignments, because it is not uncommon that a human protein has no detectable ortholog in one or more of the other 11 mammals used. As a result, 17,628 of the 22,845 genes used in the original study (Domazet-Lošo and Tautz 2008) were not simulated. Of the 5,217 simulated, we found a BLAST error rate of ∼11%. There is no reason to believe that the 17,628 genes not simulated are free of error. Therefore, in assessing the influence of error on phylostratigraphy, one should not only exclude genes found to be error-prone in simulation but also those that are not simulated due to the lack of appropriate parameters.
We performed a reanalysis using either all genes (n = 22,845) or only those genes found by simulation to be error-resistant (n = 4,587) (fig. 2). Note that the term “error-resistant” means that our simulation found no evidence for phylostratigraphic error for these genes, but does not imply that they will never experience error in homology detection. As expected from the previous finding (Domazet-Lošo and Tautz 2008), when all genes were analyzed together, we observed a positive correlation between the estimated age of a gene and the probability that it is a disease gene (Spearman’s rank correlation ρ = 0.851, P < 10−15). Interestingly, the apparent trend became statistically nonsignificant (ρ = 0.286, P = 0.283), when only error-resistant genes were analyzed. This was not a result of insufficient statistical power, as a random selection of 4,587 genes from all genes resulted in a significant positive correlation in 9,997 of 10,000 times (maximum P = 0.086, mean P = 0.001, mean ρ = 0.732). Furthermore, restricting the analysis to the complementary gene set − genes not simulated plus those found to be error-prone in simulation − resulted in a close match with the trend observed when all genes were used (ρ = 0.760, P = 0.002). These results strongly suggest that the phylostratigraphic observation that disease genes tend to be older is a methodological artifact. Intriguingly, the median protein length is significantly greater for disease genes (593 amino acids) than nondisease genes (513 amino acids) among the 5,217 genes simulated (P = 3 × 10⁻⁷), suggesting that the difference in protein length, a known determinant of BLAST error (Moyers and Zhang 2015), may underlie the spurious result.
Fig. 2.—
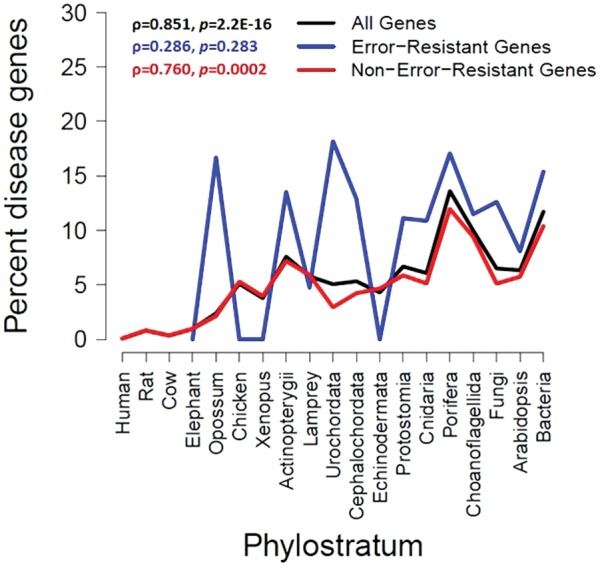
Percentage of disease genes in each age group. Rank correlation (ρ) between age group and percentage disease genes is shown for all genes, error-resistant genes based on simulation, and non-error-resistant genes, respectively.
Reassessing Trends Supporting the Proto-Gene Model
Carvunis et al. (2012) proposed a model for frequent de novo gene birth through intermediate proto-genes. Their empirical evidence for the model was largely from phylostratigraphic trends, such as the increases in protein length, expression level, and probability of being targets of purifying selection with estimated gene age. We demonstrated through simulation that homology detection error alone could create these statistical trends (Moyers and Zhang 2016). Our methodology was conservative so that a reliable conclusion could be drawn. For instance, for 619 genes whose alignments were unavailable because homologs were unfound in certain species, we randomly assigned their evolutionary rates using rates estimated from proteins with alignments. In their recent criticism, Domazet-Lošo et al. did not consider this fact. As a result, their conclusion that the original phylostratigraphic trends hold upon the removal of error-prone genes is unreliable.
We therefore reanalyzed the data after restricting to genes simulated using their own parameters and found to be error-resistant in the simulation (table 1). We note that many of the originally reported trends remain intact, but are significantly reduced in strength. For example, the correlation coefficient (ρ) between age and purifying selection is cut nearly in half from 0.316 to 0.166. This change in the strength of trends needs to be considered when assessing the evidence for the proto-gene model. More importantly, we also present the results when restricting to the complementary set of genes, which were not simulated using their own parameters or found in simulation to be error-prone. We note that the trends observed are often stronger in the complementary gene set than in all genes, which are in turn often stronger than in error-resistant genes (table 1). If these trends support the proto-gene model, as Carvunis et al. (2012) and Domazet-Lošo et al. (2017) concluded, the support apparently largely originates from error-prone genes. Our finding also emphasizes an important point: a minority of error-prone genes can exert undue influence on observed trends. Hence, caution is needed even when interpreting trends observed from error-resistant genes, because they could still include some genes that are subject to error (see “Discussion” section).
Table 1.
Rank Correlations between Estimated Gene Age and Gene Properties for Yeast Genes
| ORF Length | RNA Abundance | Proximity of TF Binding Sites or Not | Codon Adaptation Index | Purifying Selection or Not | Optimal AUG Context | |
|---|---|---|---|---|---|---|
| All ORFs (n = 5,878) | 0.386*** | 0.261*** | 0.077** | 0.312*** | 0.316*** | 0.133*** |
| Error-resistant (n = 4,620) | 0.179*** | 0.093** | 0.050* | 0.208*** | 0.166*** | 0.045* |
| Non-error-resistant (n = 1,258) | 0.429*** | 0.163** | −0.002 | 0.324*** | 0.331*** | 0.212*** |
P < 0.05, **P < 10−10, ***P < 10−100.
Discussion
We have here further demonstrated that gene age underestimation caused by BLAST error is a nonnegligible contributor to observed phylostratigraphic trends. Additionally, there are a number of problems surrounding the theoretical basis of phylostratigraphy as proposed by Domazet-Lošo and colleagues and in their recent critique of our work, which we discuss below.
Definition of Novel Sequences
Domazet-Lošo et al. (2017) wrote that “phylostratigraphy infers the emergence of novel sequences at a particular phylogenetic node.” But, what exactly are novel sequences? How different should a sequence be from all existing sequences for it to be considered novel? Because phylostratigraphy is commonly used in empirical studies to date gene origins, the above quotation appears to equate gene origination with novel sequence emergence. But are they the same thing? Gene origination is presumably a slow process; how do we define the birthday of a gene? When the function of a gene changes in evolution, should the gene be considered a new gene? How much functional change in a gene renders it a new gene? Because functional changes and sequence changes do not have linear or even monotonic relationships, how are new genes related to novel sequences? Domazet-Lošo and colleagues answered none of these pertinent questions, nor did they offer any biological definition of “novelty” or “novel sequences.” Domazet-Lošo et al. (2017) also stated that “phylostratigraphy aims to capture the time when the sequence divergence took place, not necessarily the time of origin of the ancestral gene.” But sequence divergence is a continuous and gradual process for most genes, and how phylostratigraphy captures this time is unclear. They commented that phylostratigraphy is intended to detect “shifts in sequence space by large evolutionary divergence,” but they offered no concrete definition of sequence space shifts.
Phylostratigraphy as presently practiced regards a sequence as novel when it has no BLAST hit in a genome. Thus, novel sequences are apparently operationally defined in phylostratigraphy by a lack of BLAST hit. Because BLAST results depend on the specific BLAST program (BLASTP, BLASTN, and TBLASTN) and E-value cutoff, this operational definition of novel sequences is not unique and is subjective. More disturbingly, the relation between the operational definition and biological definition of novel sequences is expected to vary among genes, rendering the biological relevance of the operational definition unclear and operational definition-based analysis biologically meaningless. Even Domazet-Lošo and colleagues themselves admit that a gene with a novel function (and which they argue should be considered a novel gene) may nevertheless have a BLAST hit and be erroneously regarded as nonnovel under the operational definition. Furthermore, these authors also consider the false negative error of BLAST as a failure of the operational definition. If there is to be any progress in this field, the terms must be clearly defined.
The Role of Simulation in Evolutionary Studies
Because evolution usually proceeds slowly over enormous time spans, it is uncommon to observe evolution directly, which makes computer simulation an essential tool in the study of evolution. Obviously, simulations need to be as realistic as feasible to mimic actual evolution. In our previous two studies (Moyers and Zhang 2015, 2016), we performed simulations using parameters estimated from many data sources, each representing thousands of genes. In general, these simulations have been more realistic than those in previous studies, in which evolutionary parameters used did not represent those for most genes in the genome (Elhaik et al. 2006; Albà and Castresana 2007). We have also performed simulations of less well-understood evolutionary processes as an exploratory measure without emphasizing these results as central. One example is the covarion model (Fitch and Markowitz 1970), in which the evolutionary rate of a site changes in evolution. Domazet-Lošo et al. (2017) claimed that the covarion rate we used was too high, compared with a previous estimate of this rate from one protein (EF-Tu) that is found across prokaryotes and eukaryotes (Wang et al. 2009). Because having a high covarion rate drastically decreases BLAST’s ability to detect remote homologs (Moyers and Zhang 2015), it is highly likely that the low covarion rate estimated from EF-Tu is simply unrepresentative of most genes in the genome. This is the same kind of problem found in prior simulations—they relied upon parameters estimated from a few old, well-conserved proteins as opposed to a more representative sampling of genes (Albà and Castresana 2007). Note that although the exact covarion rates in protein evolution have not been estimated extensively, many studies have found evidence for the covarion model of protein evolution and its impact (Fitch and Markowitz 1970; Lopez et al. 1999, 2002; Penny et al. 2001; Huelsenbeck 2002; Guidon et al. 2004; Ané et al. 2005; Merlo et al. 2007; Wang et al. 2007; Studer and Robinson-Rechavi 2010; Zhou et al. 2010). Hence, it is almost certain that our primary simulations that did not use the covarion model were conservative in estimating the effect of BLAST error.
Despite the essential role of simulation in evolutionary studies, it is important to recognize that, because reality is almost always more complicated than any model, simulations are most useful for examining general trends and principles, as opposed to particular and precise observations. Thus, estimating by simulation the exact percentage of genes subject to BLAST error is less meaningful or relevant than examining whether a statistical trend observed in actual data is possibly caused by BLAST error. Because simulation models cannot be identical to the actual mode of evolution, it is unclear whether one is able to use simulations to identify all genes subject to BLAST error. Consequently, removing genes identified by simulation to be error-prone does not guarantee an error-free data set. It remains possible that the statistically significant associations with much reduced effect sizes for the error-resistant genes in table 1 reflect residual effects of BLAST errors. Consistent with this prediction, we found that, even for the error-resistant genes, mean protein length is significantly greater for age group 10 (1,711 amino acids, present in the common ancestor of Saccharomyces cerevisiae and Schizosaccharomyces pombe) than age group 9 (1,394 amino acids, present in the common ancestor of S. cerevisiae and Neurospora crassa) (P = 4.5 × 10⁻¹⁰, t-test), which is almost certainly a phylostratigraphic artifact because no reasonable model has been proposed to explain why mean protein length grows even hundreds of millions of years after gene birth.
Irrelevant Corrections
Domazet-Lošo and colleagues offered a number of potential corrections which they assert removes the problem of error. However, most are not relevant to the key problem of false negative homology detection error.
In their commentary on the work of Carvunis et al. (2012), they mentioned three corrections which we did not perform, but none are relevant for the question of the influence of false negative homology detection error. First, they mentioned that correlations remain when requiring at least 80% sequence overlaps between homologs. This is a method of controlling for false positives, not false negatives. It makes homology detection more restrictive, increasing false negative errors. Second, they commented that a series of partial correlations were performed to control the known factors impacting BLAST error rate, and findings held. However, Carvunis et al. (2012) reported only a control for gene expression level and a separate control for the power of their method in detecting selection in short sequences when correlating the estimated gene age with strength of purifying selection. The first control is based on the observation that highly expressed genes are under stronger purifying selection than lowly expressed ones (Pal et al. 2001; Zhang and Yang 2015) and does not control homology detection error. The second control is due to reduced statistical power in detecting selection in short sequences and does not control homology detection error either. Third, they commented that their correlation findings held when they restricted to 50 genes in each age bin. It is unclear how this has any bearing on false negative homology detection error.
Domazet-Lošo et al. (2017) stated that Carvunis et al. (2012) used an “orthogonal approach” to verify a 5% error rate among their data set. This orthogonal approach was to BLAST the full NCBI database as opposed to only the genomes of Ascomycota fungi. What they discovered was that if a gene appeared young in Ascomycota fungi, there was about a 5% chance that it has a homolog outside of Ascomycota. This approach tells us that the BLAST error rate is at least 5%, not that it is 5%. Furthermore, this approach cannot exclude the possibility that the observed statistical trends are due to BLAST errors.
Domazet-Lošo et al. (2017) suggested that the use of three homology detection tools in Carvunis et al. (2012), as opposed to the use of only BLASTP in our simulation, results in necessarily more sensitive results. However, there are problems in this reasoning: BLASTP is the most sensitive of these tools. In fact, some of these authors have explicitly commented on the failings of nucleotide-based phylostratigraphy (Albà and Castresana 2007) and were opposed to its use due to simulations demonstrating high error. Domazet-Lošo et al. (2017) did not comment on whether or not age distributions change substantially or at all when analysis was restricted to only BLASTP results.
Conservative versus Liberal Methods
If one intends to reject a null hypothesis but there is no unbiased method, the convention in the field of molecular evolution as well as many other scientific fields is to use methods that are relatively conservative (i.e., less likely to reject the null hypothesis) instead of those that are relatively liberal (i.e., more likely to reject the hypothesis) to ensure that a rejection of the null hypothesis would be trustable. Carvunis et al. (2012) attempted to demonstrate the high rate of de novo gene origination by identifying S. cerevisiae-specific genes that are under purifying selection. They reported 16 such genes, but 15 of them are each overlapped with another gene on the opposite strand and the overlapped regions constitute between 73% and 93% of each of these 15 genes (Moyers and Zhang 2016). When estimating gene age by phylostratigraphy, they excluded the overlapped regions to acquire underestimated ages. But when testing for purifying selection, they included the overlapped regions to acquire overestimated purifying selection that likely arises from the selection on the overlapped genes. In other words, they used liberal methods to find 16 S. cerevisiae-specific, selected genes. When we used conservative methods by including the overlapped regions in phylostratigraphy and excluding them in purifying selection tests, no gene was found to be S. cerevisiae-specific and selected (Moyers and Zhang 2016). This is not simply a discrepancy in results between two equally valid approaches, as implied by Domazet-Lošo et al. (2017). The convention has always been to use the conservative method, or at least both methods rather than just the liberal method. Using only the liberal method is at the minimum misleading.
In the same vein, when we claimed the impact of phylostratigraphic error, we used conservative methods. For instance, we simulated only genes with sequence alignments in the specified taxa, despite that genes missing in some taxa are likely to evolve rapidly and exhibit higher phylostratigraphic errors. In our study of human disease genes, we only had sufficient information to simulate 5,217 genes of the 22,845 used by Domazet-Lošo and Tautz (2008). A conservative re-evaluation of results would restrict analyses to those genes whose evolution can be reliably simulated. There is no reason to believe that the unsimulated 17,628 genes had a lower error rate, let alone were free from error. Similarly, in our re-evaluation of yeast genes, 619 genes were simulated using parameters not derived from their alignments due to a lack of homologs to infer evolutionary parameters. We also used a covarion rate of zero in our primary simulations, despite that the covarion mode of evolution increases phylostratigraphic error and has been found to be quite common (Fitch and Markowitz 1970; Lopez et al. 1999, 2002; Penny et al. 2001; Huelsenbeck 2002; Guidon et al. 2004; Ané et al. 2005; Merlo et al. 2007; Wang et al. 2007; Studer and Robinson-Rechavi 2010; Zhou et al. 2010). The conservativeness of our approach means that not all error-prone genes are identified in our simulation, but only a lower limit. By comparison, in their proposed correction for error, Domazet-Lošo and colleagues remove only those genes which we were able to simulate and found to be error-prone. This is a liberal approach, as the majority of genes were unable to be simulated, and so the error-prone status cannot be assessed. Again, Domazet-Lošo and colleagues use liberal methods when it is more appropriate to be conservative.
Nonsensical Conclusions
There are at least two points in which Domazet-Lošo et al. (2017) presented evidence that is in direct contradiction to their arguments, but they concluded that the evidence is in their favor. First, they claimed that in their reanalysis of the Carvunis et al. (2012) data, they performed Kruskal–Wallis tests within each age group to quantify the significance of differences between the original, simulated, and reduced original ORF sets (upon the removal of error-prone genes). They reported that the “P value of the Kruskal–Wallis test was smaller when comparing the original and simulated sets than when comparing the original and reduced original sets in the large majority of cases,” and concluded that “rather than undermining the original conclusions, the simulation approach actually strengthens them.” The reported P values only show that the original is more similar to the reduced original than to the simulated. This does not strengthen their conclusions. To demonstrate that the simulation approach strengthens their conclusions, they would need to provide evidence for lower P values in the reduced original data than the original. Their table 1 shows exactly the opposite.
Second, Domazet-Lošo et al. pointed out that 5 of the 15 genes Carvunis et al. (2012) determined to be S. cerevisiae-specific turned out to not be species-specific when more substantial and appropriate analyses (Knowles and McLysaght 2009) than phylostratigraphy were performed. This is no small point. This suggests an error rate of at least 33% in identifying species-specific genes by phylostratigraphy, an observation directly contrasting their claim that phylostratigraphy has zero error when applied to closely related species. It echoes the conclusion that findings of our study—which cannot simulate the evolution of the fastest evolving genes—represent lower bounds of phylostratigraphic error.
The Future of Phylostratigraphy
In summary, we pointed out the theoretical difficulty of phylostratigraphy, demonstrated the robustness of our original simulation results by performing additional simulations as suggested by Domazet-Lošo et al., showed that previously published phylostratigraphic trends either disappear or become much weakened when only error-resistant genes were analyzed, and explained why criticisms of our work by Domazet-Lošo et al. are untenable. Contrary to Domazet-Lošo et al.’s conclusion, our findings demonstrate that false-negative errors are nonnegligible contributors to phylostratigraphic trends and that they cannot be ignored in phylostratigraphic studies. We further suggest a more robust methodology for controlling for the effects of error by first restricting to those genes which can be simulated and then removing those genes which, through simulation, have been shown to be error-prone. One cannot assume that unsimulated genes have no error or a lower error rate than those with sufficient information to be simulated. As we have here highlighted, Domazet-Lošo et al.’s own reanalysis of reportedly species-specific genes in S. cerevisiae uncovered an error rate as high as 33%. Thus, when one tries to demonstrate the robustness of a phylostratigraphic result to error, removing only those genes detected in conservative simulation to be error-prone, as was done by Domazet-Lošo et al. (2017), is obviously insufficient.
Because simulation models cannot be identical to the actual mode of evolution, it is unclear whether one is able to use simulations to identify all genes subject to BLAST error. Consequently, removing genes identified by simulation to be error-prone does not guarantee an error-free data set. Even error-resistant genes may experience phylostratigraphic error, depending on the context (e.g., the convarion model). Nevertheless, considering only error-resistant genes should reduce phylostratigraphic error and improve the reliability of phylostratigraphic results. More importantly, if a trend disappears when this error is controlled for, the trend is attributable to error.
In the context of de novo gene origination, Domazet-Lošo et al. (2017) failed to offer a sensible explanation under the proto-gene model for their observation of continuous growths in mean protein length and other gene properties hundreds of millions of years after gene origination, and a recent article pointed out additional concerns about the phylostratigraphy approach (McLysaght and Hurst 2016). Future work should clarify the meaning of gene age if properties of genes of different ages continue to be a subject of interest. Aside from the conceptual issues with gene age, if one is to use an operational definition of gene age (or novel sequence) determined by a homology detection tool, one needs to identify and use a homology detection method that is much less affected by gene properties so that correlations between the estimated gene ages and gene properties are genuine rather than artifactual. Until such methods are identified and applied, one should remain suspicious about phylostratigraphy-based findings.
Acknowledgments
We thank Aoife McLysaght, Stephen Smith, Zhengting Zou, and three anonymous reviewers for valuable comments. This work was supported in part by U.S. National Institutes of Health research grant GM120093 to J.Z.
Literature Cited
- Albà MM, Castresana J.. 2005. Inverse relationship between evolutionary rate and age of mammalian genes. Mol Biol Evol. 22:598–606. [DOI] [PubMed] [Google Scholar]
- Albà MM, Castresana J.. 2007. On homology searches by protein Blast and the characterization of the age of genes. BMC Evol Biol. 7:53. [DOI] [PMC free article] [PubMed] [Google Scholar]
- Altschul SF, Gish W, Miller W, Myers EW, Lipman DJ.. 1990. Basic local alignment search tool. J Mol Biol. 215:403–410. [DOI] [PubMed] [Google Scholar]
- Ané C, Burleigh JG, McMahon MM, Sanderson MJ.. 2005. Covarion structure in plastid genome evolution: a new statistical test. Mol Biol Evol. 22:914–924. [DOI] [PubMed] [Google Scholar]
- Camacho C, et al. 2009. BLAST+: architecture and applications. BMC Bioinformatics 10:421. [DOI] [PMC free article] [PubMed] [Google Scholar]
- Carvunis A-R, et al. 2012. Proto-genes and de novo gene birth. Nature 487:370–374. [DOI] [PMC free article] [PubMed] [Google Scholar]
- Domazet-Lošo T, Brajkovic J, Tautz D.. 2007. A phylostratigraphy approach to uncover the genomic history of major adaptations in metazoan lineages. Trends Genet. 23:531–533. [DOI] [PubMed] [Google Scholar]
- Domazet-Lošo T, et al. 2017. No evidence for phylostratigraphic bias impacting inferences on patterns of gene emergence and evolution. Mol Biol Evol. 34:843–856. [DOI] [PMC free article] [PubMed] [Google Scholar]
- Domazet-Lošo T, Tautz D.. 2008. An ancient evolutionary origin of genes associated with human genetic diseases. Mol Biol Evol. 25:2699–2707. [DOI] [PMC free article] [PubMed] [Google Scholar]
- Domazet-Lošo T, Tautz D.. 2010a. A phylogenetically based transcriptome age index mirrors ontogenetic divergence patterns. Nature 468:815–818. [DOI] [PubMed] [Google Scholar]
- Domazet-Lošo T, Tautz D.. 2010b. Phylostratigraphic tracking of cancer genes suggests a link to the emergence of multicellularity in metazoa. BMC Biol. 8:66. [DOI] [PMC free article] [PubMed] [Google Scholar]
- Elhaik E, Sabath N, Graur D.. 2006. The ‘inverse relationship between evolutionary rate and age of mammalian genes’ is an artifact of increased genetic distance with rate of evolution and time of divergence. Mol Biol Evol. 23:1–3. [DOI] [PubMed] [Google Scholar]
- Fitch WM, Markowitz E.. 1970. An improved method for determining codon variability in a gene and its application to the rate of fixation of mutations in evolution. Biochem Genet. 4:579–593. [DOI] [PubMed] [Google Scholar]
- Guidon S, Rodrigo AG, Dyer KA, Huelsenbeck JP.. 2004. Modeling the site-specific variation of selection patterns along lineages. Proc Natl Acad Sci U S A. 101:12957–12962. [DOI] [PMC free article] [PubMed] [Google Scholar]
- Hedges SB, Dudley J, Kumar S.. 2006. TimeTree: a public knowledge-base of divergence times among organisms. Bioinformatics 22:2971–2972. [DOI] [PubMed] [Google Scholar]
- Huelsenbeck JP. 2002. Testing a covariotide model of DNA substitution. Mol Biol Evol. 19:698–707. [DOI] [PubMed] [Google Scholar]
- Jones DT, Taylor WR, Thornton JM.. 1992. The rapid generation of mutation data matrices from protein sequences. Bioinformatics 8:275–282. [DOI] [PubMed] [Google Scholar]
- Knowles DG, McLysaght A.. 2009. Recent de novo origin of human protein-coding genes. Genome Res. 19:1752–1759. [DOI] [PMC free article] [PubMed] [Google Scholar]
- Lopez P, Casane D, Philippe H.. 2002. Heterotachy, an important process of protein evolution. Mol Biol Evol. 19:1–7. [DOI] [PubMed] [Google Scholar]
- Lopez P, Forterre P, Philippe H.. 1999. The root of the tree of life in the light of the covarion model. J Mol Evol. 49:496–508. [DOI] [PubMed] [Google Scholar]
- McLysaght A, Hurst LD.. 2016. Open questions in the study of de novo genes: what, how and why. Nat Rev Genet. 17:567–578. [DOI] [PubMed] [Google Scholar]
- Merlo LMF, Lunzer M, Dean AM.. 2007. An empirical test of the concomitantly variable codon hypothesis. Proc Natl Acad Sci USA. 104:10938–10943. [DOI] [PMC free article] [PubMed] [Google Scholar]
- Moyers BA, Zhang J.. 2015. Phylostratigraphic bias creates spurious patterns of genome evolution. Mol Biol Evol. 32:258–267. [DOI] [PMC free article] [PubMed] [Google Scholar]
- Moyers BA, Zhang J.. 2016. Evaluating phylostratigraphic evidence for widespread de novo gene birth in genome evolution. Mol Biol Evol. 33:1245–1256. [DOI] [PMC free article] [PubMed] [Google Scholar]
- Neme R, Tautz D.. 2013. Phylogenetic patterns of emergence of new genes support a model of frequent de novo evolution. BMC Genomics 14:117. [DOI] [PMC free article] [PubMed] [Google Scholar]
- Pal C, Papp B, Hurst LD.. 2001. Highly expressed genes in yeast evolve slowly. Genetics 158:927–931. [DOI] [PMC free article] [PubMed] [Google Scholar]
- Penny D, McComish BJ, Charleston MA, Hendy MD.. 2001. Mathematical elegance with biochemical realism: the covarion model of molecular evolution. J Mol Evol. 53:711–723. [DOI] [PubMed] [Google Scholar]
- Sestak M, Domazet-Lošo T.. 2014. Phylostratigraphic profiles in zebrafish uncover chordate origins of the vertebrate brain. Mol Biol Evol. 32:299–312. [DOI] [PMC free article] [PubMed] [Google Scholar]
- Sestak MS, Božičević V, Bakarić R, Dunjko V, Domazet-Lošo T.. 2013. Phylostratigraphic profiles reveal a deep evolutionary history of the vertebrate head sensory systems. Front Zool. 10:18.. [DOI] [PMC free article] [PubMed] [Google Scholar]
- Stoye J, Evers D, Meyer F.. 1998. Rose: generating sequence families. Bioinformatics 14:157–163. [DOI] [PubMed] [Google Scholar]
- Studer RA, Robinson-Rechavi M.. 2010. Large-scale analysis of orthologs and paralogs under covarion-like and constant-but-different models of amino acid evolution. Mol Biol Evol. 27:2618–2627. [DOI] [PMC free article] [PubMed] [Google Scholar]
- Toll-Riera M, et al. 2009. Origin of primate orphan genes: a comparative genomics approach. Mol Biol Evol. 26:603–612. [DOI] [PubMed] [Google Scholar]
- Wang H-C, Spencer M, Susko E, Roger AJ.. 2007. Testing for covarion-like evolution in protein sequences. Mol Biol Evol. 24:294–305. [DOI] [PubMed] [Google Scholar]
- Wang H-C, Susko E, Roger AJ.. 2009. PROCOV: maximum likelihood estimation of protein phylogeny under covarion models and site-specific covarion pattern analysis. BMC Evol Biol. 9:225. [DOI] [PMC free article] [PubMed] [Google Scholar]
- Zhang J, Yang J-R.. 2015. Determinants of the rate of protein sequence evolution. Nat Rev Genet. 16:409–420. [DOI] [PMC free article] [PubMed] [Google Scholar]
- Zhou Y, Brinkmann H, Rodrigue N, Lartillot N, Philippe H.. 2010. A dirichlet process covarion mixture model and its assessments using posterior predictive discrepancy tests. Mol Biol Evol. 27:371–384. [DOI] [PubMed] [Google Scholar]