

Abstract
It is known that extreme temperature and ambient air pollution are each independently associated with human health outcomes. However, findings from the few studies that have examined modified effects by seasons and the interaction between air pollution and temperature on health endpoints are inconsistent. This study examines the effects of short-term PM2.5 (particulate matter less than or equal to 2.5 μm in aerodynamic diameter) on hospitalization for cardiovascular diseases (CVDs), its modifications by season and temperature, and whether these effects are heterogeneous across different regions in New York State (NYS). We used daily average temperature and PM2.5 concentrations as exposure indicators and performed a time series analysis with a quasi-Poisson model, controlling for possible confounders, such as time-relevant variables and dew point, for CVDs in NYS, 1991–2006. Stratification parametric models were applied to evaluate the modifying effects by seasons and temperature. Across the whole year, a 10-μg/m3 increment in PM2.5 concentration accounted for a 1.37% increase in CVDs (95% confidence interval (CI): 0.90%, 1.84%) in New York City, Long Island & Hudson. The PM2.5 effect was strongest in winter, with an additional 2.06% (95% CI: 1.33%, 2.80%) increase in CVDs observed per 10-μg/m3 increment in PM2.5. Temperature modified the PM2.5 effects on CVDs, and these modifications by temperature on PM2.5 effects on CVDs were found at low temperature days. These associations were heterogeneous across four PM2.5 concentration regions. PM2.5 was positively associated with CVD hospitalizations. The short-term PM2.5 effect varied with season and temperature levels, and stronger effects were observed in winter and at low temperature days.
Keywords: CVD, PM2.5, Temperature, Season, Modification
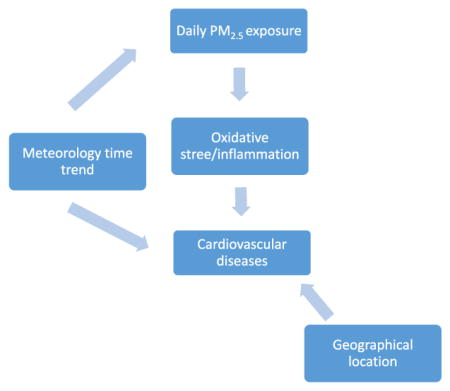
Graphical abstract
1. Introduction
The short-term association between airborne particles and adverse health effects has been documented, with evidence suggesting substantial increased risk of mortality, hospitalization, and emergency department visits (Lin et al., 2012; US EPA, 2004). Temperature can also affect health, and it is well established that extremely high temperatures contribute to increases in mortality and some morbidity, such that a U-, V-, or J-shaped relationship between temperature and health endpoints is usually found (Curriero et al., 2002; Hajat et al., 2006; Kovats et al., 2004). The weather condition is a major driving force of air pollution concentration (Jacob and Winner, 2009; Kinney, 2008; Tai et al., 2010). For example, higher temperature speeds up chemical reactions in the air; lower temperature makes the particulate matter (PM) dissipate in the air more slowly than usual; and rain washes out water-soluble pollutants and PM. Additionally, temperature is associated with season and PM concentration varies with region and season (Bell et al., 2008). PM2.5 (PM less than or equal to 2.5 μm in aerodynamic diameter) has been observed to be greatest in winter in some locations. Fares (2013) found that PM2.5 increased up to 57% in winter in China and the concentration of PM2.5 and PM10 (PM less than or equal to 10 μm in aerodynamic diameter) in Turkey was higher in winter than in summer. However, air pollution was also found to be worse during a heatwave in a few studies. These studies describe associations of air pollution with temperature, but the results are not consistent.
Few epidemiological studies have looked at the interaction between PM and temperature and the effect of seasonality, especially on PM2.5, and these few studies have produced conflicting results. Bell et al. (2008) reported seasonal variation in the association between PM2.5 and cardiovascular hospitalization with the strongest estimated association in winter. However, Katsouyanni et al. (1993) found an interaction effect between high levels of particulate air pollution and high temperature on mortality. Roberts (2004) and Ren et al. (2006) suggested that it is important to consider the possibility of an interaction between daily particular air pollution and daily mean temperature on mortality. Additionally, Samet et al. (1998) and Hales et al. (2000) found little evidence that weather conditions modified the effect of air pollution on mortality. As the prior results are inconsistent and there is an association of air pollution with temperature, the question of whether temperature modifies the effect of PM2.5 on cardiovascular diseases (CVDs) remains to be addressed.
The purpose of this study was: (1) to identify the potential health impact of PM2.5 on CVD hospitalizations in New York State (NYS) during the period 1991–2006, while controlling for time-relevant confounding variables; (2) to investigate the seasonality of the potential health impact of PM2.5; (3) to evaluate a possible modification by temperature of the effect of PM2.5; and (4) to examine whether the above-mentioned effects differ across regions.
2. Materials and methods
2.1. Morbidity data
The target population included all NYS residents with hospital admissions due to CVDs during 1991–2006. A CVD case was defined according to a principal diagnosis with the following International Classification of Disease, 9th Revision, including chronic rheumatic heart disease (ICD-9 codes 393–396), hypertension (401–405), ischemic heart diseases (410–414), cardiac dysrhythmias (427), heart failure (428), and cerebrovascular diseases (430–434, 436–438). Discharge data for hospital admissions due to CVDs among residents of NYS from 1991 to 2006 were obtained from the NYS Department of Health’s Statewide Planning and Research Cooperative System. This is a legislatively mandated database that contains hospital discharge data for at least 95% of all acute care hospital admissions in NYS, excluding admissions to psychiatric and federal hospitals. The data included principal diagnoses, hospital admission date, sources of payment, date of birth, sex, race, ethnicity, and street address. About 94% of residential addresses were geocoded to street level, and 5% to zip code level. <1% of the addresses could not geocoded.
2.2. PM2.5 concentration and weather data
Fourteen weather regions in NYS that were created so that temperature within each region was relatively homogeneous are shown in Fig. 1 (Chinery and Walker, 2009). Each weather region was assigned a daily average value of temperature and dew point based on hourly meteorologic observations obtained from the National Center for Atmospheric Research (2009) for 18 first-order airport weather stations maintained by the National Weather Service or the Federal Aviation Administration. Daily 24-hour average PM2.5 concentration was estimated using all monitoring observations and modeled data for those with missing values as described by Hogrefe et al. (2009).
Fig. 1.

14 weather regions and 4 PM2.5 regions.
2.3. Statistical analysis
We conducted time-series analyses to characterize the short-term effect of PM2.5 with CVDs and modify it by season and temperature strata using a quasi-Poisson model, while controlling for possible confounders. We first built the basic model without air pollution, with the following choices regarding the control of confounders:
where Yt is the number of CVDs on day t; DOWt, PUBt, and BOUTt are day of week, public holidays, blackout events (8/14/2003 and 8/15/2003); tempt is the average temperature on day t and tempt,1–3 is a moving average of temperature for the previous three days; dewpt and dewpt,1–3 are current day and 3-day moving average of dew point; ns(·, DF) indicates a natural spline with degrees of freedom (DF). The DF numbers used are within the range used in other studies (Cheng and Kan, 2012; Roberts, 2004).
Before examining the results modified by season and temperature, we assessed the short-term effects of PM2.5 on the same day (lag 0) and 1, 2, and 3 days before (lag 1–lag 3) on CVDs in 14 NYS weather regions. For this main model, we introduced a linear parametric term of PM2.5 concentration into the basic model. We also performed this main analyses for the five major cause-specific CVD hospitalizations. To examine the season-specific PM2.5 effects on CVDs, we extended the main model by replacing a linear parametric term of PM2.5 concentration with an interaction term between PM2.5 and seasons. The four seasons were spring (March to May), summer (June to August), fall (September to November), and winter (December to February).
To investigate whether or not temperature modifies the short-term PM2.5 effect on CVDs, we stratified the short-term PM2.5 effect by temperature. We defined the low temperature stratum as daily average temperature ≤ 25th percentile, middle temperature stratum as daily average temperature between 25th and 75th percentiles, and high temperature stratum as daily average temperature > 75th percentile. The straightforward approach to examine the modifying short-term PM2.5 effect by temperature is to replace a linear term of PM2.5 concentration with an interaction between PM2.5 and temperature strata. We then can utilize these three estimated coefficients and their standard errors to form a statistical test of the PM2.5 effect between low vs. middle and high vs. middle temperature strata. However, in this approach, the statistical test is in error since it ignores the correlation in estimation errors of the coefficients being compared. To overcome this problem, we reparameterized the short-term PM2.5 effect in the main model as the main PM2.5 effect at middle temperature stratum and the PM2.5 effect differences between temperature strata (middle vs. low and middle vs. high). This stratified parametric model provides a simple quantitative comparison of the estimated short-term PM2.5 effects of CVDs by allowing PM2.5 to have a differential in each temperature stratum and also have a statistical test of the differences between estimated PM2.5 effects of temperature strata. This statistical test was generated from the model for coefficients of the PM2.5 effect differences between temperature strata. We produce geographic estimates of the association between PM2.5 and CVDs based on four PM2.5 exposure characterization regions in NYS using Bayesian hierarchical models to combine risk changes across 14 NYS weather regions. Four PM2.5 exposure characterization regions in NYS were created with minimal variation in PM2.5 concentration within each region. Details of this development have been previously described by Chinery and Walker (2009). To identify how the weather regions correspond with the PM2.5 exposure characterization regions, we overlaid the 14 weather regions onto the four PM2.5 exposure characterization regions. All analyses used R 3.0.1 and the splines package for the quasi-Poisson model and the tlnise package for Bayesian hierarchical models (Everson and Morris, 2000).
3. Results
3.1. Descriptive summary
The NYS map describing the 14 weather regions and four PM2.5 exposure regions is shown in Fig. 1. Table 1 provides summary statistics for CVDs. Nearly 4.6 million hospitalizations for CVDs took place in NYS over the 16-year period, 71% of which were among NYC, Long Island and Hudson residents. Among overall CVD hospitalizations, 43% were ischemic heart disease and 22% were heart failure. The majority of patients were elderly. Fig. S1a\\S1b (Supplemental materials) provides the distributions of daily average temperature and PM2.5 concentration for the whole year across 14 NYS weather regions, 1991–2006. Adirondack & North had the lowest daily average temperature. LGA, JFK and Staten Island had the higher PM2.5 concentration.
Table 1.
Number and percent of cardiovascular hospitalizations from by patient demographic characteristics, season, and region: New York State, 1991–2006.
| N | Percent (%)a | |
|---|---|---|
| Sex | ||
| Male | 2,390,048 | 52 |
| Female | 2,244,562 | 48 |
| Unknown | 140 | 0 |
| Ethnicity | ||
| Hispanic | 299,937 | 6 |
| Other | 3,840,047 | 83 |
| Unknown | 494,766 | 11 |
| Race | ||
| White | 3,288,711 | 71 |
| Black | 630,673 | 14 |
| Other | 462,961 | 10 |
| Unknown | 252,405 | 5 |
| Age | ||
| 0–17 | 13,533 | 0 |
| 18–44 | 263,325 | 6 |
| 45–64 | 1,352,598 | 29 |
| 65–74 | 1,191,262 | 26 |
| 75+ | 1,814,032 | 39 |
| CVD group | ||
| Ischemic heart disease | 2,007,862 | 43 |
| Heart failure | 999,264 | 22 |
| Cerebrovascular disease | 672,651 | 15 |
| Cardiac dysrhythmias | 641,614 | 14 |
| Hypertension | 289,011 | 6 |
| Chronic rheumatic heart disease | 243,48 | 1 |
| Season | ||
| Spring | 1,205,343 | 26 |
| Summer | 1,134,091 | 24 |
| Fall | 1,152,013 | 25 |
| Winter | 1,143,303 | 25 |
| Temperature stratum | ||
| Low | 1,170,711 | 25 |
| Middle | 2,340,506 | 51 |
| High | 1,123,533 | 24 |
| Region | ||
| NYC, Long Island & Hudson | 3,277,487 | 71 |
| Adirondack & North | 89,263 | 2 |
| Mohawk Valley & Binghamton | 324,233 | 7 |
| Central & Western NYS | 943,767 | 20 |
due to rounding, the sum of percentage may not be 100.
3.2. Short-term PM2.5 effect
Table 2 presents the year-round percent risk changes for daily CVD hospitalization per 10-μg/m3 increase in PM2.5 concentration across four PM2.5 exposure regions, 1991–2006. We found evidence of a significant year-round association with a 1.37% increase (95% confidence interval [CI]: 0.90%–1.84%) between PM2.5 concentration and CVD hospitalization in NYC, Long Island and Hudson. The short-term PM2.5 effect in NYC, Long Island, and Hudson was also significant for cause-specific CVD hospitalization. Its strongest effect occurred on heart failure, followed by hypertension, cardiac dysrhythmias, ischemic heart disease, and cerebrovascular disease.
Table 2.
Percent risk change in cardiovascular morbidity per 10 μg/m3 increase in PM2.5 in NYS, 1991–2006% Risk Change (95% CI).
| Region | NYC, Long Island & Hudson | Adirondack & North | Mohawk Valley & Binghamton | Central & Western NY |
|---|---|---|---|---|
| All CVDs | 1.37 (0.90, 1.84)a, b | −0.43 (−2.33, 1.51) | 0.43 (−2.03, 2.95) | 0.13 (−0.64, 0.91) |
| Heart failure | 2.16 (1.13, 3.21)a, b | −3.54 (−7.55, 0.64) | 0.43 (−2.99, 3.98) | 0.02 (−1.65, 1.73) |
| Hypertension | 1.93 (0.69, 3.18)a, b | 6.46 (−1.81, 15.42) | 2.03 (−6.05, 10.80) | 0.71 (−2.37, 3.88) |
| Cardiac dysrhythmias | 1.52 (0.69, 2.36)a, b | 0.05 (−4.69, 5.03) | 1.43 (−4.34, 7.55) | −0.45 (−3.00, 2.17) |
| Ischemic heart disease | 1.03 (0.49, 1.58)a, b | 0.53 (−2.27, 3.41) | −0.20 (−2.76, 2.44) | 0.28 (−0.83, 1.41) |
| Cerebrovascular disease | 0.83 (0.11, 1.57)a | −1.38 (−6.28, 3.77) | 0.94 (−3.32, 5.39) | 0.28 (−1.35, 1.94) |
Significant, p-value <0.05.
Significant, p-value <0.01.
3.3. Modifications by season and temperature
Table 3 displays the percent risk changes in daily CVD hospitalization per 10-μg/m3 increase in PM2.5 concentration across four seasons in four PM2.5 exposure regions, 1991–2006. The seasonal pattern of the short-term PM2.5 effects on CVDs is like a monotonic increase from spring to winter except for Mohawk Valley & Binghamton. The strongest effects always occurred in winter and the weakest ones occurred in spring (NYC, Long Island & Hudson, and Central & Western NY) and fall (Mohawk Valley & Binghamton). NYC, Long Island and Hudson had significant short-term PM2.5 effects on CVDs ranging from 0.74% to 2.06% in all four seasons; Central & Western NY showed a significant PM2.5 effect (1.55%) only in winter. We also estimated year-round 1-day to 3-day lagged CVD morbidity risk associated with PM2.5 concentrations. We found little evidence of association with CVD morbidity at these lags (Table S1, Supplemental materials).
Table 3.
Seasonal percent risk change in cardiovascular morbidity per 10 μg/m3 increase in PM2.5 in NYS, 1991–2006.
| Region | % Risk Change (95% CI)
|
|||
|---|---|---|---|---|
| Springa | Summera | Falla | Wintera | |
| NYC, Long Island & Hudson | 0.74 (0.00, 1.49)b | 1.28 (0.60, 1.96)b, c | 1.25 (0.56, 1.94)b, c | 2.06 (1.33, 2.80)b, c |
| Adirondack & North | −1.01 (−4.73, 2.85) | −0.32 (−2.85, 2.27) | −0.44 (−3.55, 2.77) | −0.15 (−4.25, 4.12) |
| Mohawk Valley & Binghamton | −0.14 (−3.26, 3.08) | 0.46 (−2.12, 3.11) | −0.47 (−3.92, 3.11) | 1.89 (−1.39, 5.28) |
| Central & Western NY | −1.12 (−2.65, 0.43) | −0.02 (−1.12, 1.08) | 0.10 (−1.06, 1.28) | 1.55 (0.17, 2.94)b |
Spring: 3–5; Summer: 6–8; Fall: 9–11; Winter: 12 and 1–2.
Significant, p-value <0.05.
Significant, p-value <0.01.
Table 4 describes the percent risk changes in daily CVD hospitalization per 10-μg/m3 increase in PM2.5 concentration across three levels of temperature in four PM2.5 exposure regions, 1991–2006. We found the linear trend of short-term PM2.5 effects on CVD hospitalization across three temperature strata except Adirondack & North. The strongest effects occurred at low temperature except for Adirondack & North, and the weakest effects were always found at high temperature in four PM2.5 exposure regions. NYC, Long Island & Hudson had significant short-term PM2.5 effects at low and middle temperature with 2.20% and 1.63% increased CVDs, respectively. The test results showed the only significant difference in short-term PM2.5 effects between middle and high temperature in NYC, Long Island & Hudson.
Table 4.
Percent change in cardiovascular morbidity per 10 μg/m3 increase in PM2.5 across three levels of temperature in NYS, 1991–2006.
| Region | Low temperaturea | p-Valueb | Middle temperaturea | p-Valuec | High temperaturea |
|---|---|---|---|---|---|
| NYC, Long Island & Hudson | 2.20 (1.34, 3.07)d, e | 0.12 | 1.63 (0.93, 2.34)d, e | 0.04d | 0.52 (−0.25, 1.29) |
| Adirondack & North | −0.56 (−4.97, 4.05) | 0.62 | 0.66 (−2.26, 3.68) | 0.35 | −1.02 (−3.42, 1.45) |
| Mohawk Valley & Binghamton | 1.43 (−2.00, 4.97) | 0.67 | 0.58 (−1.80, 3.02) | 0.76 | 0.06 (−3.25, 3.48) |
| Central & Western NY | 1.35 (−0.03, 2.74) | 0.18 | 0.31 (−0.64, 1.27) | 0.25 | −0.52 (−1.66, 0.64) |
Temperature: °C. Low temperature: daily average temperature ≤ 25th percentile; middle temperature: 25th percentile < daily average temperature ≤ 75th percentile; high temperature: daily average temperature > 75th percentile.
P-Value for low temperature stratum compared with middle temperature.
P-Value for high temperature stratum compared with middle temperature.
Significant, p-value <0.05.
Significant, p-value <0.01.
3.4. Sensitivity analyses
In order to test the sensitivity of the results to the modeling choices described above, we considered several variations of our primary risk model, using different DFs for the smooth function of calendar time and controlling 8-hr maximum average ozone concentration limited to 1000–1800 h, which represents the most likely time for outdoor exposure. Table S2 (Supplemental materials) shows the percent risk change in cardiovascular morbidity per 10 μg/m3 increase in PM2.5 using the natural spline of the calendar time with different DFs in the main model (5 and 9 df/year). Table S3 (Supplemental Materials) shows the percent risk change in CVDs per 10 μg/m3 increase in PM2.5, 1991–2004 with/without controlling ozone. Due to missing values for ozone concentration, we were only able to apply the main model with controlling 8-hr maximum average ozone concentration for the sub-dataset (1991–2004). We also investigated the modification of PM2.5 effects by temperature using different temperature strata definitions, such as the 33rd/67th and 20th/80th percentiles of the temperature distribution. None of these alternate models produced substantially different CVD morbidity risk estimates.
4. Discussion
The present study used time-series analyses to examine the short-term PM2.5 effect and seasonal and temperature modifying effects on CVD hospitalization in NYS from 1991 to 2006.
In our analysis of PM2.5 and cardiovascular morbidity, we estimated that cardiovascular morbidity increased 1.37% for a 10-μg/m3 increase in PM2.5 in NYC, Long Island & Hudson. Our finding of this significant positive association between PM2.5 and CVD hospitalization in NYC, Long Island & Hudson is consistent with previous studies. Dominici et al. (2006) found a 1.28% short-term risk increase in hospitalization for heart failure per 10-μg/m3 increase in same-day PM2.5 in 204 US urban counties (population > 200,000) during 1999 to 2002. The underlying biological mechanism for a short-term PM2.5 effect may be mediated through autonomic, hemostatic, inflammatory, and vascular endothelial injury/dysfunction (Brook et al., 2010; Zanobetti et al., 2014). For example, PM2.5 may trigger the onset of CVD events by increasing blood pressure, heart rate, peripheral vascular resistance, C-reactive protein, oxidative stress, and atherosclerosis, and by decreasing brachial artery diameter, brachial artery flow, and plaque stability (Fares, 2013; Zanobetti et al., 2014).
We found seasonal variation in associations between cardiovascular morbidity and PM2.5 in NYS. Our results identified that the strongest short-term PM2.5 effect in CVD hospitalization was in winter, which was consistent with previous findings. Bell et al. (2008) and Bell (2012) reported the highest short-term PM2.5 effect (1.49%, 95%CI: 1.09%–1.89%) in winter for respiratory and CVD hospitalizations in 202 US counties, 1999–2005. Fares (2013) reviewed several previous studies of seasonal patterns of CVDs that mostly indicated a peak of CVDs in winter months.
The results of fitting a stratified parametric model suggested that temperature modifies the association between PM2.5 and cardiovascular morbidity in NYS. Specifically, we observed stronger PM2.5 effects on cardiovascular morbidity for low temperature days. It is consistent with our results of stronger PM2.5 effects in winter. The inconsistency between the second strongest effects in summer and the smallest effects on high temperature days could be related to the fact that the temperature range on high temperature days only covered part of the summer temperature range. The summer temperature in NYC, Long Island & Hudson ranged from 10.4 °C to 34.2 °C, but high temperature days had a range from 18 °C to 34.2 °C. The range in summer in NYC, Long Island & Hudson still included some cool days. Previous epidemio-logic studies have reported various findings, including no interactions between air pollution and temperature and higher/lower air pollution effects during summer in morbidity/mortality (Cheng and Kan, 2012; Liu et al., 2013; Zanobetti and Schwartz, 2008; Ren et al., 2006; Ren and Tong, 2006). For example, contrary to our study, Li et al. (2011) have reported that the health effects of ambient air pollutants are enhanced at higher temperature, particularly in regions with typically cooler temperature. Many factors may contribute to this heterogeneity of findings, such as differences in study population characteristics, health endpoints, exposure definition, weather, geographic conditions, climate adaptation, and modeling strategies.
We also observed regional differences in our study; the metropolitan region (NYC, Long Island & Hudson) had significant positive short-term PM2.5 effects in most of our analyses, while for the remaining three regions, only Central & Western NY had a significant positive short-term PM2.5 effect in winter. Possible reasons are that PM2.5 concentration in NYC, Long Island & Hudson was higher than in the other three regions and traffic congestion-related PM2.5 in metropolitan regions in summer is higher than in suburban areas. Additional evidence supporting our findings is that other studies evaluating sources of PM2.5 found that vehicles contribute up to one-third of observed PM2.5 in urban areas (Levy et al., 2010) and urban areas have higher metal levels compared to rural areas (Cibella et al., 2015). Especially, nickel (Ni), which is a component of PM2.5, was more related to CVD-related hospitalization than some other components (Ito et al., 2011; Ostro et al., 2009).
Day-to-day air pollution concentrations can fluctuate with changing weather conditions, and temperature is an indicator of change in weather. The relationship between temperature and air pollution is complex and varies seasonally and regionally. The biological mechanisms for PM2.5 effects on cardiovascular morbidity modified by temperature are very complicated, and possible pathways for both temperature and PM2.5 are still unclear. However, there are various plausible explanations proposed for our finding of higher PM2.5 effects in winter and on low temperature days. There is extensive use of heating appliances in cold seasons and on low temperature days, with coal, oil, diesel, or wood burned and stagnant air masses shaped from low temperature and low wind speed (Fares, 2013). People stay inside with poor ventilation during cold seasons or on low temperature days.
Furthermore, PM2.5 total mass alone may be not a sufficient metric in estimating health effects since PM2.5 toxicity may vary by its chemical constituents, which vary seasonally and regionally with patterns of source activity and meteorological conditions. There is growing evidence that PM2.5 constituents differ in their effects on human health. For example, hospitalization studies have suggested that health effects differ depending upon PM2.5 constituents (Peng et al., 2009). Additionally, Bell (2012) reported higher PM2.5 effect estimates for CVDs in seasons and areas with higher PM2.5 content of Ni, vanadium (V), and elemental carbon. Several studies investigated sources of fine particle composition and oil combustion marked by the presence of Ni and V (Bell et al., 2007; Hains et al., 2007; Lin et al., 2004); PM2.5 content of Ni was particularly associated with CVD-related hospitalization (Ito et al., 2011; Ostro et al., 2009). Moreover, previous studies have reported that low temperature activates the sympathetic nervous system and secretion of catecholamine, which resulted in increasing the workload of the cardiopulmonary system; these actions could induce cardiovascular events. For instance, an experimental study showed that frequent cold exposure of rats resulted in development of hypertension (Fares, 2013). These studies suggest that another potential explanation of stronger PM2.5 effects in winter and on low temperature days is due to the variation of PM2.5 toxicity. Moreover, during the days with high temperature, people tend to stay inside and use air conditioning, thus reducing their indoor and outdoor exposure. Previous studies showed that communities with a higher prevalence of central air conditioning had lower PM2.5 effects for CVDs.
There are several major strengths of this study. The stratified parametric model provides parametric estimates and easily compares the difference of parametric estimates by strata. We also repeated our analysis with different DFs for calendar time and adjusted for ozone. The similar findings from these duplicate approaches strengthen the study. Second, we performed statistical tests of differences between PM2.5 effect estimates on low vs. middle and middle vs. high temperature, providing a clear indication of whether a significant difference exists. Finally, 16-year time-series data provided an appropriate study time period, and inclusion of 14 NYS weather regions allowed consideration of geographic variation.
This study also has some limitations. We were unable to adjust for lifestyle and other socioeconomic characteristics. For example, we did not know the ventilation status of homes in our study, and we assumed that people kept windows open on high temperature days although this may be modified by the presence of air conditioning. We only examined CVD hospitalization; however, patients with minor symptoms may go to the emergency department.
5. Conclusions
In conclusion, we found a strong short-term effect of PM2.5 concentration on CVD hospitalization in NYC, Long Island & Hudson and found the effect to be modified by season and temperature. Specifically, short-term PM2.5 effect is stronger in winter and at low temperature days. The implications of these findings are important for policy measures. Since air pollution and temperature have been individually well linked to adverse health outcomes, correct identification of their joint effect provides insight into the health impact from a public health perspective, especially considering the potential effects of climate change.
Supplementary Material
HIGHLIGHTS.
The short-term PM2.5 effect on CVDs is identified, with its seasonal pattern and modification by temperature.
NYC, Long Island & Hudson has year-round PM2.5 effect on CVDs.
The strongest PM2.5 effect on CVDs exists in winter and at low temperature days.
Importance of their joint effect is shown and also provides insight into the health impact from a public health perspective.
Acknowledgments/disclaimers
This study was supported by grant U38EH000942 from the Centers for Disease Control and Prevention. The authors declare they have no actual or potential competing financial interests. The authors thank Carole Ju of New York State Department of Health, Bureau of Environmental & Occupational Epidemiology for her helpful comments.
Abbreviations
- CI
confidence interval
- CVDs
cardiovascular diseases
- NYS
New York State
- NYC
New York City
- PM
particulate matter
Appendix A. Supplementary data
Supplementary data to this article can be found online at http://dx.doi.org/10.1016/j.scitotenv.2016.11.008.
References
- Bell ML. Assessment of the health impacts of particulate matter characteristics. Res Rep Health Eff Inst. 2012:5–38. [PubMed] [Google Scholar]
- Bell ML, Dominici F, Ebisu K, Zeger SL, Samet JM. Spatial and temporal variation in PM(2.5) chemical composition in the United States for health effects studies. Environ Health Perspect. 2007;115:989–995. doi: 10.1289/ehp.9621. [DOI] [PMC free article] [PubMed] [Google Scholar]
- Bell ML, Ebisu K, Peng RD, Walker J, Samet JM, Zeger SL, Dominici F. Seasonal and regional short-term effects of fine particles on hospital admissions in 202 US counties, 1999–2005. Am J Epidemiol. 2008;168:1301–1310. doi: 10.1093/aje/kwn252. [DOI] [PMC free article] [PubMed] [Google Scholar]
- Brook RD, Rajagopalan S, Pope CA, III, Brook JR, Bhatnagar A, Diez-Roux AV, Holguin F, Hong Y, Luepker RV, Mittleman MA, Peters A, Siscovick D, Smith SC, Jr, Whitsel L, Kaufman JD. Particulate matter air pollution and cardiovascular disease: an update to the scientific statement from the American Heart Association. Circulation. 2010;121:2331–2378. doi: 10.1161/CIR.0b013e3181dbece1. [DOI] [PubMed] [Google Scholar]
- Cheng Y, Kan H. Effect of the interaction between outdoor air pollution and extreme temperature on daily mortality in Shanghai, China. J Epidemiol. 2012;22:28–36. doi: 10.2188/jea.JE20110049. [DOI] [PMC free article] [PubMed] [Google Scholar]
- Chinery R, Walker R. Development of exposure characterization regions for priority ambient air pollutants. Hum Ecol Risk Assess. 2009;15:876–889. [Google Scholar]
- Cibella F, Balzan M, Perrino C, Scaccianoce G, Bilocca D, Zammit C, Drago G, Ruggieri S, Canepari S, Minardi R, Montefort S. Outdoor PM2. 5 l Chemical composition in 3 areas with urban/rural difference in prevalence of respiratory diseases. Eur Respir J. 2015;46(Suppl 59):PA3399. [Google Scholar]
- Curriero FC, Heiner KS, Samet JM, Zeger SL, Strug L, Patz JA. Temperature and mortality in 11 cities of the eastern United States. Am J Epidemiol. 2002;155:80–87. doi: 10.1093/aje/155.1.80. [DOI] [PubMed] [Google Scholar]
- Dominici F, Peng RD, Bell ML, Pham L, McDermott A, Zeger SL, Samet JM. Fine particulate air pollution and hospital admission for cardiovascular and respiratory diseases. JAMA. 2006;295:1127–1134. doi: 10.1001/jama.295.10.1127. [DOI] [PMC free article] [PubMed] [Google Scholar]
- Everson PJ, Morris CN. Inference for multivariate normal hierarchical models. J R Stat Soc Ser B Stat Methodol. 2000;62:399–412. [Google Scholar]
- Fares A. Winter cardiovascular diseases phenomenon. N Am J Med Sci. 2013;5:266–279. doi: 10.4103/1947-2714.110430. [DOI] [PMC free article] [PubMed] [Google Scholar]
- Hains JC, Chen LW, Taubman BF, Doddridge BG, Dickerson RR. A side-by-side comparison of filter-based PM2.5 measurements at a suburban site: A closure study. Atmos Environ. 2007 Sep 30;41(29):6167–6184. [Google Scholar]
- Hajat S, Armstrong B, Baccini M, Biggeri A, Bisanti L, Russo A, Paldy A, Menne B, Kosatsky T. Impact of high temperatures on mortality: is there an added heat wave effect? Epidemiology. 2006;17:632–638. doi: 10.1097/01.ede.0000239688.70829.63. [DOI] [PubMed] [Google Scholar]
- Hales S, Salmond C, Town GI, Kjellstrom T, Woodward A. Daily mortality in relation to weather and air pollution in Christchurch, New Zealand. Aust N Z J Public Health. 2000;24:89–91. doi: 10.1111/j.1467-842x.2000.tb00731.x. [DOI] [PubMed] [Google Scholar]
- Hogrefe C, Zalewsky E, Hao W, et al. A combined modeled-observation approach to estimate historic gridded fields of PM2.5 mass and species concentrations. Atmos Environ. 2009;43:2561–2570. [Google Scholar]
- Ito K, Mathes R, Ross Z, Nadas A, Thurston G, Matte T. Fine particulate matter constituents associated with cardiovascular hospitalizations and mortality in New York City. Environ Health Perspect. 2011;119:467–473. doi: 10.1289/ehp.1002667. [DOI] [PMC free article] [PubMed] [Google Scholar]
- Jacob DJ, Winner DA. Effect of climate change on air quality. Atmos Environ. 2009 Jan 31;43(1):51–63. [Google Scholar]
- Katsouyanni K, Pantazopoulou A, Touloumi G, Tselepidaki I, Moustris K, Asimakopoulos D, Poulopoulou G, Trichopoulos D. Evidence for interaction between air pollution and high temperature in the causation of excess mortality. Arch Environ Health. 1993;48:235–242. doi: 10.1080/00039896.1993.9940365. [DOI] [PubMed] [Google Scholar]
- Kinney PL. Climate change, air quality, and human health. Am J Prev Med. 2008;35:459–467. doi: 10.1016/j.amepre.2008.08.025. [DOI] [PubMed] [Google Scholar]
- Kovats RS, Hajat S, Wilkinson P. Contrasting patterns of mortality and hospital admissions during hot weather and heat waves in greater London, UK. Occup Environ Med. 2004;61:893–898. doi: 10.1136/oem.2003.012047. [DOI] [PMC free article] [PubMed] [Google Scholar]
- Levy JI, Buonocore JJ, Von Stackelberg K. Evaluation of the public health impacts of traffic congestion: a health risk assessment. Environ Health. 2010 Oct 27;9(1):1. doi: 10.1186/1476-069X-9-65. [DOI] [PMC free article] [PubMed] [Google Scholar]
- Li G, Zhou M, Cai Y, Zhang Y, Pan X. Does temperature enhance acute mortality effects of ambient particle pollution in Tianjin City, China. Sci Total Environ. 2011;409(10):1811–1817. doi: 10.1016/j.scitotenv.2011.02.005. [DOI] [PubMed] [Google Scholar]
- Lin CM, Li CY, Yang GY, Mao IF. Association between maternal exposure to elevated ambient sulfur dioxide during pregnancy and term low birth weight. Environ Res. 2004;96:41–50. doi: 10.1016/j.envres.2004.03.005. [DOI] [PubMed] [Google Scholar]
- Lin S, Hsu WH, Van Zutphen AR, Saha S, Luber G, Hwang SA. Excessive heat and respiratory hospitalizations in New York state: estimating current and future public health burden related to climate change. Environ Health Perspect. 2012;120:1571–1577. doi: 10.1289/ehp.1104728. [DOI] [PMC free article] [PubMed] [Google Scholar]
- Liu T, Li TT, Zhang YH, Xu YJ, Lao XQ, Rutherford S, Chu C, Luo Y, Zhu Q, Xu XJ, Xie HY. The short-term effect of ambient ozone on mortality is modified by temperature in Guangzhou, China. Atmos Environ. 2013 Sep 30;76:59–67. [Google Scholar]
- National Center for atmospheric Research. [Accessed 11-6-2009];2009 (Available). https://ncar.ucar.edu/home.
- Ostro B, Roth L, Malig B, Marty M. The effects of fine particle components on respiratory hospital admissions in children. Environ Health Perspect. 2009;117:475–480. doi: 10.1289/ehp.11848. [DOI] [PMC free article] [PubMed] [Google Scholar]
- Peng RD, Bell ML, Geyh AS, McDermott A, Zeger SL, Samet JM, Dominici F. Emergency admissions for cardiovascular and respiratory diseases and the chemical composition of fine particle air pollution. Environ Health Perspect. 2009;117:957–963. doi: 10.1289/ehp.0800185. [DOI] [PMC free article] [PubMed] [Google Scholar]
- Ren C, Tong S. Temperature modifies the health effects of particulate matter in Brisbane, Australia. Int J Biometeorol. 2006;51:87–96. doi: 10.1007/s00484-006-0054-7. [DOI] [PubMed] [Google Scholar]
- Ren C, Williams GM, Tong S. Does particulate matter modify the association between temperature and cardiorespiratory diseases? Environ Health Perspect. 2006;114:1690–1696. doi: 10.1289/ehp.9266. [DOI] [PMC free article] [PubMed] [Google Scholar]
- Roberts S. Interactions between particulate air pollution and temperature in air pollution mortality time series studies. Environ Res. 2004;96:328–337. doi: 10.1016/j.envres.2004.01.015. [DOI] [PubMed] [Google Scholar]
- Samet J, Zeger S, Kelsall J, Xu J, Kalkstein L. Does weather confound or modify the association of particulate air pollution with mortality? An analysis of the Philadelphia data, 1973–1980. Environ Res. 1998;77:9–19. doi: 10.1006/enrs.1997.3821. [DOI] [PubMed] [Google Scholar]
- Tai A, Mickley L, Jacob D. Correlations between fine particulate matter (PM2.5) and meteorological variables in the United State: implications for the sensitivity of PM2.5 to climate change. Atmos Environ 2010 [Google Scholar]
- US EPA. Air Quality Criteria for Particulate Matter. 2004 Available:. http://www.epa.gov.
- Zanobetti A, Schwartz J. Temperature and mortality in nine US cities. Epidemiology. 2008;19:563–570. doi: 10.1097/EDE.0b013e31816d652d. [DOI] [PMC free article] [PubMed] [Google Scholar]
- Zanobetti A, Dominici F, Wang Y, Schwartz JD. A national case-crossover analysis of the short-term effect of PM2.5 on hospitalizations and mortality in subjects with diabetes and neurological disorders. Environ Health. 2014;13:38. doi: 10.1186/1476-069X-13-38. http://dx.doi.org/10.1186/1476-069X-13-38.:38-13. [DOI] [PMC free article] [PubMed] [Google Scholar]
Associated Data
This section collects any data citations, data availability statements, or supplementary materials included in this article.