Abstract
Understanding the mechanical loading environment and resulting joint mechanics for activities of daily living in total knee arthroplasty is essential to continuous improvement in implant design. Although survivorship of these devices is good, a substantial number of patients report dissatisfaction with the outcome of their procedure. Knowledge of in vivo kinematics and joint loading will enable improvement in preclinical assessment and refinement of implant geometry. The purpose of this investigation was to describe the mechanics of total knee arthroplasty during a variety of activities of daily living (gait, walking down stairs, and chair rise/sit). Estimates of muscle forces, tibial contact load, location, and pressure distribution was performed through a combination of mobile fluoroscopy data collection, musculoskeletal modeling, and finite element simulation. For the activities evaluated, joint compressive load was greatest during walking down stairs; however, the highest contact pressure occurred during chair rise/sit. The joint contact moment in the frontal plane was mainly varus for gait and walking down stairs, while it was valgus during chair rise/sit. Excursion of the center of pressure on the tibial component was similar during each activity and between the medial and lateral sides. The main determinants of center of pressure location were internal–external rotation, joint load, and tibial insert conformity.
Keywords: musculoskeletal modeling, TKR, fluoroscopy, knee osteoarthritis
Preclinical evaluation of prospective total knee arthroplasty (TKA) implants is critical to improve component design and predict in vivo performance. Although survivorship is high for most current knee replacements,1 a significant percentage of patients still report dissatisfaction with their procedure2 and the revision rate for TKA is currently the highest of all joint replacements.3 About 700,000 knee replacements are performed in the United States each year,4 and this number is projected to grow to roughly 3.5 million procedures by 2030.5 As the number of TKAs grows, there is a concomitant increase in the number of TKA revision surgeries. Common causes of revision surgery are instability and polyethylene wear, with established links to aseptic loosening, and osteolysis.3 Complications due to wear and instability are dependent on relative motion and local contact between articulating surfaces. Both joint stability and polyethylene wear are determined by a combination of joint load and tibiofemoral implant conformity.6,7 These variables are influenced by characteristics that are specific to each patient, namely implant design, component alignment,8,9 passive soft-tissue balance,10 active muscle forces,11 and movement strategies.12 Taken together, these characteristics suggest that the tibiofemoral contact mechanics of the implanted knee are likely subject and activity dependent, yet few studies have shown this in vivo.
In vivo TKA component contact mechanics are difficult to measure, particularly for common activities of daily living. As a result, in vivo contact location has been estimated using a variety of methods that combine measurement of subject kinematics with the geometry of knee. For example, some researchers have relied on calculation of the “lowest point”’ (LP) from measured knee kinematics using dynamic or static radiography.13–15 LP was used in these studies as a surrogate measure of tibial contact and assumes that contact between the tibial and femoral components occurs at the point of the femoral geometry that is closest to the tibial tray. However, LP estimates do not include the conforming geometry of the polyethylene tibial insert,16 which is normally not visible in X-ray. As a result, others have used dynamic radiography combined with knowledge of knee geometry to estimate contact location as the centroid of the intersection area between the two articulating surfaces.14,17,18 However, joint load correspondence to the estimated contact location is needed to quantify contact pressure on the tibial insert, which is an important determinant of polyethylene wear. Matched contact location and joint load require combined radiography and force-sensing telemetric implants,19,20 and rarely have these been combined to investigate both contact loading and contact mechanics.15,21 Research subjects with tele-metric implants are very rare (these studies always include limited numbers of subjects) and do not necessarily exhibit the knee mechanics of patients with other widely available knee components. As an alternative, computational modeling can be used to estimate joint load and, when combined with radiography measurements, estimate contact center of pressure (CP) on TKA implants.16,22–24
Knee function following TKA is a multiscale problem because joint level complications that influence survivorship and stability interact with strength and movement adaptations at the limb and whole-body scales. Following TKA, the great majority of patients experience substantially reduced pain along with increased ability to perform daily activities.25 Even so, patients often exhibit adaptations in their movement patterns and kinetics during basic functional tasks such as walking and sit-to-stand even 1 year after surgery.26,27 In addition, patients after TKA have reported limitations in other functional tasks such as navigating stairs and pivoting and in more advanced tasks such as kneeling and deep squats.28,29 These adaptations have been attributed to quadriceps strength and activation deficits, and may be enacted to enhance stability in the reconstructed knee.29 Thus, there is a continuing need for evaluations of TKA mechanics that link the knee and whole-body scales through integration of patient-specific measurements and simulation.
The purpose of this investigation was to quantify joint contact mechanics in patients with TKA performing varied activities of daily living. This was achieved by driving a finite element (FE) model of the implants with kinematics measured from a mobile fluoroscopy system and joint loads estimated with a whole-body musculoskeletal model.30 The FE model was used to estimate tibial contact load, location and pressure.
METHODS
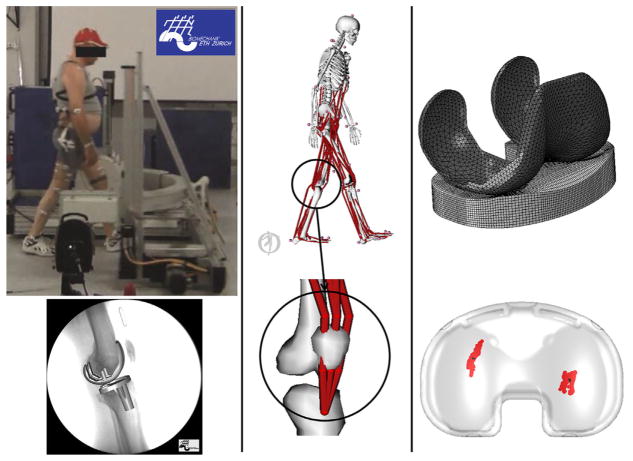
In overview, six patients with TKA (age 72 ± 8, 179 ± 3 cm, 77.4 ± 5.5 kg) performed three activities (walking on level, down stairs, and chair rise/sit) at self-selected speed while video motion capture and ground force data were collected simultaneously with moving fluoroscopy of the involved knee. All the patients were implanted with the same cruciate retaining TKA design (Sigma®, DePuy Synthes, Warsaw, IN). All experimental data collection occurred at the Institute for Biomechanics, ETH Zurich, Switzerland. Each subject signed an informed consent form, in accordance with the research ethics committee of the ETH Zurich. These data were used as input to a musculoskeletal simulation to estimate muscle and joint loads using OpenSim. In turn, estimated joint forces and knee kinematics from fluoroscopy were applied to a finite element model of the subject’s implant to provide tibiofemoral contact pressure, location, and force (Fig. 1). The case series had a level of evidence of 4, with no control group.
Figure 1.
The workflow of this study consisted of three steps: First, motion capture data, ground reaction forces, and fluoroscopy images were collected for walking on level ground, walking down stairs, and chair rise/sit activities for six subjects (left figures). Knee joint loads were calculated from subject-specific simulations in OpenSim using a musculoskeletal model that was modified to transmit forces of the quadriceps through the patella to the tibia (center figures). Estimated knee loads were combined with knee kinematics measured using fluorosocopy and then applied to a finite element model of the subject’s TKA implants to determine contact mechanics (right figures).
Marker-based motion capture data were collected by means of a 12 camera video photogrammetric system (Vicon MX system, Oxford Metrics Group, Oxford, UK). Simultaneous ground forces were recorded using six force plates (Kistler Instrumentation, Winterthur, Switzerland) mounted flush with the floor of the movement analysis laboratory. Two additional force plates were installed in a staircase for the measurement of the stair descent activity. The staircase consisted of a platform at the top and two descending stairs with embedded force plates. Single-plane fluoroscopy images were collected with a modified BV Pulsera (Philips Medical Systems, Best, the Netherlands) with a field of view of 30.5 cm, pulsed mode of 25 Hz, 8 ms radiation time, 1 ms shutter time, and an image resolution of 1,000 × 1,000 pixels with a grayscale resolution of 12 bit.30 Fluoroscopy was collected using the moving fluoroscope (Institute for Biomechanics, ETH Zurich, Switzerland) that maintained the involved knee in the image capture area during the activities.30,31 Registration of the implant components was performed by means of matching the CAD-models of the subject’s components to the fluoroscopic images, providing the instantaneous relative location between femoral component and tibial tray. Custom software was used to create a digital-reconstructed radiograph (DRR) of the implants, and then locate its pose in space by sequentially comparing the DRR to the actual X-ray fluoroscopic image. The initial pose was manually adjusted and then refined by means of a least-squares optimization algorithm that adjusted the pose to minimize the difference between gradient magnitudes and gray values in the DRR and fluoroscopic image.31 Uncertainty of the implant’s pose reconstruction was assessed in a previous study.30 A total of 63 acquisitions of X-ray images of a similar TKA implant (balanSys®, Mathys, Bettlach, Switzerland) in predefined positions were performed. The positioning of the implant was obtained by means of a three-dimensional positioning system composed of an industrial cross table (0.01 mm resolution) and a marking unit (0.01 mm resolution). The pose of both components was reconstructed using the CAD-models of the implant and translational and rotational errors were estimated. Root mean square errors (RMSE) across the 63 measurements can be found in Table 1.30
Table 1.
RMSE of the Registration Algorithm for the Two Implant Components
| Femoral Component | Tibial Component | ||
|---|---|---|---|
| Translations (mm) | X | 0.24 | 0.28 |
| Y | 0.12 | 0.22 | |
| Z | 0.80 | 1.02 | |
| Rotations (°) | X | 0.19 | 0.13 |
| Y | 0.22 | 0.25 | |
| Z | 0.13 | 0.05 |
X and Y directions are the horizontal and vertical directions of the X-ray image, respectively (approximately anteroposterior and superior–inferior axes of the joint for the performed activities), while Z is the out-of-plane direction (approximately mediolateral axis).30
A previously validated musculoskeletal model based on the model developed by Delp et al. was used to estimate muscle and joint loading in OpenSim.32,33 The model consisted of 23 degrees of freedom and 92 musculotendon units modeled as Hill-type muscles.34 The anthropometry of the model was scaled to the six subjects with scaling factors obtained by calculating the ratios of the distances between recorded marker trajectories during a static trial and virtual marker locations on the baseline model. The lower limbs included a ball-and-socket hip joint and a revolute ankle joint. In the current study, the knee joint was modified to implement a coupled mechanism (one degree of freedom) with translations and rotations of the tibia, and translations of the patella prescribed by the knee flexion angle.35 Muscle forces were represented by a contractile element with force–length and force–velocity properties in series with an elastic tendon. The quadriceps geometry of the original OpenSim model was refined to insert on the tibial tubercle with via points placed on the superior and inferior poles of the patella (Fig. 1).35 This enabled resultant quadriceps forces to be properly included in the calculation of tibiofemoral contact forces in OpenSim. Via point locations of the quadriceps were adjusted to guarantee that the moment arm of the musculotendon units replicated measurements of patellar tendon moment arm.36 Finally, the path of the two gastrocnemius musculotendon units (medialis and lateralis) was modified to better match moment arm measurements from experiment.37,38
The marker trajectories and ground forces recorded from the subjects were used as input to musculoskeletal simulations in OpenSim to estimate muscle and joint loads. Subject kinematics were calculated from the marker trajectories using OpenSim. To achieve the pose of the subject, the recorded marker locations are matched to virtual markers on the kinematic model of the subject. This matching technique is performed by solving a weighted least squares problem that minimizes marker errors at each time frame. Net forces and moments at the joints were obtained through the inverse dynamics solution. Because the number of muscles exceeds the degrees of freedom of the model, muscle forces for each activity were estimated by static optimization that minimized the summed muscle activations squared at each time frame.39 With the muscle forces as input, reaction forces and moments at the knee were calculated in the coordinate system of the implanted tibia. Resultant tibiofemoral loads were compared to in vivo measurements from other patients with instrumented implants for validation.40
The contact location, force, and pressure on the tibial insert were calculated by applying the estimated joint loads and measured kinematics to a finite element model of each subject’s TKA implant. A finite element model of the implant (femoral component, tibial insert and tibial tray) was developed in Abaqus/Explicit (Abaqus, Dassault Systèmes, Vélizy-Villacoublay, France) for each subject. The femoral components and the tibial tray were modeled with rigid triangular elements, while the tibial insert was modeled with deformable eight-noded hexahedral elements (Fig. 1). A previously validated plasticity model was used for the elements representing the polyethylene tibial insert.41 The coefficient of friction between metal and polyethylene was set to 0.04.42 The tibial component was fixed to the global coordinate system. Motion and loads were applied to the femoral component along and about the axes of the Grood and Suntay definition.43 According to this notation the medio-lateral (M-L) axis is directed relative to the orientation of the femur, the superior–inferior (S-I) axis is directed relative to the orientation of the tibia and the anteroposterior (A-P) axis is a floating axis perpendicular to both the M-L and S-I axes. Flexion–extension (F-E), A-P translation and internal–external (I-E) rotation were driven by the kinematics measured from fluoroscopy. S-I translation was left free and the tibiofemoral reaction force from the musculoskeletal model calculations along the same direction was applied.24,44 Due to the reduced out-of-plane accuracy of single-plane fluoroscopy,45 varus-valgus (V-V) rotation and M-L translation were left free.24 Instead, the V-V reaction moment estimated by the musculoskeletal model was applied about the A-P axis, and relative M-L position was determined by the applied boundary conditions and component geometry.24 A-P and I-E contact loads were measured from the FE simulations.
A total of 18 simulations were performed: Three tasks for each of the six subjects. Muscle forces, joint loads, and tibiofemoral CP and contact pressure were extracted for each simulation. The ratio between maximum medial and total pressures was also calculated as follows:
| (1) |
where Pmed and Plat are the maximum medial and lateral pressure, respectively (Equation 1).
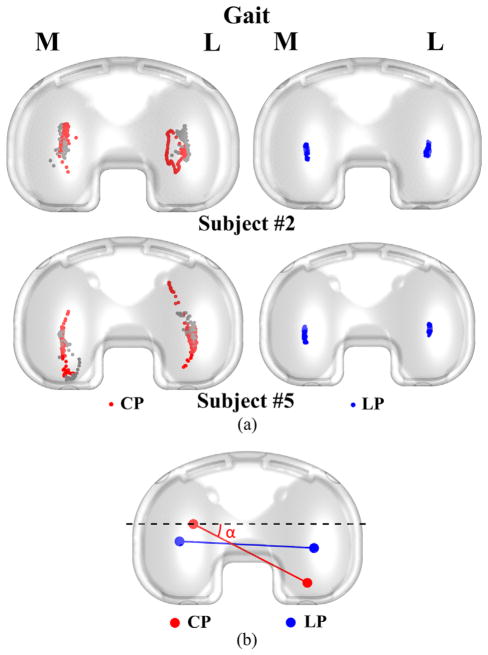
In addition, the locations of the geometric LP of the femoral component were calculated relative to the tibial insert for comparison with the location of the center of pressure. LP results have been frequently used as a surrogate measurement of CP. LP are defined as the most inferior points on the medial and lateral femoral condyles with respect to the S-I axis of the tibia at each instant of time.46
To evaluate the role of I-E rotation and I-E alignment of the implant on CP location, the angle between the line connecting CP on medial and lateral plateaus and the M-L line of the tibial component (CP angle) was calculated. I-E tibiofemoral alignment was identified as the I-E angle in correspondence to full extension or the smallest flexion angle during chair rise/sit (standing phase between rising and sitting). This variable was compared to the maximum CP angle in each simulation to evaluate its influence on CP location.
Finally, a sensitivity analysis was performed to evaluate the variability in contact mechanics due to uncertainty in the kinematics measured from fluoroscopy. Kinematic profiles were shifted by ±0.5 mm in A-P and ±0.5° in I-E in isolation24 during stair descent for three subjects that showed substantial inter-subject differences in tibiofemoral I-E alignment and CP location, and contact results were compared. RMSE for maximum contact pressure, CP location, and A-P and I-E contact loads between baseline and perturbed simulations were calculated. Unpaired samples Student’s t-tests were used to verify if inter-subject differences in CP centroid locations and A-P excursions in A-P directions between subjects were evident despite kinematic uncertainty. CP centroid locations and A-P excursions on medial and lateral sides from the five simulations for each subject (1 baseline + 4 perturbations) were compared to the same results for the other two analyzed subjects.
In the results, time was normalized with each activity progressing from 0% to 100%. The gait simulations include the swing phase and begin and end with heel-strike. Similarly, the stair decent activity begins with heel-strike of the involved side on the first descending stair and ends just prior to the next heel-strike of the same foot on the ground. The chair rise/sit simulations begin when the subjects leave the seat, proceed through stance, and end when the subject descends and touches the seat.
RESULTS
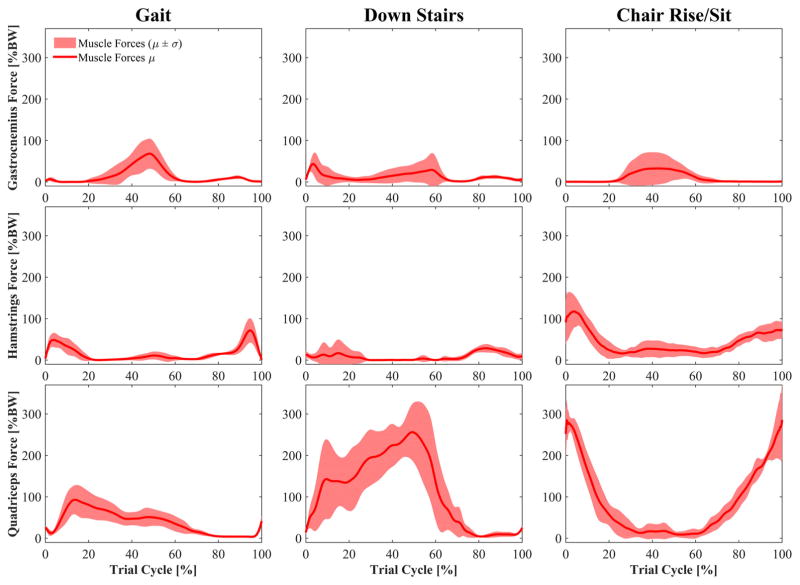
Muscle forces were highest during the chair rise/sit activity. The average peak quadriceps force occurred when the subjects left the chair and was 2172 N (286% BW) (Fig. 2). High quadriceps forces were also estimated for the stair descent at contralateral heel-strike (average peak 256% BW). Muscle forces during gait were much lower (average peak 93% BW).
Figure 2.
Calculated muscle forces spanning the knee (mean ± std) during level walking, walking down stairs, and chair rise/sit. Events for gait and stair descent: Heel-strike at 0% and 100% of cycle, toe-off at 60–65% of cycle, contralateral heel-strike at 50–55% of cycle.
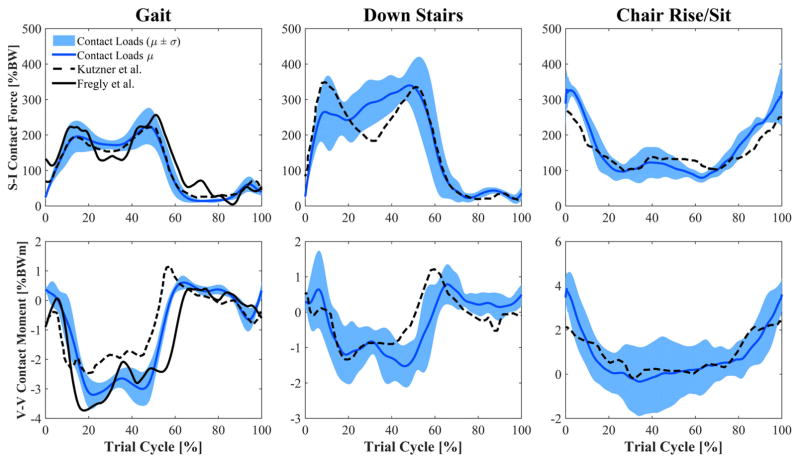
Joint compressive force was highest during walking down stairs (340% BW), followed by the chair rise/sit (330% BW) (Fig. 3). The chair rise/sit had the greatest range in joint force (excluding swing phase for gait and walking down stairs) from a high of 330% BW as the subject left the chair, to a minimum of 79% BW during the moment of standing before the subject moved back into the chair. During level walking, average peak joint force occurred late in stance (225% BW) as some of the subjects appeared to adopt a gait strategy that avoided early stance phase extensor moment.
Figure 3.
Calculated tibiofemoral joint compressive force and V-V contact moment (mean ± std) during level walking, walking down stairs, and chair rise/sit. The V-V moment is represented as positive (negative) when the femur generates a contact force on the lateral (medial) plateau of the insert. Values estimated in this study are compared to instrumented implant data of two representative patients from the literature. Events for gait and stair descent: Heel-strike at 0% and 100% of cycle, toe-off at 60–65% of cycle, contralateral heel-strike at 50–55% of cycle.
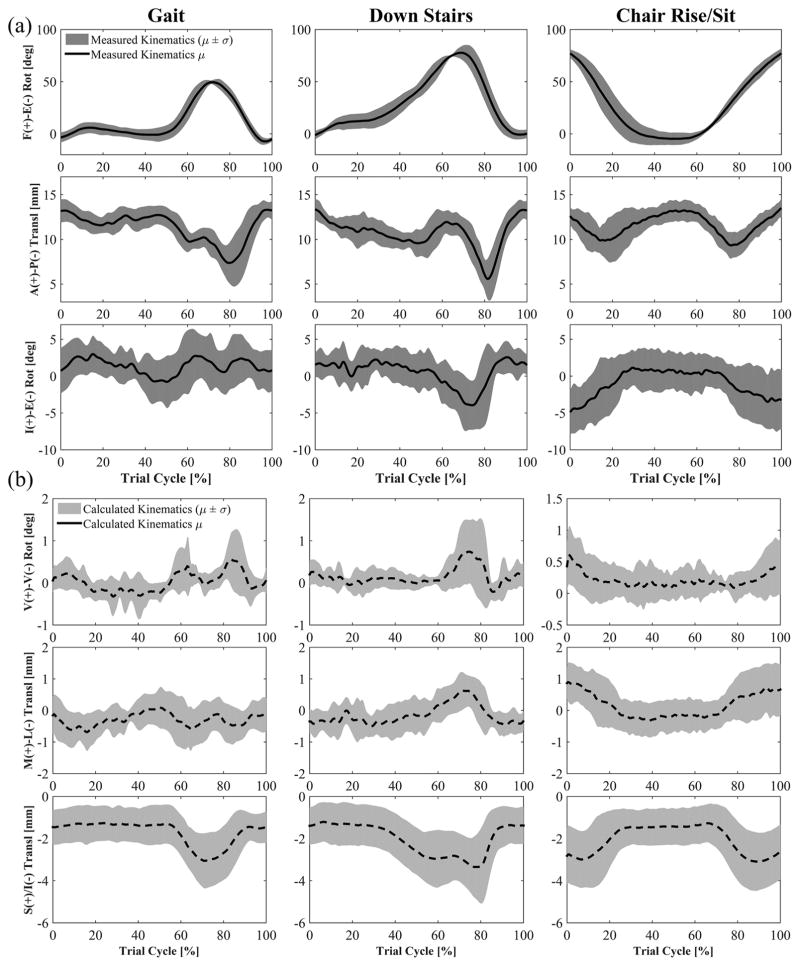
Knee kinematics as measured by the fluoroscopy system demonstrated consistent trends across subjects that were particular to each activity. The chair rise/sit produced the highest amount of knee flexion (average peak 81.0°) across all subjects (Fig. 4). A noticeable hyperextension of the femoral component was apparent at heel-strike (average peak −11.8° during gait). The chair rise/sit elicited anterior position of the femur during the rising and descending phases of the activity. The posterior position of the femoral component relative to the tibial component was similar between stair descent and gait, only moving posteriorly during swing (Fig. 4). The pattern of I-E rotation of the femur relative to the tibia was unique to each activity. External rotation was present as the subjects exited and returned to the seated position in the chair rise/sit (Fig. 4). Gait showed only small rotations during all phases of the gait cycle, whilst stair descent revealed a distinct external rotation as the foot left the step and began swing. Moreover, although the pattern of I-E rotation is generally consistent among the subjects, each showed a subject-specific tibiofemoral I-E alignment at full extension. Three subjects possessed an internal rotation of the femoral component (4.2°, 2.7°, and 2.5°), two subjects possessed an external rotation (−1.9° and −2.6°), and one subject was neutral (−0.1°). These different alignments between patients remained mostly constant at every flexion angle during each activity they performed. For example, two patients that showed respectively 2° of internal rotation and 2° of external rotation at full extension during chair rise/sit, showed 6° and 10° of external rotation at the highest flexion angle, keeping an almost constant alignment difference of 4°. Subjects with an internal alignment of the femoral component at full extension (3.2° on average) showed lower maximum CP angle (2.4° on average) in comparison with subjects with an external femoral alignment (−2.3° on average) that presented large maximum CP angles (16.9° on average).
Figure 4.
Femoral kinematics with respect to the tibia (mean ± std). (a) F-E, A-P, and I-E are measured from mobile single-plane fluoroscopy and used as input to the FE models. (b) V-V, M-L, and S-I were not kinematically driven in the FE models and result from applied loads and geometrical conformity of the implant. Events for gait and stair descent: Heel-strike at 0% and 100% of cycle, toe-off at 60–65% of cycle, contralateral heel-strike at 50–55% of cycle.
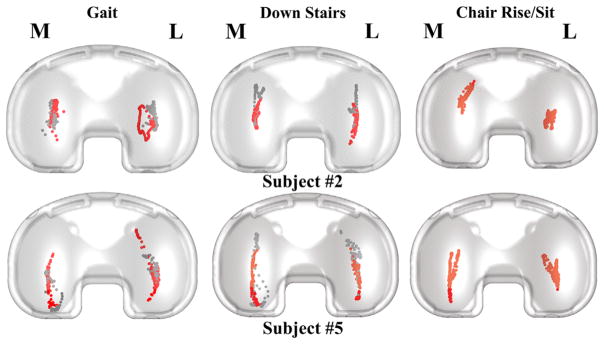
During all activities, motion of the CP on the tibial component was primarily in the A-P direction and similar on the medial and lateral sides (Fig. 5). Excluding the swing phase, motion of the CP was greatest during gait (average 18.7 mm A-P on the lateral side) and least during the chair rise (average 11.7 mm A-P on the lateral side) (Table 2). Motion of the CP in the M-L direction was less than 7.5 mm on average across all activities. Average peak A-P motion of LP was 5.8 mm on the medial side, which was much less than motion of the CP (Fig. 6).
Figure 5.
Sample tibiofemoral CP for two of the subjects. The gray dots represent the CP location during swing phase. Both subjects #2 and #5 have right knee implants.
Table 2.
Excursion of the Medial and Lateral CP on the Tibial Component in the M-L and A-P Directions
| Mediolateral Excursion (mm)
|
||||||
|---|---|---|---|---|---|---|
| Medial CP
|
Lateral CP
|
|||||
| Subject | Gait | Down Stairs | Chair Rise/Sit | Gait | Down Stairs | Chair Rise/Sit |
| 1 | 7.86 | 2.38 | 4.07 | 6.55 | 3.01 | 4.56 |
| 2 | 3.74 | 2.67 | 8.17 | 7.31 | 3.36 | 6.82 |
| 3 | 7.26 | 2.27 | 8.8 | 8.14 | 1.6 | 6.23 |
| 4 | 5.95 | 4.06 | 2.96 | 6.03 | 3.39 | 3.11 |
| 5 | 3.87 | 4.85 | 4.57 | 8.66 | 3.92 | 6.68 |
| 6 | 3.27 | 2.44 | 3.82 | 7.88 | 5.75 | 6.04 |
| Average | 5.33 | 3.11 | 5.4 | 7.43 | 3.51 | 5.57 |
| STDev | 1.97 | 1.08 | 2.46 | 0.99 | 1.35 | 1.45 |
|
| ||||||
| Anteroposterior Excursion (mm) | ||||||
|
| ||||||
| Medial CP
|
Lateral CP
|
|||||
| Subject | Gait | Down Stairs | Chair Rise/Sit | Gait | Down Stairs | Chair Rise/Sit |
|
| ||||||
| 1 | 9.85 | 15.56 | 15.69 | 9.19 | 12.98 | 11.15 |
| 2 | 17.59 | 13.07 | 14.8 | 15.74 | 17.44 | 8.8 |
| 3 | 16.82 | 13.33 | 15.67 | 14.18 | 9.36 | 6.87 |
| 4 | 13.87 | 10.52 | 9.12 | 15.04 | 9.29 | 13.11 |
| 5 | 22.25 | 23.41 | 21.08 | 28.44 | 20.9 | 14.77 |
| 6 | 13.3 | 19.55 | 24.42 | 29.84 | 17.02 | 15.09 |
| Average | 15.61 | 15.91 | 16.8 | 18.74 | 14.5 | 11.63 |
| STDev | 4.27 | 4.76 | 5.33 | 8.39 | 4.73 | 3.31 |
Excursions in gait and walking down stairs do not include swing phase.
Figure 6.
(a) Sample comparison of LP and CP estimates for gait of two subjects. The gray dots represent the CP location during swing phase. Both subjects #2 and #5 have right knee implants. (b) Line connecting the CPs (red) compared to the line connecting the lowest points of the femoral component (blue) at a given flexion angle. The CP angle (α) between the CP line (red) and the ML axis of the tibial component (dashed black) is also shown.
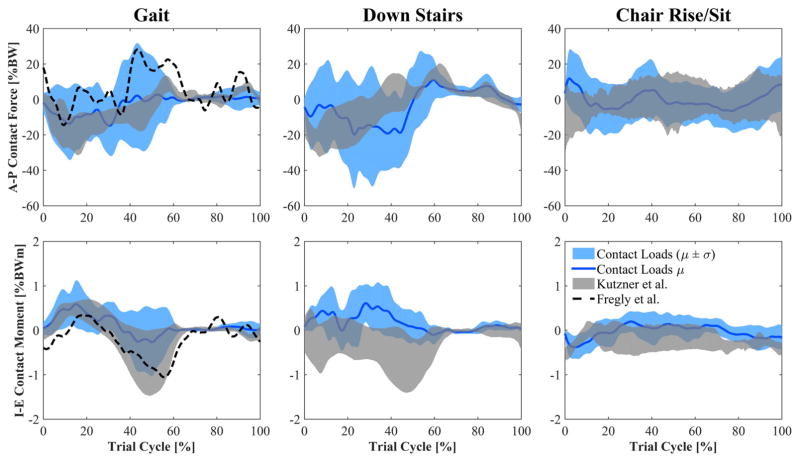
A-P joint load estimated by the FE models was greatest during stair descending in the posterior direction with an average peak of 19.0% BW (Fig. 7). I-E joint moment was highest in gait and stair descending with an average peak of 0.6% BWm in internal rotation (Fig. 7).
Figure 7.
Estimates of A-P contact force and I-E contact moment (mean ± std) acting on the tibia compared to reported measurements using instrumented implants. Events for gait and stair descent: Heel-strike at 0% and 100% of cycle, toe-off at 60–65% of cycle, contralateral heel-strike at 50–55% of cycle.
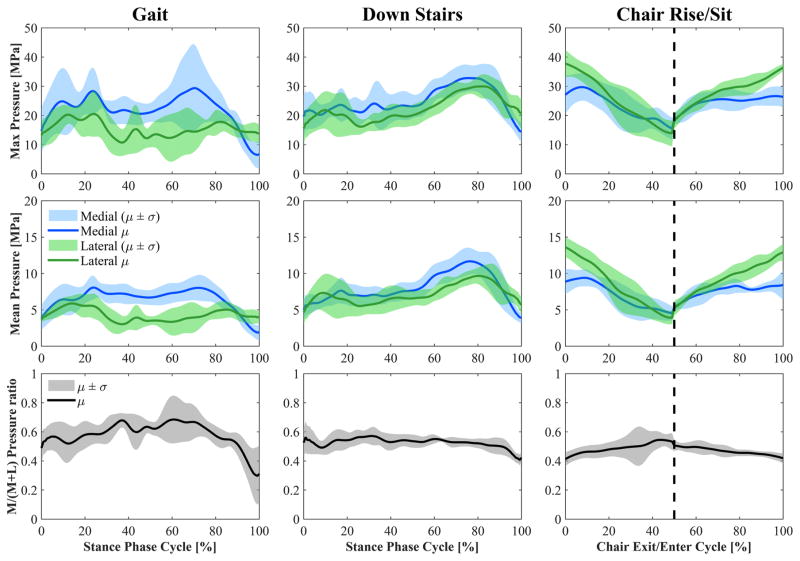
Maximum estimated contact pressure showed a similar pattern to the tibiofemoral contact force applied along the S-I axis of the tibia (Fig. 8). Its peaks occurred when the applied joint reaction force was highest (contralateral heel-strike for gait and stair descent and during the exit and entrance to the chair for the chair rise/sit activity). The highest contact pressure occurred during the chair rise/sit activity (average peak 26.8 MPa) on the lateral plateau.
Figure 8.
Top: Maximum and mean contact pressure on the medial and lateral sides (mean ± std). Bottom: M/(M + L) ratio of maximum contact pressures (mean ± std). M and L are maximum medial and lateral contact pressures, respectively. The dashed vertical line in the two figures on the right divides the figure into chair exit (0–50% of the cycle) and chair entrance (50–100% of the cycle). Events for gait and stair descent: Heel-strike at 0% of stance cycle, toe-off at 100% of stance cycle, contralateral heel-strike at 80–85% of stance cycle.
The ratio between maximum medial and total pressures was generally higher than 50% during gait and stair descent and it was highest during gait with an average peak of 68% (Fig. 8). Conversely, pressure on the lateral side was generally higher than on the medial side during chair rise/sit, with a minimum M/(M + L) ratio of 41%. During walking down stairs, a higher contact pressure was estimated at the second contact force peak in comparison to the first peak although similar compressive forces were applied. This happened at higher flexion angles because a reduction in articulating femoral surface geometry causes a decrease of the contact area, and a consequent increase of contact pressure.
No significant differences (p >0.1) were found when A-P excursions of CP on the tibial insert for different activities were compared with paired sample t-tests. In addition, no significant differences (p >0.1) were found when comparing A-P ranges on the medial and lateral plateaus for each activity.
Results from the sensitivity analysis showed that RMSE for CP location and maximum contact pressure were on average 0.4 mm and 2.1 MPa, respectively. In addition, there were significant differences (p <0.05) in CP centroid location and CP excursions in the A-P direction between the three analyzed subjects in 11 of the 12 comparisons (Fig. 9). RMSE for A-P and I-E contact loads were on average 50 N and 0.70 Nm.
Figure 9.
Results for stair descent of a representative subject included in the sensitivity analysis. Left: CP estimates when A-P measured kinematics was shifted of 0.5 mm in anterior (top) and posterior (bottom) direction. Right: Maximum contact pressure on the lateral side of the insert (top) and A-P contact load (bottom) estimates with baseline and perturbed (± 0.5 mm) kinematics.
DISCUSSION
A method to estimate contact mechanics in a TKA that links whole body and joint-level scales was developed and used to examine knee joint loading and contact mechanics in TKA patients performing multiple activities of daily living. Subject-specific kinematic and ground force measurements were used as input to a musculoskeletal model to calculate tibiofemoral joint reaction force at the implanted knee. Combining these joint load data with precise knee kinematics from fluoroscopy, a finite element model of the implant components was used to estimate subject-specific contact mechanics for three activities. Joint load was greatest during contralateral heel-strike walking down stairs, while contact pressure was greatest during the chair rise/sit activity as the subjects exited and entered the seat. However, the resultant excursion of the CP on the tibial component was similar during each activity and between the medial and lateral sides. The main determinants of CP location were I-E rotation and tibial insert conformity, as indicated by a high correlation between I-E rotation of the joint and CP angle (0.82 on average), and the significant difference between CP and LP due to the anterior and posterior slopes of the insert. Inter-subject differences in CP location were partly explained by corresponding differences in I-E tibiofemoral alignment. In fact, external alignment of the femur with respect to the tibia at full extension resulted in larger CP angles. In all cases, LP calculations underestimated movement of the CP.
There were a number of limitations associated with this investigation. First of all, static optimization was used to estimate muscle forces of the subjects. Although this method is reliable for healthy subjects during gait (muscle forces were comparable in pattern and magnitude to previous reports of muscle forces during walking39,47), no studies have evaluated its accuracy with TKA subjects performing activities such as walking down stairs and chair rising. Notably, static optimization estimated low quadriceps forces at weight acceptance in patients analyzed in this study that adopted movement strategies with reduced extensor demand relative to their normal limb. In addition, good agreement between measurements of joint loads and our estimates provided confidence that the muscle forces were reasonable. Peak contact forces measured with instrumented implants are between 180% and 280% BW during walking, and approximately 350% BW when descending stairs,20,40,48 which agrees with our average peaks of 225% and 340% BW during gait and walking down stairs, respectively. Similarly, studies that calculate contact force by means of musculo-skeletal models report peaks of 200–400% BW during level walking.47,49,50 Only during chair rise/sit did our model appear to overestimate joint reactions when the subjects entered and exited the chair. Studies using instrumented implants report peak forces of 250–260% BW during chair rise/sit, while we found 330% BW in our study. Our V-V moment estimates agree with data collected by means of instrumented implants, showing varus peaks during gait and walking down stairs, and valgus moments when the subjects are exiting and entering the chair.
A second limitation was that the analysis required two separate computational models (musculoskeletal whole-body and FE knee) to estimate subject-specific CP. The two models utilized in this study address two different physical scales and present different complexities. The musculoskeletal model contained a simplified representation of the knee with only one degree of freedom. This simplification is often made in whole body models whose main goal is to estimate muscle forces, muscle moment arms, or muscle lengths.39,47,51 As muscle forces are the major contributor to joint forces, the joint forces estimated by the musculoskeletal model were applied to detailed 6 DOF FE models of the TKA implants. Our results for tibiofemoral contact might be improved if muscle and joint forces, and contact mechanics were calculated in a single modeling framework.
A third limitation was that the FE model of the TKA implants used in this study did not have the same geometry and boundary conditions utilized in previous validation studies.16,24,41,44 Provided contact on the medial and lateral condyles of the femoral component, the locations of the centers of pressure on the medial and lateral sides can be spatially determined by the F-E, A-P, I-E, and M-L kinematics of the joint.16 However, the validation study by Fregly et al.24 found that estimation of joint contact best matched telemetric implant measurements by not prescribing M-L and V-V kinematics, and instead applying subject-specific S-I and V-V load. Following these recommendations, the finite element model of our study was kinematically driven in F-E, I-E, and A-P, while M-L remained free, and S-I and V-V loads were applied. In agreement with the conclusions of Fregly et al.24 and Fitzpatrick et al.,44 the results of the sensitivity analysis showed that use of these boundary conditions provided reliable estimates of contact pressure and location when kinematic uncertainty was considered, whereas contact load estimates were more sensitive to kinematics errors.
A fourth limitation was that tibiofemoral ligaments were not modeled in the finite element simulations. Therefore, contact pressure may have been slightly underestimated because the contribution of ligament force was not included in the overall joint load. This limitation may have also affected the M-L contact pressure shown in Figure 8. In addition, the estimated V-V moment for one subject during gait was reduced with a 0.8 scale factor in order to prevent an unnatural lifting of the lateral femoral condyle that was not seen in the fluoroscopy kinematics. Despite this limitation, contact pressure ratios are consistent with results in the literature. In particular, Halder et al.52 report an average medial load share of 73% at the first axial force peak of gait and 65% at the second axial peak among five patients with instrumented implants. Across individuals medial load share ranged from 55% to 85% at the first peak and 47% to 81% at the second peak. The results of our study present a consistent behavior with average medial pressure ratios of 58% and 67% in correspondence of the two compressive load peaks of the stance phase. To evaluate the impact of V-V moment on contact mechanics, all the simulations were repeated without including the V-V moment at the knee. When V-V moment was applied, the root mean square difference between medial and lateral contact pressure as a percent of maximum pressure was 28.5%, 11.2%, and 11.5% for gait, descending stairs, and chair rise, respectively. With V-V moment removed, these values dropped by more than half to 13.5%, 5.2%, and 4.5%. Therefore, contact pressure differences between medial and lateral sides of the insert were explained mainly by the V-V moment estimated by the musculoskeletal model. Prior work has demonstrated that accurate A-P and I-E joint loads can be estimated from a combination of compressive force and relative tibiofemoral pose, and are further improved with the inclusion of V-V load.24,44 This was illustrated in the current study where estimates of A-P and I-E joint loads showed magnitudes very similar to instrumented implant data (Fig. 7). Temporal trends were similar for gait and for substantial portions of the other activities that were analyzed. Differences with telemetric data in A-P and I-E joint loads can be explained by the different geometries between the implants of the patients in the telemetric studies and those measured here. While compressive and V-V joint loads are mainly determined by ground reaction and muscle forces, the A-P and I-E load directions are strongly influenced by the components geometrical conformity.24,44
Excursion of the CP on the tibial insert was similar across activities. Student’s t-tests were performed to compare the mean of A-P ranges for different activities and no significant differences (p >0.1) were found. This finding is consistent with that of Catani et al. who calculated CP locations with fluoroscopy imaging for 16 patients performing stair-climbing, chair rise/sit, and step-up/down.14 Their calculated A-P excursions are consistent with ours presenting an average of 8.9 mm on the medial plateau and 15.6 mm on the lateral plateau. However, unlike Catani et al., we found no significant differences (p >0.1) comparing A-P ranges on the medial and lateral plateaus. While most other investigations found A-P and M-L ranges on the lateral plateau similar to our results, excursions on the medial plateau are shown to be smaller than those on the lateral side.18,21 This might be explained by differences in the articulating geometry of the tibial insert between the studies. Some TKA geometries are designed to elicit less translation on the medial side, similar to some results shown for the natural knee.17
While excursion of the CP on the tibial component was similar across subjects, the CP location was dependent on subject specific I-E rotation and by the geometrical conformity of the two articulating components. Partly for this reason, CP calculations did not correspond to the location of the LP. In particular, the angle between the line that connects the estimated CP and the M-L axis of the tibial component (see Fig. 6b) closely followed the I-E rotation of the knee. The angle of the CP line was most often magnified relative to the I-E rotation angle of the knee because the contact occurred on the anterior or posterior upslope of the tibial insert.
Activities that generated greater joint load did not have lower excursion. This contradicts the common expectation that as axial joint load is increased, the CP location is pushed closer to the LP of the insert by the conforming geometry of the implant.16 For example, our results showed that the average A-P motion of the CP on the lateral plateau was highest during gait, which is the activity with the lowest compressive load. However, the difference was not statistically significant because a high standard deviation among subjects was also observed.
The combination of experimental data and simulation used in this study is a significant contribution because it enables subject-specific estimation of TKA contact mechanics and its interactions with joint loads during activities of daily living, for a large population not restricted to patients with instrumented implants. Further understanding of interactions between activities, joint loading, and knee component mechanics may lead to improvements in pre-clinical testing of devices and, ultimately, in TKA survivorship and functional performance.
Acknowledgments
This study was supported by DePuy Synthes and NIH NIBIB R01 EB015497. One or more of the authors (P.R. and R.L.) has received funding from DePuy Synthes. One author (P.R.) is a consultant to DePuy Synthes.
Grant sponsor: DePuy Synthes; Grant sponsor: NIH NIBIB; Grant number: R01 EB015497.
Footnotes
AUTHORS’ CONTRIBUTIONS
Contributions to authorship are as follows: Alessandro Navacchia: Production of musculoskeletal FE analyses, and primary author. Paul J. Rullkoetter: Supervision of FE modeling, revision, and approval of the manuscript. Pascal Schütz: Collection and processing of the experimental data. Renate B. List: Collection and processing of the experimental data, manuscript review. Clare K. Fitzpatrick: Assistance with FE analyses, revision of the manuscript. Kevin B. Shelburne: Project research design, assistance with writing of the manuscript, overall supervision, and approval of final versions. All authors have read and approved the final submitted manuscript.
References
- 1.Kurtz SM, Ong KL, Lau E, et al. International survey of primary and revision total knee replacement. Int Orthop. 2011;35:1783–1789. doi: 10.1007/s00264-011-1235-5. [DOI] [PMC free article] [PubMed] [Google Scholar]
- 2.Nam D, Nunley RM, Barrack RL. Patient dissatisfaction following total knee replacement: a growing concern? Bone Joint J. 2014;96-B:96–100. doi: 10.1302/0301-620X.96B11.34152. [DOI] [PubMed] [Google Scholar]
- 3.Ghomrawi HM, Kane RL, Eberly LE, et al. Patterns of functional improvement after revision knee arthroplasty. J Bone Joint Surg Am. 2009;91:2838–2845. doi: 10.2106/JBJS.H.00782. [DOI] [PubMed] [Google Scholar]
- 4.Weir LM, Pfuntner A, Maeda J, et al. Agency for Healthcare Research and Quality; Rockville, MD: 2011. [Google Scholar]
- 5.Kurtz S, Ong K, Lau E, et al. Projections of primary and revision hip and knee arthroplasty in the United States from 2005 to 2030. J Bone Joint Surg Am. 2007;89:780–785. doi: 10.2106/JBJS.F.00222. [DOI] [PubMed] [Google Scholar]
- 6.Laz PJ, Pal S, Fields A, et al. Effects of knee simulator loading and alignment variability on predicted implant mechanics: a probabilistic study. J Orthop Res. 2006;24:2212–2221. doi: 10.1002/jor.20254. [DOI] [PubMed] [Google Scholar]
- 7.McEwen HM, Barnett PI, Bell CJ, et al. The influence of design, materials and kinematics on the in vitro wear of total knee replacements. J Biomech. 2005;38:357–365. doi: 10.1016/j.jbiomech.2004.02.015. [DOI] [PubMed] [Google Scholar]
- 8.Fitzpatrick CK, Clary CW, Laz PJ, et al. Relative contributions of design, alignment, and loading variability in knee replacement mechanics. J Orthop Res. 2012;30:2015–2024. doi: 10.1002/jor.22169. [DOI] [PubMed] [Google Scholar]
- 9.Clary CW, Fitzpatrick CK, Maletsky LP, et al. The influence of total knee arthroplasty geometry on mid-flexion stability: an experimental and finite element study. J Biomech. 2013;46:1351–1357. doi: 10.1016/j.jbiomech.2013.01.025. [DOI] [PubMed] [Google Scholar]
- 10.Jones DP, Locke C, Pennington J, et al. The effect of sagittal laxity on function after posterior cruciate-retaining total knee replacement. J Arthroplasty. 2006;21:719–723. doi: 10.1016/j.arth.2005.08.019. [DOI] [PubMed] [Google Scholar]
- 11.Mahoney OM, McClung CD, dela Rosa MA, et al. The effect of total knee arthroplasty design on extensor mechanism function. J Arthroplasty. 2002;17:416–421. doi: 10.1054/arth.2002.32168. [DOI] [PubMed] [Google Scholar]
- 12.Harman MK, DesJardins J, Benson L, et al. Comparison of polyethylene tibial insert damage from in vivo function and in vitro wear simulation. J Orthop Res. 2009;27:540–548. doi: 10.1002/jor.20743. [DOI] [PubMed] [Google Scholar]
- 13.Sharma A, Dennis DA, Zingde SM, et al. Femoral condylar contact points start and remain posterior in high flexing patients. J Arthroplasty. 2014;29:945–949. doi: 10.1016/j.arth.2013.09.037. [DOI] [PubMed] [Google Scholar]
- 14.Catani F, Ensini A, Belvedere C, et al. In vivo kinematics and kinetics of a bi-cruciate substituting total knee arthroplasty: a combined fluoroscopic and gait analysis study. J Orthop Res. 2009;27:1569–1575. doi: 10.1002/jor.20941. [DOI] [PubMed] [Google Scholar]
- 15.Sharma A, Komistek RD, Ranawat CS, et al. In vivo contact pressures in total knee arthroplasty. J Arthroplasty. 2007;22:404–416. doi: 10.1016/j.arth.2006.07.008. [DOI] [PubMed] [Google Scholar]
- 16.Catani F, Innocenti B, Belvedere C, et al. The Mark Coventry Award: articular contact estimation in TKA using in vivo kinematics and finite element analysis. Clin Orthop Relat Res. 2010;468:19–28. doi: 10.1007/s11999-009-0941-4. [DOI] [PMC free article] [PubMed] [Google Scholar]
- 17.Li G, DeFrate LE, Park SE, et al. In vivo articular cartilage contact kinematics of the knee: an investigation using dual-orthogonal fluoroscopy and magnetic resonance image-based computer models. Am J Sports Med. 2005;33:102–107. doi: 10.1177/0363546504265577. [DOI] [PubMed] [Google Scholar]
- 18.Li G, Suggs J, Hanson G, et al. Three-dimensional tibiofemoral articular contact kinematics of a cruciate-retaining total knee arthroplasty. J Bone Joint Surg Am. 2006;88:395–402. doi: 10.2106/JBJS.D.03028. [DOI] [PubMed] [Google Scholar]
- 19.D’Lima DD, Fregly BJ, Colwell CW., Jr Implantable sensor technology: measuring bone and joint biomechanics of daily life in vivo. Arthritis Res Ther. 2013;15:203. doi: 10.1186/ar4138. [DOI] [PMC free article] [PubMed] [Google Scholar]
- 20.Fregly BJ, Besier TF, Lloyd DG, et al. Grand challenge competition to predict in vivo knee loads. J Orthop Res. 2012;30:503–513. doi: 10.1002/jor.22023. [DOI] [PMC free article] [PubMed] [Google Scholar]
- 21.Varadarajan KM, Moynihan AL, D’Lima D, et al. In vivo contact kinematics and contact forces of the knee after total knee arthroplasty during dynamic weight-bearing activities. J Biomech. 2008;41:2159–2168. doi: 10.1016/j.jbiomech.2008.04.021. [DOI] [PMC free article] [PubMed] [Google Scholar]
- 22.Fitzpatrick CK, Komistek RD, Rullkoetter PJ. Developing simulations to reproduce in vivo fluoroscopy kinematics in total knee replacement patients. J Biomech. 2014;47:2398–2405. doi: 10.1016/j.jbiomech.2014.04.024. [DOI] [PubMed] [Google Scholar]
- 23.Zhao D, Banks SA, D’Lima DD, et al. In vivo medial and lateral tibial loads during dynamic and high flexion activities. J Orthop Res. 2007;25:593–602. doi: 10.1002/jor.20362. [DOI] [PubMed] [Google Scholar]
- 24.Fregly BJ, Banks SA, D’Lima DD, et al. Sensitivity of knee replacement contact calculations to kinematic measurement errors. J Orthop Res. 2008;26:1173–1179. doi: 10.1002/jor.20548. [DOI] [PubMed] [Google Scholar]
- 25.Cram P, Lu X, Kates SL, et al. Total knee arthroplasty volume, utilization, and outcomes among Medicare beneficiaries, 1991–2010. JAMA. 2012;308:1227–1236. doi: 10.1001/2012.jama.11153. [DOI] [PMC free article] [PubMed] [Google Scholar]
- 26.Mizner RL, Snyder-Mackler L. Altered loading during walking and sit-to-stand is affected by quadriceps weakness after total knee arthroplasty. J Orthop Res. 2005;23:1083–1090. doi: 10.1016/j.orthres.2005.01.021. [DOI] [PubMed] [Google Scholar]
- 27.Stevens-Lapsley JE, Balter JE, Wolfe P, et al. Relationship between intensity of quadriceps muscle neuro-muscular electrical stimulation and strength recovery after total knee arthroplasty. Phys Ther. 2012;92:1187–1196. doi: 10.2522/ptj.20110479. [DOI] [PMC free article] [PubMed] [Google Scholar]
- 28.Christiansen CL, Bade MJ, Weitzenkamp DA, et al. Factors predicting weight-bearing asymmetry 1 month after unilateral total knee arthroplasty: a cross-sectional study. Gait Posture. 2013;37:363–367. doi: 10.1016/j.gaitpost.2012.08.006. [DOI] [PMC free article] [PubMed] [Google Scholar]
- 29.Noble JW, Prentice SD. Adaptation to unilateral change in lower limb mechanical properties during human walking. Exp Brain Res. 2006;169:482–495. doi: 10.1007/s00221-005-0162-3. [DOI] [PubMed] [Google Scholar]
- 30.Foresti M. Doctoral Dissertation. Eidgenössische Technische Hochschule (ETH); Zurich, Nr 18368: 2009. In vivo measurement of total knee joint replacement kinematics and kinetics during stair descent. [Google Scholar]
- 31.Burckhardt KV. Doctoral Dissertation. Eidgenössische Technische Hochschule (ETH); Zurich, Nr. 14262: 2001. Locating implants with respect to the bone in diagnostic X-ray images of the pelvis. [Google Scholar]
- 32.Delp SL, Anderson FC, Arnold AS, et al. OpenSim: open-source software to create and analyze dynamic simulations of movement. IEEE Trans Biomed Eng. 2007;54:1940–1950. doi: 10.1109/TBME.2007.901024. [DOI] [PubMed] [Google Scholar]
- 33.Navacchia A, Myers CA, Rullkoetter PJ, et al. Prediction of in vivo knee joint loads using a global probabilistic analysis. J Biomech Eng. 2016 doi: 10.1115/1.4032379. (Forthcoming) [DOI] [PMC free article] [PubMed] [Google Scholar]
- 34.Thelen DG. Adjustment of muscle mechanics model parameters to simulate dynamic contractions in older adults. J Biomech Eng. 2003;125:70–77. doi: 10.1115/1.1531112. [DOI] [PubMed] [Google Scholar]
- 35.DeMers MS, Pal S, Delp SL. Changes in tibiofemoral forces due to variations in muscle activity during walking. J Orthop Res. 2014;32:769–776. doi: 10.1002/jor.22601. [DOI] [PMC free article] [PubMed] [Google Scholar]
- 36.Krevolin JL, Pandy MG, Pearce JC. Moment arm of the patellar tendon in the human knee. J Biomech. 2004;37:785–788. doi: 10.1016/j.jbiomech.2003.09.010. [DOI] [PubMed] [Google Scholar]
- 37.Arnold EM, Ward SR, Lieber RL, et al. A model of the lower limb for analysis of human movement. Ann Biomed Eng. 2010;38:269–279. doi: 10.1007/s10439-009-9852-5. [DOI] [PMC free article] [PubMed] [Google Scholar]
- 38.Buford WL, Jr, Ivey FM, Jr, Malone JD, et al. Muscle balance at the knee: moment arms for the normal knee and the ACL-minus knee. IEEE Trans Rehabil Eng. 1997;5:367–379. doi: 10.1109/86.650292. [DOI] [PubMed] [Google Scholar]
- 39.Anderson FC, Pandy MG. Static and dynamic optimization solutions for gait are practically equivalent. J Biomech. 2001;34:153–161. doi: 10.1016/s0021-9290(00)00155-x. [DOI] [PubMed] [Google Scholar]
- 40.Bergmann G, Bender A, Graichen F, et al. Standardized loads acting in knee implants. PLoS ONE. 2014;9:e86035. doi: 10.1371/journal.pone.0086035. [DOI] [PMC free article] [PubMed] [Google Scholar]
- 41.Halloran JP, Petrella AJ, Rullkoetter PJ. Explicit finite element modeling of total knee replacement mechanics. J Biomech. 2005;38:323–331. doi: 10.1016/j.jbiomech.2004.02.046. [DOI] [PubMed] [Google Scholar]
- 42.Godest AC, Beaugonin M, Haug E, et al. Simulation of a knee joint replacement during a gait cycle using explicit finite element analysis. J Biomech. 2002;35:267–275. doi: 10.1016/s0021-9290(01)00179-8. [DOI] [PubMed] [Google Scholar]
- 43.Grood ES, Suntay WJ. A joint coordinate system for the clinical description of three-dimensional motions: application to the knee. J Biomech Eng. 1983;105:136–144. doi: 10.1115/1.3138397. [DOI] [PubMed] [Google Scholar]
- 44.Fitzpatrick CK, Rullkoetter PJ. Estimating total knee replacement joint load ratios from kinematics. J Biomech. 2014;47:3003–3011. doi: 10.1016/j.jbiomech.2014.07.002. [DOI] [PubMed] [Google Scholar]
- 45.You BM, Siy P, Anderst W, et al. In vivo measurement of 3-D skeletal kinematics from sequences of biplane radiographs: application to knee kinematics. IEEE Trans Med Imaging. 2001;20:514–525. doi: 10.1109/42.929617. [DOI] [PubMed] [Google Scholar]
- 46.Banks SA, Fregly BJ, Boniforti F, et al. Comparing in vivo kinematics of unicondylar and bi-unicondylar knee replacements. Knee Surg Sports Traumatol Arthrosc. 2005;13:551–556. doi: 10.1007/s00167-004-0565-x. [DOI] [PubMed] [Google Scholar]
- 47.Sasaki K, Neptune RR. Differences in muscle function during walking and running at the same speed. J Biomech. 2006;39:2005–2013. doi: 10.1016/j.jbiomech.2005.06.019. [DOI] [PubMed] [Google Scholar]
- 48.Kutzner I, Heinlein B, Graichen F, et al. Loading of the knee joint during activities of daily living measured in vivo in five subjects. J Biomech. 2010;43:2164–2173. doi: 10.1016/j.jbiomech.2010.03.046. [DOI] [PubMed] [Google Scholar]
- 49.Taylor WR, Heller MO, Bergmann G, et al. Tibio-femoral loading during human gait and stair climbing. J Orthop Res. 2004;22:625–632. doi: 10.1016/j.orthres.2003.09.003. [DOI] [PubMed] [Google Scholar]
- 50.Shelburne KB, Torry MR, Pandy MG. Muscle, ligament, and joint-contact forces at the knee during walking. Med Sci Sports Exerc. 2005;37:1948–1956. doi: 10.1249/01.mss.0000180404.86078.ff. [DOI] [PubMed] [Google Scholar]
- 51.Anderson FC, Pandy MG. Individual muscle contributions to support in normal walking. Gait Posture. 2003;17:159–169. doi: 10.1016/s0966-6362(02)00073-5. [DOI] [PubMed] [Google Scholar]
- 52.Halder A, Kutzner I, Graichen F, et al. Influence of limb alignment on mediolateral loading in total knee replacement: in vivo measurements in five patients. J Bone Joint Surg Am. 2012;94:1023–1029. doi: 10.2106/JBJS.K.00927. [DOI] [PubMed] [Google Scholar]


