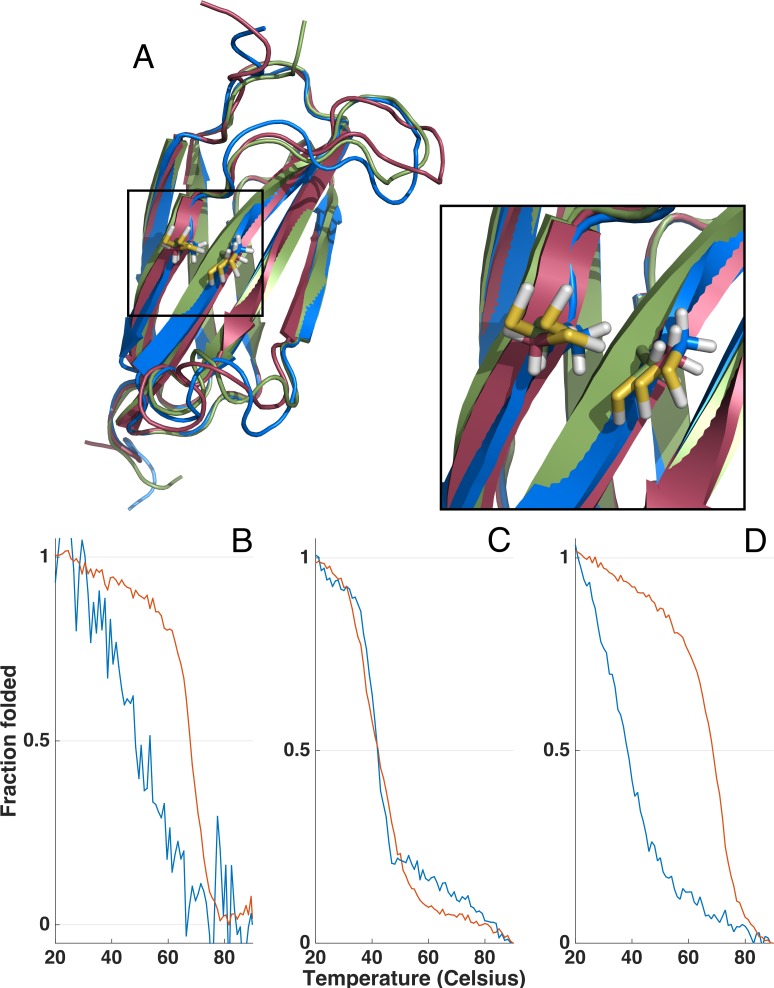
Figure 5. Homology models and thermal unfolding of the FnIII domains from the FLRT family as monitored by the CD signal at 228.5 nm, normalized to vary between 1 and 0 for the initial and final data point in each series.
The I-TASSER server (Yang et al., 2014) was used to predict the topology and the location of the two cysteins located in the FnIII domains of FLRT1 (blue), FLRT2 (green) and FLRT3 (red) (A). In all the I-TASSER modelled FLRT-FnIII domains the two cysteines are located in closed vicinity on each β stand (F and G) (A, zoom in). For FLRT1-FnIII (B) and FLRT3-FnIII (D) there is a large difference in thermal unfolding curves in the presence (blue line) and absence (red line) of reducing agent, DTT. In contrast, thermal unfolding of FLRT2-FnIII is not affected by DTT (C) as for FLRT1-FnIII and FLTR3-FnIII.

