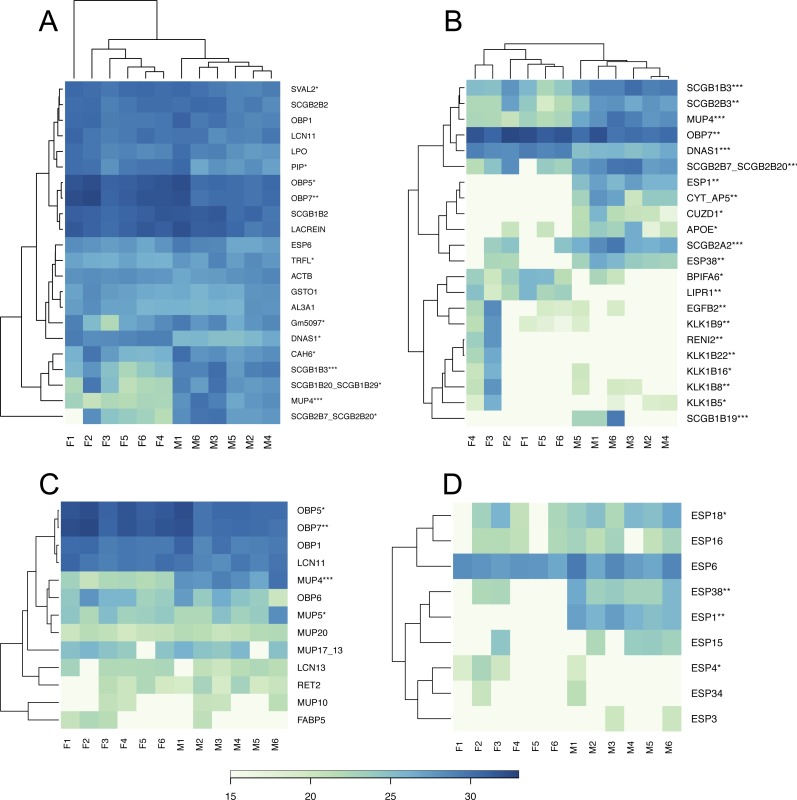
Figure 2. Graphical representations of individual variation in protein abundances with heat maps.
Similarities between proteins and individuals were detected with a hierarchical clustering method: (A) the top 5% of highly expressed proteins include OBPs, SCGBs/ABPs, and ESPs; (B) the top 5% of the most significant sexually dimorphic proteins (p < 0.02) include ESPs, secretoglobins, lipocalins and female-biased antimicrobial protein BPIFA6. There is a notable variation between individuals in lipocalin (C) and ESP (D) abundances. Note that the expression of MUP20/Darcin is invariant over individuals. Asterisks represent: * P ≤ 0.05, ** P ≤ 0.01, *** P ≤ 0.001).

