Abstract
Objective
To determine if constipation predominant IBS (IBS-C) is associated with changes in intestinal barrier and secretory function.
Design
19 IBS-C patients and 18 healthy volunteers (all females) underwent saccharide excretion assay (0.1 g 13C mannitol and 1 g lactulose), measurements of duodenal and colonic mucosal barrier (transmucosal resistance (TMR), macromolecular and E. coli Bio-Particle translocation), mucosal secretion (basal and ACh evoked short circuit current, Isc), in vivo duodenal mucosal impedance, circulating endotoxins and colonic tight junction gene expression.
Results
There were no differences in the in vivo measurements of barrier function between IBS-C and healthy: cumulative excretion of 13C mannitol (0–2 hr mean (SEM); IBS-C: 12.1 (0.9) mg vs healthy: 13.2 (0.8) mg) and lactulose (8–24 hr; IBS-C: 0.9 (0.5) mg vs healthy: 0.5 (0.2) mg); duodenal impedance IBS-C: 729 (65) Ω vs healthy: 706 (43) Ω; plasma mean endotoxin activity level IBS-C: 0.36 (0.03) vs healthy: 0.35 (0.02); and in colonic mRNA expression of occludin, ZO 1–3, and claudins 1–12, 14–19. Ex vivo findings were consistent, with no group differences: duodenal TMR (IBS-C: 28.2 (1.9) Ω*cm2 vs healthy: 29.8 (1.9) Ω*cm2) and colonic TMR (IBS-C: 19.1 (1.1) Ω*cm2 vs healthy: 17.6 (1.7) Ω*cm2); FITC Dextran (4 kDa) and E. coli Bio- Particle flux. Colonic basal Isc was similar, however, duodenal basal Isc was lower in IBS-C (43.5 (4.5) µA*cm2) vs healthy (56.9 (4.9) µA*cm2), p=0.05. ACh evoked ΔIsc was similar.
Conclusions
Females with IBS-C have normal colonic barrier and secretory function. Basal duodenal secretion is decreased in IBS-C.
INTRODUCTION
Irritable bowel syndrome (IBS) is a common and chronic gastrointestinal disorder that results in significant morbidity and health-care utilization. Although several peripheral and central mechanisms have been shown to play a role, the pathophysiology of IBS remains to be clarified [1]. More recently, an increase in intestinal permeability has been shown to be present in a subset of patients with diarrhea predominant IBS and was found to correlate with visceral sensitivity and symptom severity [2].
Paracellular permeability is primarily regulated by the tight junctions (TJ) composed of integral membrane (claudins, occludin), and structural binding proteins {zonula occludens (ZO)}. Most of the existing literature reporting increased intestinal permeability in IBS focuses on diarrhea predominant IBS (IBS-D) or post-infectious IBS which is usually IBS-D or mixed IBS (IBS-M). Little is known about intestinal permeability alterations in IBS-C. Two studies reported increased flux of fluorescein-5.6 sulfonic acid (478 Dalton) across colonic biopsies of IBS-C patients (number of subjects: 3 & 10) as compared to healthy subjects [3, 4]. Another study showed that colonic biopsy supernatant of all IBS subtypes reduced transepithelial resistance and increased flux of FITC-dextran (4 kDa) across Caco-2 monolayers [3]. Colonic epithelial protein expression of occludin was found to be decreased in small studies of patients with IBS-C [5, 6]. Another study showed unchanged claudin-1 protein expression in IBS-C as compared to healthy individuals [7]. In vivo measurements of intestinal permeability using urinary excretion of orally ingested, poorly-absorbable saccharides have also shown variable results in IBS-C. One study has shown increased permeability using polyethylene glycol (PEG) 3350/400 [8], another using PEG 400/1500/4000 showed no difference [9] and one using 51Cr-EDTA showed decreased permeability [10]. Variability in timing of urine collection and dietary contamination often limits interpretation from these in vivo assays.
In a validation study using lactulose and mannitol, cumulative collections between 0–2 hr and 8–24 hr were found to be most reflective of small bowel and colonic permeability respectively [11]. Additionally, we have noted that, up to 30% of participants can have a high baseline (prior to administration of the test dose) presence of mannitol which can interfere with the test performance. Our studies showed that 13C mannitol has better performance characteristics and can be used as a novel saccharide for measurement of intestinal permeability [12]. Mucosal secretory function has not been studied in IBS-C.
The overall objective of this study was to use a comprehensive and comparative methodological approach to determine changes in mucosal barrier and secretory functions in females patients with IBS-C compared to healthy volunteers. Specific goals were to compare in vivo permeability, in vivo mucosal impedance, ex vivo duodenal and colonic mucosal barrier function, mucosal bacterial translocation and circulating endotoxemia in females with IBS-C in comparison to healthy volunteers. Additionally, we investigated baseline and acetylcholine (ACh) evoked mucosal secretory properties and colonic TJ gene expression in IBS-C in comparison to healthy volunteers.
METHODS
Subjects
The study population consisted of 19 Rome III IBS-C patients and 18 healthy volunteers (without a history of IBS or any other gastrointestinal disorder). All participants were females and the controls were age-matched to IBS-C cases. Neither population had history of abdominal surgery (except appendectomy or cholecystectomy), inflammatory bowel disease, microscopic colitis, or celiac disease nor were they pregnant at the time of the study. Additional exclusion criteria included use of tobacco (within six months of the study), NSAIDs (within one week of the study), or oral corticosteroids (within 6 weeks of the study). Participants were also excluded if they scored higher than 8 for anxiety or depression on a hospital anxiety and depression scale (HADS). None of the participants were on a Type 2 chloride channel activator, guanylate cyclase C agonist or 5 HT4 agonist at the time of the study. The IBS-C participants completed IBS-symptom severity scale (IBS-SSS)[13], IBS-quality of life (IBS-QoL)[14], and somatic symptom checklist. The study was approved by the Institutional Review Board at Mayo Clinic and all subjects provided written informed consent before participation. The study was listed on ClinicalTrials.gov (NCT02246647).
In vivo intestinal permeability
Saccharide excretion assay
We used a recently developed assay for in vivo measurement of intestinal permeability using 13C mannitol and lactulose [12]. Volunteers were instructed to not consume artificial sweeteners such as Splenda (sucralose), Nutrasweet (aspartame), lactulose or mannitol for two days prior to permeability testing. They were orally administered 1000 mg lactulose, 100 mg 12C (regular) mannitol, and 100 mg 13C mannitol dissolved in 250 mL of water. Urine samples were collected at baseline (prior to test saccharide administration), 0–2, 2–8, and 8–24 hours post saccharide administration. High performance liquid chromatography-tandem mass spectrometry (HPLC-MS) was used to measure saccharide concentrations as previously described [12]. Cumulative concentrations were calculated using the overall urine volume excreted in the individual intervals. Concentrations of 13C were adjusted for the percentage of 13C in 12C mannitol (4.98% of 12C mannitol excreted was subtracted from 13C mannitol values; determined by analyzing replicate samples of control urine). Cumulative lactulose or 13C mannitol concentrations between 0–2 hr and 8–24 hr were used for determination of small bowel and colonic permeability respectively. Respective lactulose to 13C mannitol excretion ratios, as a measure of dose of saccharide administered, were calculated for the 0–2 hr and 8–24 hr intervals.
Duodenal Impedance
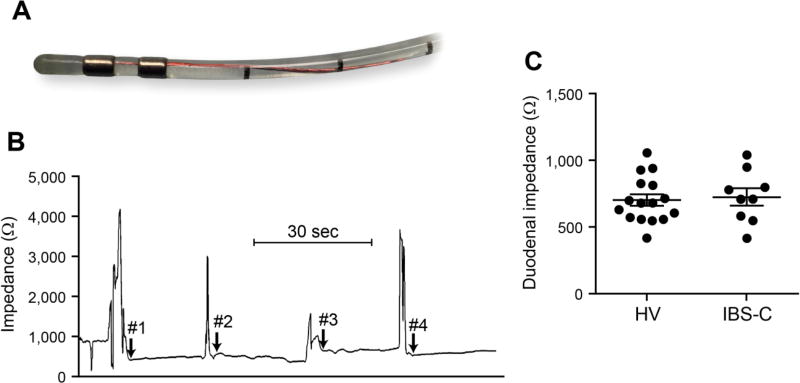
All participants fasted for eight hours and underwent sedated esophagogastroduodenoscopy. Duodenal impedance measurements were performed using a recently designed endoscopically passed catheter that measures electrical impedance of the duodenal epithelium by mucosal contact under direct visualization [15]. A 2 mm diameter catheter was used with two 360° circumferential sensors placed at a separation of 2 mm with the end of the distal ring being 1 mm away from the catheter tip. The electrodes were connected to an impedance voltage transducer via thin wires, which ran the length of the catheter traversing through the working channel of the upper endoscope. The voltage generated by the transducer was limited to produce 10 µA current at a frequency of 2 kHz. Impedance measurements were expressed in Ω as the ratio of voltage to the current. Data were acquired with a stationary impedance data acquisition system (InSight; Sandhill Scientific Inc) and were analyzed by using BioView analysis software (Sandhill Scientific Inc). Impedance was measured every 90° in duodenal circumference with a decompressed lumen after suctioning of all fluid from the lumen. The catheter was embedded in the mucosa parallel to the two sensors and measurements were taken from a steady baseline for >10 seconds. Average of the 4 values was calculated for each patient.
Endotoxemia Activity Assay (EAA™)
Fasting, EDTA anti-coagulated, whole blood was collected from all participants. Samples were analyzed using an EAA kit (Spectral Diagnostic Inc, Toronto, Ontario, Canada) that utilizes a monoclonal IgM antibody specific for gram-negative bacterial lipopolysaccharide (LPS). Samples were tested in duplicate within one hour of collection using a Berthold SmartLine luminometer (photon-counting). The endotoxin activity level was calculated as follows: chemiluminescence (test sample-negative control)/chemiluminescence (positive-negative control). Average values for each participant were expressed as absolute units.
Ex vivo mucosal barrier function
Biopsy Collection
Ten duodenal biopsies were obtained from the second portion of the duodenum. At the same setting, all participants underwent a flexible sigmoidoscopy and ten biopsies were obtained from the sigmoid colon approximately 30 cm from the anal verge. All endoscopic procedures were done by a single endoscopist (MG) and biopsies were collected using a large capacity (2.8 mm) biopsy forceps (no pin). Three biopsies from each site were placed in RNAlater stabilization solution (Life Technologies, Carlsbad, CA, USA) and flash frozen in liquid nitrogen. Two were placed in fixatives (formalin, 4% paraformaldehyde). The rest of the biopsies were placed in Krebs solution, on ice, for Ussing chamber studies. Biopsies were immediately transported from the Clinical Research and Trials Unit to the laboratory.
Ussing Chamber Studies
Ussing chamber studies were performed to measure duodenal and colonic mucosal barrier function, bacterial translocation, and secretory responses. Four biopsies from each site were mounted in 4 mL Ussing chambers (Physiologic Instruments, San Diego, CA, USA) exposing 0.031 cm2 area, within 45 min of collection. Chambers were filled with Krebs with 10 mM mannitol (mucosal side) and Krebs with 10 mM glucose (submucosal side). Further details on drugs and solutions are provided in Supplementary methods. Baseline transmucosal resistance (TMR) and short circuit current (Isc) of each tissue was measured using a pair of Ag/AgCl electrodes with agar-salt bridges and a pair of current-giving platinum electrodes to maintain voltage clamp conditions. Average TMR and Isc across 3–4 biopsies/subject were calculated. Secretory responses to basolateral ACh (0.01 µM–300 µM) was measured as the change in Isc (ΔIsc) in 1–2 biopsies/site for each subject. A positive ΔIsc indicated an anion flux into the lumen or a cation flux from luminal to serosal side. Biopsies with baseline TMR <10 Ω*cm2, Isc drift of >100 µA*cm2 over the experimental course, or high flux within 30 min of mounting were excluded from the analysis.
Paracellular flux across biopsies was measured using 4 kDa FITC-Dextran administered on the mucosal side (1 mg/mL chamber concentration). Transcellular transport was studied by using translocation of the fluorescently labeled E. coli K-12 Bio-Particles was measured using a 107 CFU/mL chamber concentration on the mucosal side. Sampling was done from the submucosal side every 30 minutes for a total of 3 hours and cumulative fluorescence was measured using a Synergy Multi-Mode Microplate Reader (BioTek, VT, USA) and converted to concentration using standard curves. Cumulative flux at the end of three hours and rate of flux was calculated for FITC-Dextran and E. coli K-12 Bio-Particles. At the end of the experiment, tissue was treated with 10 µM forskolin (activates adenylyl cyclase and increases intracellular cAMP) on apical side to check for tissue responsiveness. A representative duodenal and colonic biopsy from each patient was stained with H&E to ensure normal gross morphology.
Tight Junction Gene Expression
RNA was extracted from freshly frozen colonic tissue using the RNeasy® Plus Mini Kit (Qiagen, Hilden, Germany) from all IBS-C patients and 10 healthy volunteers. Synthesis of cDNA from RNA was performed with an RT2 First Strand cDNA Kit (Qiagen, Hilden, Germany). Polymerase chain reaction (PCR) was performed using an RT2 Profiler PCR Array for 84 human TJ genes (Qiagen, Hilden, Germany). Gene expression was normalized by arithmetic mean to the control gene, GAPDH. Since the array tested for 84 genes, statistical significance level was corrected for multiple comparisons using Bonferroni correction and a p value of < 0.0006 was considered significant. All samples tested had a RNA integrity value (RIN) value of > 8.
Statistical Analysis
Means and standard errors are reported for continuous variables, while frequencies and percentages are reported for categorical variables. Two-sided Mann-Whitney U-test assuming non Gaussian distribution was used to compare variables between the two groups. Spearman correlations (non-parametric) were used to analyze relationship between the TMR and FITC-dextran flux. All analyses were done using the GraphPad Prism 7 (GraphPad Software, San Diego, CA, USA). A p-value of < 0.05 was considered statistically significant unless otherwise specified. The sample size calculations were based on in vivo permeability parameters as primary endpoint. Based upon pooled data from IBS patients and healthy volunteers, 18 subjects/group allow 17% effect size detection for 0–2 hr cumulative excretion of mannitol, 19% effect size detection for 8–24 hr cumulative excretion of mannitol and 30% for 8–24 hr cumulative excretion of lactulose. Effect size is the difference between two groups as a percentage of the listed mean value, based on a two-sample t-test using a 2-sided alpha level of 0.05 and all estimates were based on 80% power.
RESULTS
Participant characteristics
Table 1 shows demographic characteristics of study participants. All subjects were white. Anxiety and depression scores were low and comparable between the two groups. The mean (SEM) IBS-SSS was 206 (18) on a 0–500 scale (with 500 being most severe symptoms, 175–300 categorized as moderate severity). The IBS-C cohort also scored low to moderate for quality of life impairment (mean IBS-QoL 32, 0–100 scale) and somatization (mean somatic symptom checklist score 0.6, 0–4 scale).
Table 1.
Demographic characteristics of IBS-C patients and healthy volunteers
| IBS-C | Healthy | |
|---|---|---|
| Age, years: mean ± SEM | 45.37 ± 2.82 | 43.06 ± 2.78 |
| IBS-SSS | 206.74 ± 18.05 | - |
| HADS Anxiety Score, mean (SEM) | 3.37 ± 0.49 | 2.61 ± 0.52 |
| HADS Depression Score, mean (SEM) | 1.05 ± 0.40 | 0.39 ± 0.14 |
| IBS-QOL | 32.29 ± 2.62 | - |
| Somatization score | 0.61 ± 0.11 | - |
In vivo permeability
Baseline lactulose was undetectable in both IBS-C and healthy. Cumulative baseline excretions for 13C mannitol were significantly lower than 12C mannitol in both healthy (13C mannitol: 0.06 (0.03) mg vs 12C mannitol: 6.1 (1.8) mg, p < 0.0001) (Supplementary Figure 1A) and IBS-C (13C mannitol: 0.009 (0.007) vs 12C mannitol: 3.87 (1.09), p < 0.0001) (Supplementary Figure 1B). Of note, there were 5 participants in IBS-C and 6 participants in the control group with a baseline urinary quantity of > 5 mg of 12C mannitol. Similar observations were made in our previously published study [12]. Hence, we used 13C mannitol excretions as our primary measurement.
Cumulative excretion of probe molecules 0–2h after ingestion
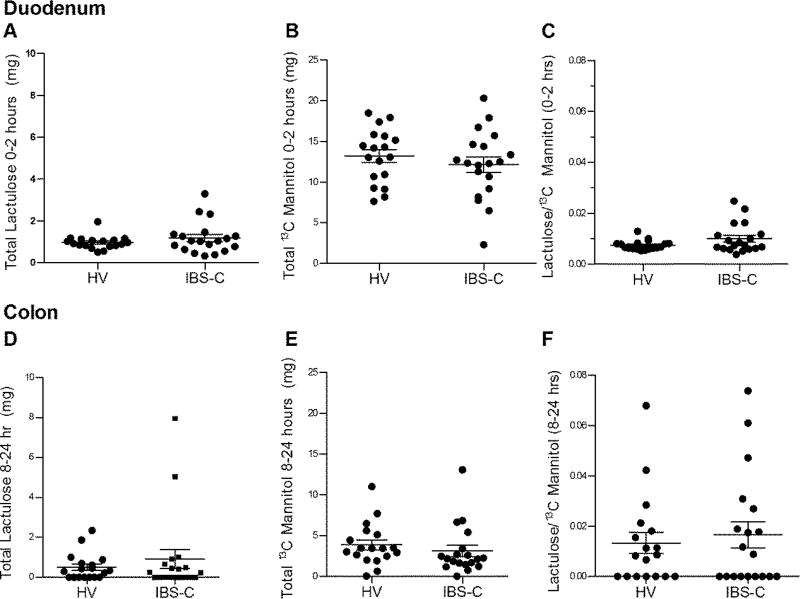
The cumulative 0–2 hr excretion of lactulose (IBS-C: 1.17 (0.18) mg vs healthy: 0.95 (0.07) mg, p=0.53), 13C mannitol (IBS-C: 12.12 (0.97) mg vs healthy: 13.20 (0.79) mg, p=0.39), and lactulose/13C mannitol excretion ratio (IBS-C: 0.01 (0.001) vs healthy: 0.007 (0.0004), p=0.25) were similar between IBS-C and healthy (Figure 1A–C). Therefore, small bowel permeability was unchanged in IBS-C.
Figure 1.
In vivo permeability assessment using saccharide excretion assay. Panels (A–C) reflect small intestine (0–2 hours post-test saccharide administration) and (D–F) reflect colon (8–24 hours post-test saccharide administration). (A) Cumulative lactulose excretion. (B) Cumulative 13C mannitol excretion. (C) Lactulose/13C mannitol ratio expressed as percentage of administered dose for each volunteer. Panels D–F are corresponding cumulative excretion values and Lactulose/13C mannitol ratio for colon. Data are presented as mean ± SEM. HV n=18, IBS-C n =19.
Cumulative excretion of probe molecules 8–24h after ingestion
The cumulative 8–24 hr excretion of lactulose (IBS-C: 0.92 (0.47) mg vs healthy: 0.51 (0.16) mg, p=0.75), 13C mannitol (IBS-C: 3.12 (0.70) mg vs healthy: 3.88 (0.61) mg, p=0.08), and lactulose/13C mannitol excretion ratio (IBS-C: 0.02 (0.005) vs healthy: 0.01 (0.004), p=0.87) was similar between IBS-C and healthy (Figure 1D–F). Therefore, colonic permeability in IBS-C was also unchanged.
The 2–8 hr and the overall 0–24 hr cumulative excretions were also similar between the two groups (Supplementary Figure 2).
Ex vivo mucosal barrier function
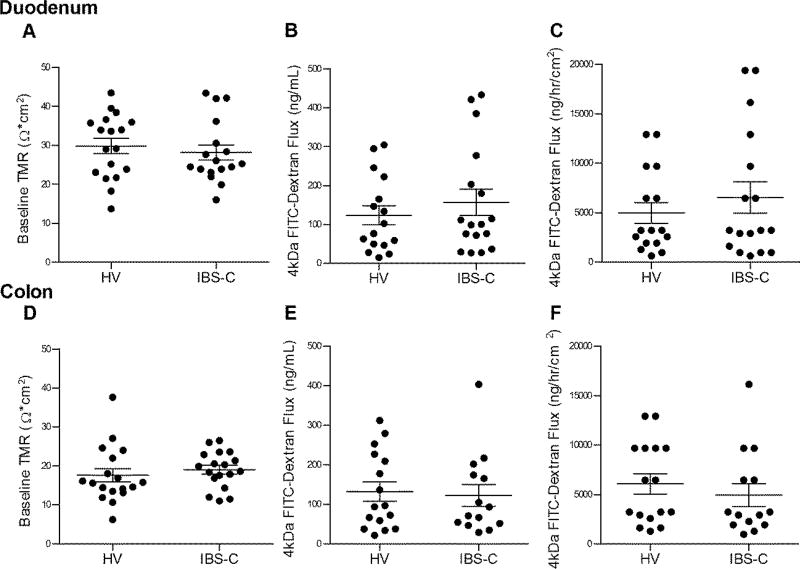
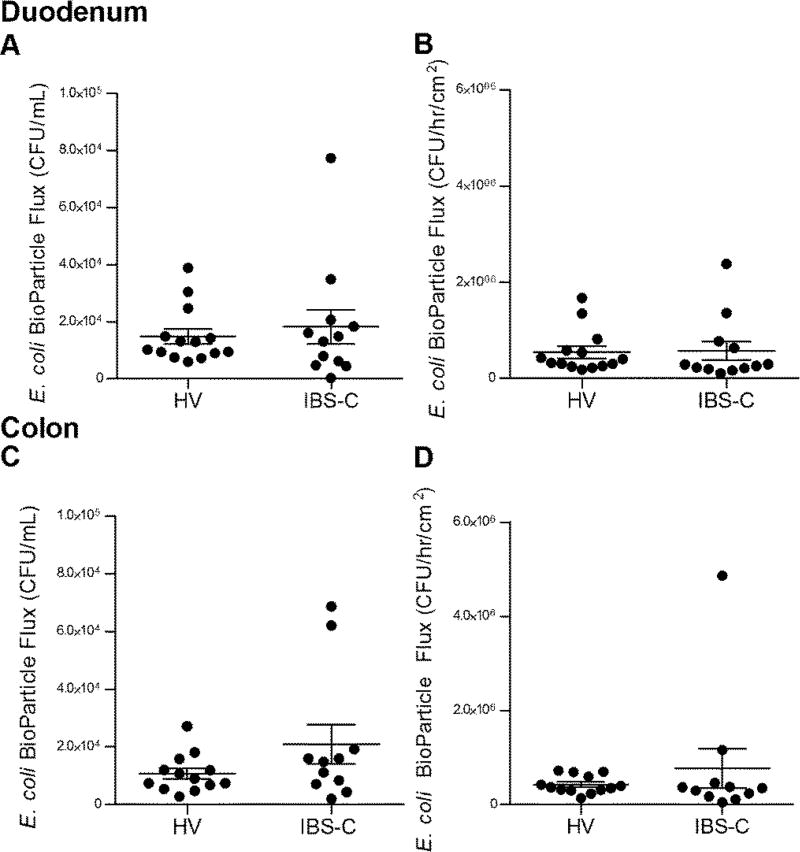
Duodenal TMR was similar between IBS and healthy (IBS-C: 28.16 (1.96) Ω*cm2 vs healthy: 29.8 (1.94) Ω*cm2, p=0.56) (Figure 2A). Subsequent to mucosal chamber administration of 4 kDa FITC dextran, similar 3 hour cumulative submucosal concentrations were obtained (IBS-C: 156.8 (33.73) ng/mL vs healthy: 123.3 (24.29) ng/mL, p=0.61) (Figure 2B) and the rate of flux (IBS-C: 6528 (1584) ng/hr/cm2 vs healthy: 4980 (1044) ng/hr/cm2, p=0.73) (Figure 2C) were also similar. Translocation of E. coli K12 Bio-Particles measured as 3 hr cumulative submucosal concentration (IBS-C: 1.82 × 10⁴ (6.0 × 10³) CFU/mL vs healthy: 1.48 × 10⁴ (2.6 × 10³) CFU/mL, p=0.96) (Figure 3A) or rate of flux (IBS-C: 5.70 × 10⁵ (1.90 × 10⁵) CFU/hr/cm2 vs healthy: 5.42 × 10⁵ (1.2 × 10⁵) CFU/hr/cm2, p=0.34) (Figure 3B) were also similar among the two groups.
Figure 2.
Ex vivo permeability assessment. (A) Baseline transmucosal resistance (TMR) of duodenal mucosa. (B) Cumulative FITC-Dextran (4kDa) concentration across duodenal mucosa measured after 180 min. (C) Rate of FITC-Dextran (4kDa) flux across duodenal mucosa, per exposed biopsy area, over time. Panels D–F are corresponding values for colonic mucosa. Data are presented as mean ± SEM. Duodenum HV n=18, IBS-C n=17 (A); HV n=16, IBS-C n=17 (B, C). Colon HV and IBS-C n=18 (D); HV n=16, IBS-C n =14 (E, F).
Figure 3.
Ex vivo bacterial translocation. (A) Cumulative fluorescein conjugated E. coli Bio- Particle concentration in CFUs across duodenal mucosa, measured after 180 minutes. HV n =14, IBS-C n=12. (B) Rate of E. coli Bio-Particle Flux in CFUs across duodenal biopsies, per exposed area, per time. Panels C and D are corresponding values for colonic mucosa. HV n= 16, IBS-C n=14.
Colonic TMR was similar between IBS and healthy (IBS-C: 19.06 (1.10) Ω*cm2 vs healthy: 17.60 (1.70) Ω*cm2, p=0.24) (Figure 2D). Subsequent to mucosal chamber administration of 4 kDa FITC dextran, similar 3 hour cumulative submucosal concentrations were obtained (IBS-C: 122.5 (27.44) ng/mL vs healthy: 132.2 (24.23) ng/mL, p=0.66) (Figure 2E) and the rate of flux were also similar (IBS-C: 6069 (1030) ng/hr/cm2 vs healthy: 4931 (1156) ng/hr/cm2, p=0.36) (Figure 2F). Translocation of E. coli K12 Bio-Particles measured as 3 hr cumulative submucosal concentration (IBS-C: 2.09 × 10⁴ (6.8 × 10³) CFU/mL vs healthy: 1.07 × 10⁴ (1.8 × 10³) CFU/mL, p=0.32) (Figure 3C) and the rate of flux (IBS-C: 7.67 × 10⁵ (4.19 × 10⁵) CFU/hr/cm2 vs healthy: 4.26 × 10⁵ (5.3 × 10⁴) CFU/hr/cm2, p=0.49) were also similar among the two groups (Figure 3D).
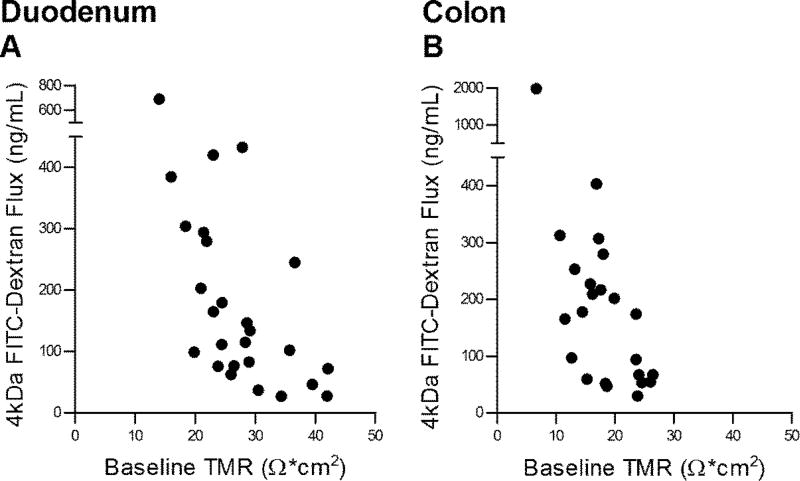
There was statistically significant correlation between the 4 kDa FITC dextran flux and TMR tested on the same biopsy in duodenum (r=−0.57, p=0.0006, Figure 4A) and colon (r=−0.58, p=0.0012, Figure 4B).
Figure 4.
Correlations between baseline transmucosal resistance (TMR) and FITC-Dextran Flux (4kDa) across the same biopsies. (A) Correlation between baseline duodenal TMR and 3 hr cumulative submucosal FITC-Dextran (4kDa) concentration. Pearson’s correlation coefficient = −0.57, p<0.0006. Number of XY pairs=32. (B) Correlation between baseline colonic TMR and 3 hr cumulative submucosal FITC-Dextran (4kDa) concentration. Pearson’s correlation coefficient = −0.58, p<0.0012. Number of XY pairs=28. HV and IBS-C biopsy data were combined. A p-value of <0.05 was considered significant.
Duodenal impedance
The duodenal impedance measurement catheter (Figure 5A) and a representative impedance tracing is shown (Figure 5B). The impedance values across the duodenal circumference were averaged for each subject. The mean impedance for IBS-C was 729.5 (64.85) Ω vs 705.9 (42.73) Ω for healthy, p=0.71 (Figure 5C). The impedance values on the four duodenal walls ranged from 420.0–1043.6 Ω in IBS-C cohort and 424.4- 1060.9 Ω in the healthy.
Figure 5.
Duodenal impedance. (A) Mucosal impedance catheter tip; (B) Representative tracing with arrows representing start of impedance recordings on medial, superior, lateral and inferior duodenal walls with direct mucosal contact under endoscopic visualization; (C) Four measurements obtained for each subject and plotted values represent averages of the four recordings. Data are presented as mean ± SEM. HV n=16, IBS-C n=9.
Serum endotoxemia
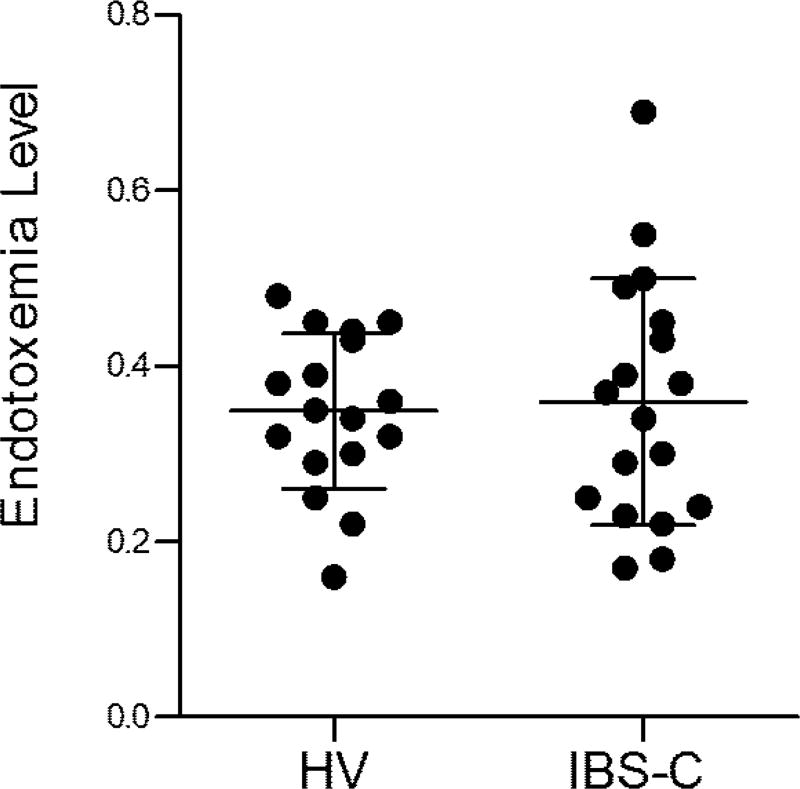
IBS-C patients had mean endotoxin levels of 0.36 (0.03) vs a mean of 0.35 (0.02) in healthy, p > 0.99 (Figure 6). 3/18 IBS-C patients had endotoxemia levels of > 0.5 (considered high) and these 3 patients also had high colonic mucosal flux of FITC dextran.
Figure 6.
Endotoxemia levels. Bacterial lipopolysaccharide levels in anti-coagulated whole blood. Data are presented as mean ± SEM. HV n=17, IBS-C n=18.
Secretory responses
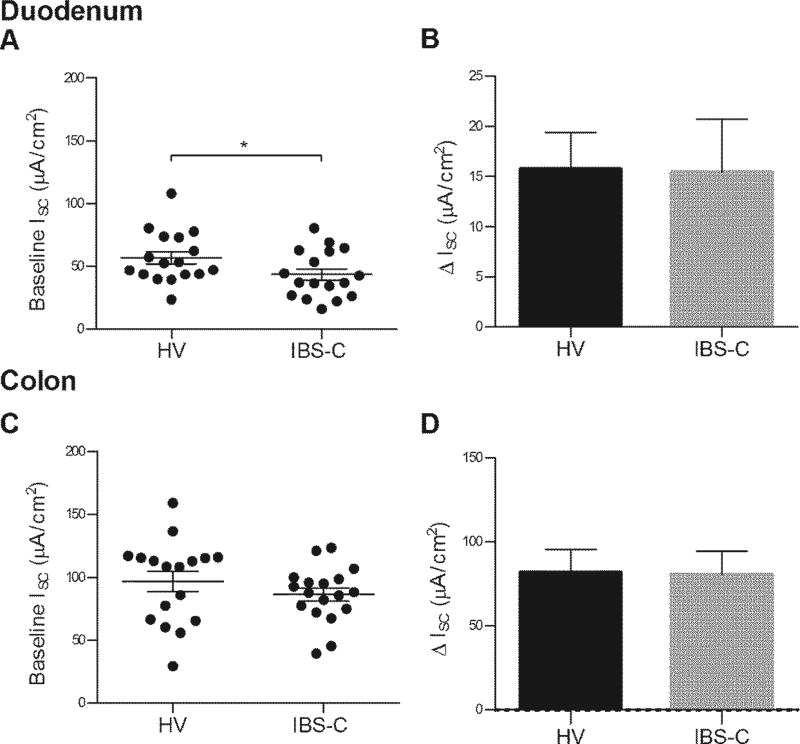
Baseline Isc was lower in the IBS-C group in duodenum (IBS-C: 43.53 (4.55) µA*cm2 vs healthy: 56.89 (4.93) µA*cm2, p=0.05) (Figure 7A). Baseline colon Isc was similar (IBS-C: 86.41 (5.20) µA*cm2 vs healthy: 96.78 (8.07) µA*cm2, p=0.30) (Figure 7C). The duodenum ΔIsc in response to ACh (IBS-C: 15.44 (5.26) µA*cm2 vs healthy: 15.76 (3.62) µA*cm2, p=0.79) was similar between the two groups (Figure 7B). The colon ΔIsc in response to ACh (IBS-C: 80.81 (13.73) µA*cm2 vs healthy: 82.08 (13.34) µA*cm2, p=0.99) was similar between the two groups (Figure 7D).
Figure 7.
Mucosal secretory responses. (A) Baseline duodenal short circuit current (Isc) of healthy and IBS-C participants. HV n=17, IBS-C n=17 (B) Duodenal ΔIsc in response to 0.0003M submucosal ACh. HV n=17, IBS-C n=18. Panels C (HV n=14, IBS-C n=12) and D (HV n=18, IBS-C n=17) are corresponding values for colonic mucosa.
Tight junction gene expression
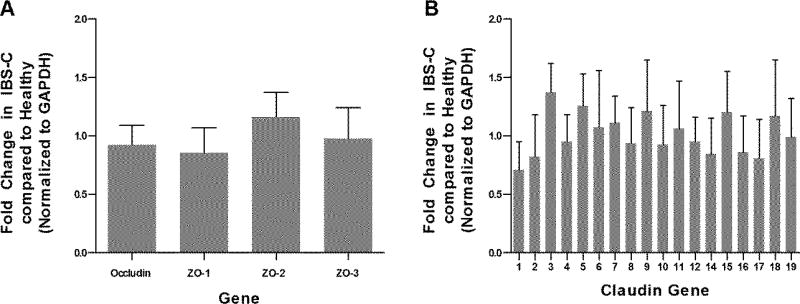
The colonic mucosal expression of transmembrane proteins occludin and claudins (1–12, 14–19) was unchanged in IBS-C. Similarly, the expression of zonula occludens 1, 2 and 3 (ZO 1, 2 and 3) was unchanged (Figure 8). The remainder of the TJ genes tested in the array were also unchanged (Supplementary Table 1).
Figure 8.
Abundance of colonic mucosal expression of (A) Occludin, ZO-1, 2, 3; (B) Claudin 1–12, and 14–19 in IBS-C in comparison to healthy. HV n=10, IBS-C n=18. Genes were normalized by arithmetic mean to the control gene, GAPDH. Error bars represent 95% CI.
DISCUSSION
Disruption of mucosal barrier has been implicated in the pathophysiology of IBS [16]. In vivo and ex vivo measures have shown an impaired barrier function in a subset of IBS patients, mostly in IBS-D. Additionally, transcriptional and protein expression of TJ proteins have been found to be altered in IBS. Finally, parameters of impaired barrier function like increased lactulose/mannitol excretion ratio [17], increased mucosal paracellular permeability [4], and increased paracellular permeability of cellular monolayers in response to biopsy supernatants [3] have been found to correlate with the abdominal pain severity and visceral sensitivity in IBS-D. A comprehensive assessment of barrier function in IBS-C was lacking. Our results show that in this cohort of females with IBS-C who underwent detailed studies for assessment of duodenal and colonic barrier properties, in vivo and ex vivo barrier function was preserved. There was no evidence of increased mucosal bacterial translocation and circulating endotoxemia in IBS-C patients. Upon assessment of secretion, IBS-C patients trended to have lower duodenal mucosal secretion as compared to healthy volunteers. In addition to helping understand pathophysiology of IBS, modulation of barrier and secretory properties is of interest for drug development in IBS-C. This study provides assessment of these fundamental epithelial functions in females with IBS-C and suggests that intestinal permeability and mucosal bacterial translocation are unchanged in females with IBS-C and therefore should not be targeted.
In vivo measurements of intestinal permeability are often done by measuring urinary excretion of molecules that are absorbed and poorly metabolized in the gut (e.g. lactulose, mannitol, rhamnose, sucralose, 51Cr EDTA, PEG etc.) [18] [19] [20]. Increased lactulose/mannitol excretion ratio has been shown in PI-IBS following C. jejuni [21] and mixed infections (C. jejuni and E. coli O157:H7) [22]. However, there is significant inter-day variability in excretion of those sugars [23] and about a third of the subjects excrete significant amounts of mannitol at baseline [12]. This could be due to inadvertent contamination during the study (either from diet, medications or other sources), baseline sugar competing with absorption or the production of 12C mannitol by colonic microbiota during the testing [24]. 13C constitutes only 1% of naturally occurring carbon and is a stable (non-radioactive) isotope. We show in this study that 13C mannitol can be separated from 12C mannitol on HPLC-MS and is present in extremely small concentrations in baseline urine sample offering a novel molecule for measurement of intestinal permeability. Our results indicate no difference in in vivo duodenal or colonic permeability using the 13C mannitol excretion assay in this cohort of IBS-C females. Subsequent studies using 13C mannitol in other IBS phenotypes (IBS-D or M) should be able to provide a more accurate assessment of intestinal permeability than 12C mannitol.
Soluble factors have been proposed to mediate changes in mucosal barrier function and visceral sensitivity. Fecal cysteine proteases were previously found to be increased in a subset of IBS-C patients and their activity correlated with symptom severity, especially abdominal pain score. Application of IBS-C fecal supernatants on mouse colonic mucosa in vivo or cultured monolayers (T84) in vitro caused enzymatic degradation of occludin in vitro, increased permeability in vivo and increased sensitivity to colorectal distension in vivo [5]. Two previous studies assessing colonic mucosal paracellular permeability used fluorescein-5.6 sulfonic acid (478 da) which is likely to have greater flux as compared to the FITC dextran (4000 da) that we used. However, most of the dietary antigens are >600 da which makes studying a larger molecule more useful for investigating barrier in disease states [25]. We also studied E. coli K-12 Bio- Particle translocation which is mediated by transcellular pathways and found no differences between IBS-C and health. Several factors can play a role in modulating intestinal barrier function in IBS. Psychosocial comorbidities are common in IBS and associate with symptom severity. Corticotrophin releasing factor has been shown to increase permeability [26, 27] and TJ proteins have a rapid exchange at the junctions [28]. Thus, it is plausible that specific dietary or environmental triggers, such as stress, may cause intermittent disruption of barrier function mediated by the soluble factors [29]. Previous studies assessing intestinal barrier function in IBS had patients with greater levels of comorbid anxiety and depression and higher symptom severity, whereas our cohort of females with IBS-C scored fairly low on anxiety, depression and symptom severity. Additionally, environmental factors can affect intestinal permeability. An allergic background correlates with a more severe disease and diarrhea predominance with suggestive links with increased paracellular permeability [4]. Recently, house dust mite, a common environmental trigger was shown to increase FITC-sulfonic acid flux in a dose dependent manner across human colonic mucosa, decrease ZO-1 and occludin expression and caused damage to the TJ ultrastructure [30].
We also studied endotoxemia levels in our cohort. The precise pathways that allow LPS entry through the gastrointestinal mucosal and defense systems into the porto-systemic circulation are unknown and both trans and paracellular routes have been proposed [31]. Immune dysregulation and low-grade inflammation have been found to be present in a subset of IBS patients [32]. Bacterial LPS has been proposed to mediate and reflect low-grade inflammation in conditions such as obesity [33], however, it is not known if IBS patients have elevated circulating endotoxins. Although, overall our IBS-C patients did not have higher endotoxemia levels than controls, 3/18 IBS-C patients had high endotoxemia levels (> 0.5), which have been associated with systemic inflammation. These 3 patients also had high colonic FITC dextran flux suggesting that impaired paracellular barrier may be allowing bacterial LPS to access systemic circulation.
A number of drugs for IBS-C function as secretagogues. However, the baseline mucosal secretory properties in IBS-C are unknown. Isc measured under voltage clamp conditions in Ussing chambers allows assessment of electrogenic ionic fluxes at baseline and in response to pharmacological and electrical stimulation. Although ΔIsc in response to such stimulation can be a result of complex ionic transport, luminal secretion of Cl− or HCO3− and Na+ absorption are the predominant processes involved. ACh primarily activates epithelial ion channels via an increase of intracellular calcium levels. We show that the baseline duodenal Isc was lower in IBS-C as compared to the healthy. This can result in lower luminal anionic secretion and associated luminal transport of water which can result in lower intestinal transit seen in IBS-C [34]. Although ionic (Cl−) and water secretion in colon has been studied in greater detail in animal models, mucosal secretory mechanisms in IBS-C patients have not been studied in either colon or small bowel. One study looking at transmural potential difference as a surrogate for intestinal secretion found elevated potential difference in jejunum but not duodenum in patients with IBS-C [35]. However, it is unclear if perfusion system based measurement of in vivo potential difference reflects mucosal secretory response or correlates with transit. A recent study using surgical specimens provided detailed description of baseline secretory and barrier properties of human intestinal mucosa-submucosa preparations from a variety of disease conditions except IBS [36]. Although baseline duodenal and colonic Isc values described were lower than ours, duodenal Isc was lower than rectosigmoid colonic Isc, similar to our observations. This study also showed that ongoing Ach release is present in small intestine but not colon and both Cl− and HCO3− secretion can play an important role in baseline Isc. Further studies should delineate ex vivo and in vivo small intestinal secretory mechanisms in IBS-C.
In summary, in this largest cohort of IBS-C females studied to-date using complementary in vivo and ex vivo techniques and simultaneous assessment of small and large intestine, barrier function was not found to be altered. This is important considering an emerging interest for peripheral mechanisms in the pathophysiology of IBS. It is plausible that although IBS-C and IBS-D are diagnosed and conceptualized using similar mechanistic framework, the peripheral mechanisms of these two subtypes are quite different. Additionally, although from mechanistic and pharmacological standpoint, secretory mechanisms are better studied and targeted in colon, secretion in the small bowel probably plays an important role in pathophysiology of IBS-C and should be further studied.
Supplementary Material
SIGNIFICANCE OF THIS STUDY.
What is already known on this subject?
-
▪
Disrupted intestinal barrier is present in a subset of IBS patients and possibly plays a role in symptom generation.
-
▪
Most of the studies on intestinal barrier function in IBS have focused on diarrhea predominant IBS or post-infectious IBS (which is often diarrhea predominant or mixed)
-
▪
It is not known if intestinal barrier and secretory function is impaired in constipation predominant IBS (IBS-C).
What are the new findings?
-
▪
In vivo duodenal and colonic permeability, duodenal impedance, ex vivo duodenal and colonic mucosal barrier function and colonic tight junction gene expression were unchanged in females with IBS-C.
-
▪
There was no evidence of increased duodenal or colonic mucosal bacterial translocation or circulating endotoxemia in females with IBS-C.
-
▪
Basal duodenal mucosal secretion was lower in IBS-C.
How might it impact on clinical practice in the foreseeable future?
-
▪
Intestinal permeability and mucosal bacterial translocation are unchanged in females with IBS-C and therefore should not be targeted.
-
▪
Decreased small intestinal secretion may play a role in pathophysiology of IBS-C and needs further investigation.
Acknowledgments
The authors wish to thank Ms. Lori Anderson for administrative assistance, Dr. Simon J. Gibbons for assistance with data interpretation, Ms. Cheryl Bernard and Mr. Gary Stoltz for technical assistance.
Funding: This project was funded by an Investigator Initiated Grant by Takeda Pharmaceuticals to Dr. Grover. Additionally, Dr. Grover is supported by NIH K23 (DK103911) and Pilot and Feasibility Award from Mayo Clinic Center for Cell Signaling in Gastroenterology (NIH P30DK084567).
Abbreviations
- IBS
Irritable bowel syndrome
- TMR
Transmucosal resistance
- Isc
Short circuit current
- TJ
Tight junctions
- ACh
Acetylcholine
- FITC
Fluorescein isothiocyanate
- HPLC-MS
High performance liquid chromatography-tandem mass spectrometry
- ZO
zonula occludens
- PEG
polyethylene glycol
- EDTA
Ethylenediaminetetraacetic acid
- IBS-SSS
IBS-symptom severity scale
- IBS-QoL
IBS-quality of life
- HADS
Hospital anxiety and depression scale
- LPS
Lipopolysaccharide
Footnotes
Competing Interests: None to declare
References
- 1.Enck P, Aziz Q, Barbara G, et al. Irritable bowel syndrome. Nat Rev Dis Primers. 2016;2:16014. doi: 10.1038/nrdp.2016.14. [DOI] [PMC free article] [PubMed] [Google Scholar]
- 2.Piche T. Tight junctions and IBS--the link between epithelial permeability, low-grade inflammation, and symptom generation? Neurogastroenterol Motil. 2014;26:296–302. doi: 10.1111/nmo.12315. [DOI] [PubMed] [Google Scholar]
- 3.Piche T, Barbara G, Aubert P, et al. Impaired intestinal barrier integrity in the colon of patients with irritable bowel syndrome: involvement of soluble mediators. Gut. 2009;58:196–201. doi: 10.1136/gut.2007.140806. [DOI] [PubMed] [Google Scholar]
- 4.Vivinus-Nebot M, Dainese R, Anty R, et al. Combination of allergic factors can worsen diarrheic irritable bowel syndrome: role of barrier defects and mast cells. Am J Gastroenterol. 2012;107:75–81. doi: 10.1038/ajg.2011.315. [DOI] [PubMed] [Google Scholar]
- 5.Annahazi A, Ferrier L, Bezirard V, et al. Luminal cysteine-proteases degrade colonic tight junction structure and are responsible for abdominal pain in constipation-predominant IBS. Am J Gastroenterol. 2013;108:1322–31. doi: 10.1038/ajg.2013.152. [DOI] [PubMed] [Google Scholar]
- 6.Coeffier M, Gloro R, Boukhettala N, et al. Increased proteasome-mediated degradation of occludin in irritable bowel syndrome. Am J Gastroenterol. 2010;105:1181–8. doi: 10.1038/ajg.2009.700. [DOI] [PubMed] [Google Scholar]
- 7.Bertiaux-Vandaele N, Youmba SB, Belmonte L, et al. The expression and the cellular distribution of the tight junction proteins are altered in irritable bowel syndrome patients with differences according to the disease subtype. Am J Gastroenterol. 2011;106:2165–73. doi: 10.1038/ajg.2011.257. [DOI] [PubMed] [Google Scholar]
- 8.Park JH, Park DI, Kim HJ, et al. The relationship between small-intestinal bacterial overgrowth and intestinal permeability in patients with irritable bowel syndrome. Gut Liver. 2009;3:174–9. doi: 10.5009/gnl.2009.3.3.174. [DOI] [PMC free article] [PubMed] [Google Scholar]
- 9.Kerckhoffs AP, Akkermans LM, de Smet MB, et al. Intestinal permeability in irritable bowel syndrome patients: effects of NSAIDs. Dig Dis Sci. 2010;55:716–23. doi: 10.1007/s10620-009-0765-9. [DOI] [PubMed] [Google Scholar]
- 10.Gecse K, Roka R, Sera T, et al. Leaky gut in patients with diarrhea-predominant irritable bowel syndrome and inactive ulcerative colitis. Digestion. 2012;85:40–6. doi: 10.1159/000333083. [DOI] [PubMed] [Google Scholar]
- 11.Rao AS, Camilleri M, Eckert DJ, et al. Urine sugars for in vivo gut permeability: validation and comparisons in irritable bowel syndrome-diarrhea and controls. Am J Physiol Gastrointest Liver Physiol. 2011;301:G919–28. doi: 10.1152/ajpgi.00168.2011. [DOI] [PMC free article] [PubMed] [Google Scholar]
- 12.Grover M, Camilleri M, Hines J, et al. (13) C mannitol as a novel biomarker for measurement of intestinal permeability. Neurogastroenterol Motil. 2016;28:1114–9. doi: 10.1111/nmo.12802. [DOI] [PMC free article] [PubMed] [Google Scholar]
- 13.Francis CY, Morris J, Whorwell PJ. The irritable bowel severity scoring system: a simple method of monitoring irritable bowel syndrome and its progress. Aliment Pharmacol Ther. 1997;11:395–402. doi: 10.1046/j.1365-2036.1997.142318000.x. [DOI] [PubMed] [Google Scholar]
- 14.Drossman DA, Patrick DL, Whitehead WE, et al. Further validation of the IBS-QOL: a disease-specific quality-of-life questionnaire. Am J Gastroenterol. 2000;95:999–1007. doi: 10.1111/j.1572-0241.2000.01941.x. [DOI] [PubMed] [Google Scholar]
- 15.Katzka DA, Ravi K, Geno DM, et al. Endoscopic mucosal impedance measurements correlate with eosinophilia and dilation of intercellular spaces in patients with eosinophilic esophagitis. Clin Gastroenterol Hepatol. 2015;13:1242–8. e1. doi: 10.1016/j.cgh.2014.12.032. [DOI] [PubMed] [Google Scholar]
- 16.Camilleri M, Lasch K, Zhou W. Irritable bowel syndrome: methods, mechanisms, and pathophysiology. The confluence of increased permeability, inflammation, and pain in irritable bowel syndrome. Am J Physiol Gastrointest Liver Physiol. 2012;303:G775–85. doi: 10.1152/ajpgi.00155.2012. [DOI] [PubMed] [Google Scholar]
- 17.Zhou Q, Zhang B, Verne GN. Intestinal membrane permeability and hypersensitivity in the irritable bowel syndrome. Pain. 2009;146:41–6. doi: 10.1016/j.pain.2009.06.017. [DOI] [PMC free article] [PubMed] [Google Scholar]
- 18.Bjarnason I, MacPherson A, Hollander D. Intestinal permeability: an overview. Gastroenterology. 1995;108:1566–81. doi: 10.1016/0016-5085(95)90708-4. [DOI] [PubMed] [Google Scholar]
- 19.Swan C, Duroudier NP, Campbell E, et al. Identifying and testing candidate genetic polymorphisms in the irritable bowel syndrome (IBS): association with TNFSF15 and TNFalpha. Gut. 2013;62:985–94. doi: 10.1136/gutjnl-2011-301213. [DOI] [PubMed] [Google Scholar]
- 20.Dunlop SP, Hebden J, Campbell E, et al. Abnormal intestinal permeability in subgroups of diarrhea-predominant irritable bowel syndromes. Am J Gastroenterol. 2006;101:1288–94. doi: 10.1111/j.1572-0241.2006.00672.x. [DOI] [PubMed] [Google Scholar]
- 21.Spiller RC, Jenkins D, Thornley JP, et al. Increased rectal mucosal enteroendocrine cells, T lymphocytes, and increased gut permeability following acute Campylobacter enteritis and in post-dysenteric irritable bowel syndrome. Gut. 2000;47:804–11. doi: 10.1136/gut.47.6.804. [DOI] [PMC free article] [PubMed] [Google Scholar]
- 22.Marshall JK, Thabane M, Garg AX, et al. Intestinal permeability in patients with irritable bowel syndrome after a waterborne outbreak of acute gastroenteritis in Walkerton, Ontario. Aliment Pharmacol Ther. 2004;20:1317–22. doi: 10.1111/j.1365-2036.2004.02284.x. [DOI] [PubMed] [Google Scholar]
- 23.Kelly CP, Green PH, Murray JA, et al. Larazotide acetate in patients with coeliac disease undergoing a gluten challenge: a randomised placebo-controlled study. Aliment Pharmacol Ther. 2013;37:252–62. doi: 10.1111/apt.12147. [DOI] [PubMed] [Google Scholar]
- 24.Ortiz ME, Raya RR, Mozzi F. Efficient mannitol production by wild-type Lactobacillus reuteri CRL 1101 is attained at constant pH using a simplified culture medium. Appl Microbiol Biotechnol. 2015;99:8717–29. doi: 10.1007/s00253-015-6730-y. [DOI] [PubMed] [Google Scholar]
- 25.Menard S, Cerf-Bensussan N, Heyman M. Multiple facets of intestinal permeability and epithelial handling of dietary antigens. Mucosal Immunol. 2010;3:247–59. doi: 10.1038/mi.2010.5. [DOI] [PubMed] [Google Scholar]
- 26.Overman EL, Rivier JE, Moeser AJ. CRF induces intestinal epithelial barrier injury via the release of mast cell proteases and TNF-alpha. PLoS One. 2012;7:e39935. doi: 10.1371/journal.pone.0039935. [DOI] [PMC free article] [PubMed] [Google Scholar]
- 27.Wallon C, Yang PC, Keita AV, et al. Corticotropin-releasing hormone (CRH) regulates macromolecular permeability via mast cells in normal human colonic biopsies in vitro. Gut. 2008;57:50–8. doi: 10.1136/gut.2006.117549. [DOI] [PubMed] [Google Scholar]
- 28.Shen L, Weber CR, Turner JR. The tight junction protein complex undergoes rapid and continuous molecular remodeling at steady state. J Cell Biol. 2008;181:683–95. doi: 10.1083/jcb.200711165. [DOI] [PMC free article] [PubMed] [Google Scholar]
- 29.Uhde M, Ajamian M, Caio G, et al. Intestinal cell damage and systemic immune activation in individuals reporting sensitivity to wheat in the absence of coeliac disease. Gut. 2016 Jul 25; doi: 10.1136/gutjnl-2016-311964. [Epub ahead of print] [DOI] [PMC free article] [PubMed] [Google Scholar]
- 30.Tulic MK, Vivinus-Nebot M, Rekima A, et al. Presence of commensal house dust mite allergen in human gastrointestinal tract: a potential contributor to intestinal barrier dysfunction. Gut. 2016;65:757–66. doi: 10.1136/gutjnl-2015-310523. [DOI] [PubMed] [Google Scholar]
- 31.Guerville M, Boudry G. Gastrointestinal and hepatic mechanisms limiting entry and dissemination of lipopolysaccharide into the systemic circulation. Am J Physiol Gastrointest Liver Physiol. 2016;311:G1–G15. doi: 10.1152/ajpgi.00098.2016. [DOI] [PubMed] [Google Scholar]
- 32.Ohman L, Tornblom H, Simren M. Crosstalk at the mucosal border: importance of the gut microenvironment in IBS. Nat Rev Gastroenterol Hepatol. 2015;12:36–49. doi: 10.1038/nrgastro.2014.200. [DOI] [PubMed] [Google Scholar]
- 33.Munford RS. Endotoxemia-menace, marker, or mistake? J Leukoc Biol. 2016 Oct;100(4):687–698. doi: 10.1189/jlb.3RU0316-151R. [DOI] [PMC free article] [PubMed] [Google Scholar]
- 34.Cil O, Phuan PW, Lee S, et al. CFTR activator increases intestinal fluid secretion and normalizes stool output in a mouse model of constipation. Cell Mol Gastroenterol Hepatol. 2016;2:317–27. doi: 10.1016/j.jcmgh.2015.12.010. [DOI] [PMC free article] [PubMed] [Google Scholar]
- 35.Larsson MH, Simren M, Thomas EA, et al. Elevated motility-related transmucosal potential difference in the upper small intestine in the irritable bowel syndrome. Neurogastroenterol Motil. 2007;19:812–20. doi: 10.1111/j.1365-2982.2007.00941.x. [DOI] [PubMed] [Google Scholar]
- 36.Krueger D, Michel K, Zeller F, et al. Neural influences on human intestinal epithelium in vitro. J Physiol. 2016;594:357–72. doi: 10.1113/JP271493. [DOI] [PMC free article] [PubMed] [Google Scholar]
Associated Data
This section collects any data citations, data availability statements, or supplementary materials included in this article.


