Significance
Polycystic kidney diseases (PKDs) are genetic disorders in which multiple cysts grow in kidneys, leading to end-stage renal failure. Vasopressin antagonists (vaptans) currently used to treat PKDs have side effects due to liver toxicity. We report the characterization of Mambaquaretin-1, a Kunitz-fold polypeptide isolated from mamba venom that selectively and fully inhibits three major signaling pathways of the vasopressin type-2 receptor. Mambaquaretin-1 induces a purely aquaretic effect on mice and reduces cyst development in a mouse model. We produced mambaquaretin-1 by peptide synthesis and determined its X-ray structure, its binding mode, and functional properties. With high selectivity and without toxic metabolic byproducts associated with its peptidic nature, mambaquaretin-1 could become the preferential treatment for these disorders.
Keywords: polycystic kidney disease, Kunitz peptide, snake toxin
Abstract
Polycystic kidney diseases (PKDs) are genetic disorders that can cause renal failure and death in children and adults. Lowering cAMP in cystic tissues through the inhibition of the type-2 vasopressin receptor (V2R) constitutes a validated strategy to reduce disease progression. We identified a peptide from green mamba venom that exhibits nanomolar affinity for the V2R without any activity on 155 other G-protein–coupled receptors or on 15 ionic channels. Mambaquaretin-1 is a full antagonist of the V2R activation pathways studied: cAMP production, beta-arrestin interaction, and MAP kinase activity. This peptide adopts the Kunitz fold known to mostly act on potassium channels and serine proteases. Mambaquaretin-1 interacts selectively with the V2R through its first loop, in the same manner that aprotinin inhibits trypsin. Injected in mice, mambaquaretin-1 increases in a dose-dependent manner urine outflow with concomitant reduction of urine osmolality, indicating a purely aquaretic effect associated with the in vivo blockade of V2R. CD1-pcy/pcy mice, a juvenile model of PKD, daily treated with 13 g of mambaquaretin-1 for 99 d, developed less abundant (by 33%) and smaller (by 47%) cysts than control mice. Neither tachyphylaxis nor apparent toxicity has been noted. Mambaquaretin-1 represents a promising therapeutic agent against PKDs.
Polycystic kidney diseases (PKDs) are potentially life-threatening genetic disorders that are characterized by the presence of multiple fluid-filled cysts in the kidney. In PKDs, cyst formation and enlargement progressively compromise normal renal parenchyma functions and with time severely distort the entire kidney, leading to end-stage renal failure (1). With an estimated prevalence of 1 in 1,000, autosomal-dominant PKD (ADPKD), caused by mutations in either the polycystin-1 or polycystin-2 gene, is one of the most common monogenetic disorders affecting millions of people worldwide (2, 3). Autosomal-recessive PKD caused by mutations in the fibrocystin gene is 20 times less common than ADPKD and affects children in the first year of life with a high mortality rate. No satisfactory therapy for PKDs has yet been developed despite huge efforts for more than 30 y. All of the strategies, from microtubule stabilization with the antitumor drug paclitaxel to the inhibition of either epidermal growth factor receptor or B-Raf, MAPK/ERK, and mTOR kinases have failed to significantly improve the pathological state (4). A key advance in ADPKD treatment has been the observation that in the polycystic kidneys a pathogenic cAMP accumulation stimulates cell proliferation and chloride-driven fluid secretion into cyst lumen (5, 6). The cAMP level can be reduced in two ways: through Gi-protein activation by the somatostatin SSTR2 receptor or, alternatively, through type-2 vasopressin receptor (V2R) inhibition that decreases Gs-protein signaling. Although both strategies appear to be effective in humans and constitute an efficient therapeutic approach, the use of V2R antagonists has certain advantages (7, 8). Most renal ADPKD cysts develop within the vasopressin-sensitive tubular parts of the nephron, where vasopressin is also the main hormonal regulator of adenylyl cyclase and thus a stimulator of cAMP production. Moreover, increased levels of circulating vasopressin and elevated expression of V2R have been observed in human ADPKD and in animal models. Finally, in contrast to somatostatin receptors, V2R has kidney-specific expression.
Among the orally bio-available vasopressin antagonists, originally licensed for short-term treatment of heart failure and hyponatraemia, tolvaptan has been proved to be beneficial for the long-term treatment of ADPKD in adult patients (9). Tolvaptan is an aquaretic agent that inhibits V2R and reduces cAMP production in principal cells of the collecting tubules (10). In a large randomized phase III clinical trial, tolvaptan was found to slow down cyst development and renal insufficiency (8). Since 2014, marketing authorization has been granted in Japan, Canada, and four European countries (France, Germany, the United Kingdom, and Switzerland) and only more recently in the United States, delayed because of concerns regarding its harmful effects on liver function. Indeed, tolvaptan degradation by cytochrome P450 generates hepatotoxic metabolites (9). Additionally, because vaptans bind at a highly conserved orthosteric site, common to all vasopressin-sensitive receptors, they have weak selectivity.
Venoms constitute a reservoir of millions of disulfide-rich peptides, which are biochemically stable with particular pharmacological properties. Due to their high affinity and selectivity, polypeptides derived from venom of different animals are interesting alternatives to small nonpeptidic compounds for drug development (11). Mamba snake venom contains toxins, such as MT7, -Da1b, and -Da1a specific for GPCRs, able to modulate their functions in unique ways. MT7 acts as a negative allosteric modulator of the M1 muscarinic receptor (12), -Da1b is a noncompetitive antagonist of the 2A-adrenoreceptor (13), and -Da1a is able to antagonize in an insurmountable way the 1A-adrenoreceptor (14). Marine cone snails are currently the only species known to secrete toxins active on vasopressin receptors. These toxins mimic vasopressin with weak activity against the V1a and V1b receptors (15, 16). Here we report the identification, 3D structure, and properties of mambaquaretin-1 discovered by screening green mamba venom. Mambaquaretin-1 is a highly selective V2R antagonist able to protect against renal cyst development in vivo. For patients with PKD for which tolvaptan is contraindicated, a peptidic drug may represent an interesting alternative.
Results
Mambaquaretin-1 Selectively Interacts with V2R.
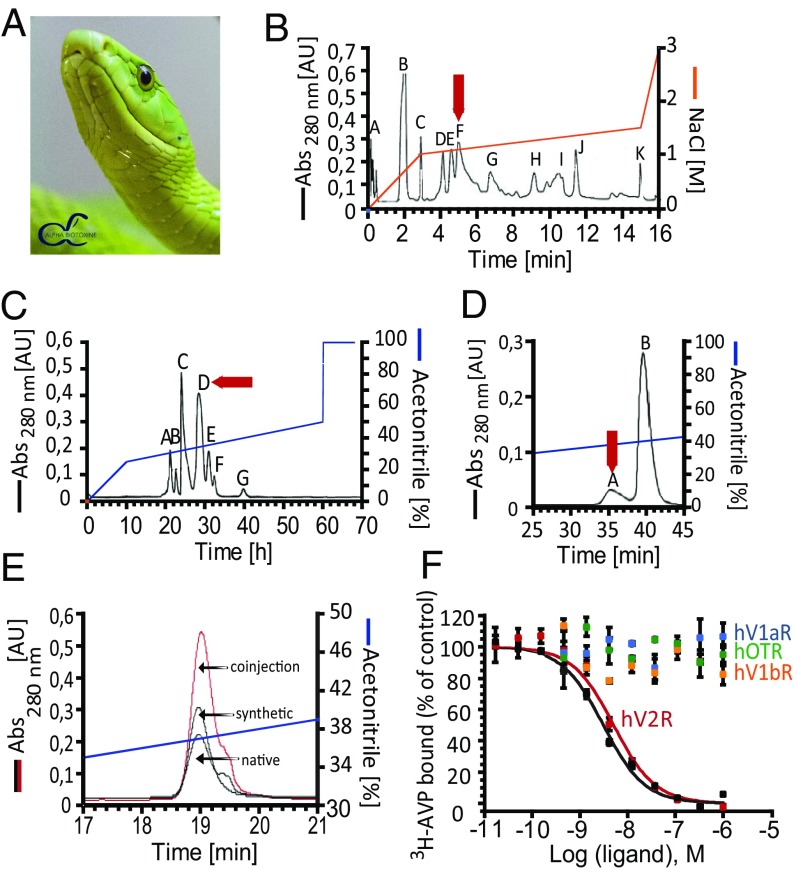
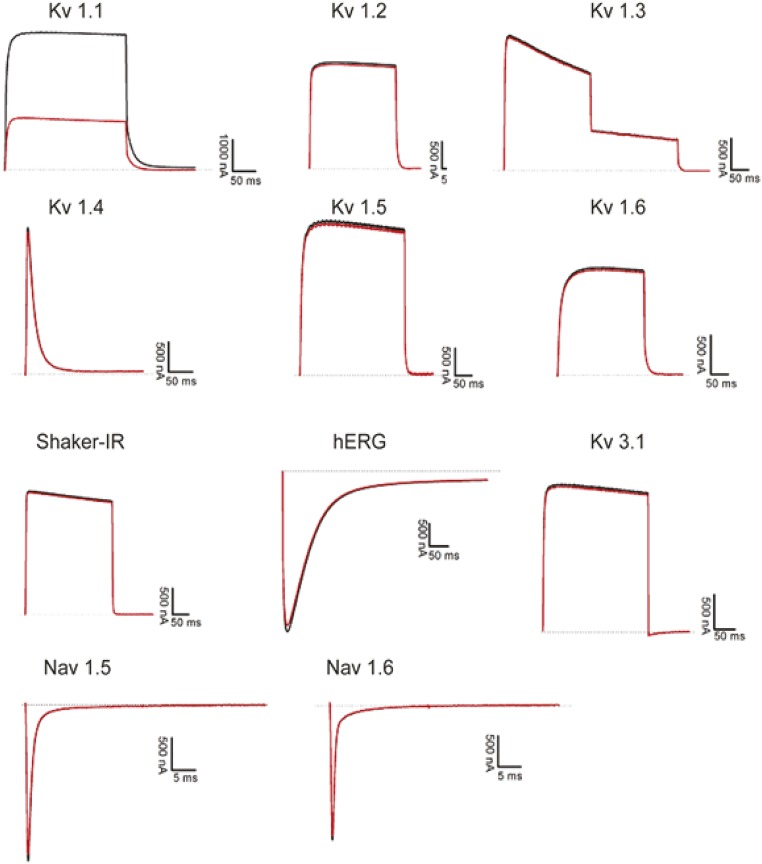
Mambaquaretin-1 was purified once from the venom of the green mamba (Fig. 1A) by cation exchange and reverse-phase liquid chromatography. The active fraction F from the cation exchange step (Fig. 1B) was subfractionated on a reverse-phase column (Fig. 1C) and fraction D active against V2R was isolated. The final purification step allowed separation of the minor active fraction A (Fig. 1D). The monoisotopic molecular mass of the active polypeptide was 6,367.2 Da and 6,373.2 Da before and after reduction, indicating the presence of three disulfide bridges (Fig. S1). Its sequence of 57 residues was determined by Edman’s degradation and mass analysis (Fig. S2 and Table S1). Mambaquaretin-1 was then produced by solid-phase peptide chemical synthesis (Fig. S3 A and E). The synthetic homologue had the same elution time as the toxin isolated from the venom (Fig. 1E) and it was found to bind V2R with the same affinity (data not shown). Synthetic mambaquaretin-1 inhibits tritiated arginine–vasopressin (3H-AVP) binding to V2R with a Ki of 2.81 nM (pKi 8.55 0.25, Fig. 1F). At concentrations up to 10 M, no binding could be measured on V1a, V1b, and the oxytocin receptor. At similar high concentrations, mambaquaretin-1 showed moderate activity only for Kv1.1 subtype but not on other potassium, sodium, or calcium channels (tested on nine Kv and on two Nav oocyte expressed channel subtypes, Fig. S4, and on rat brain N-type calcium channel, data not shown). Mambaquaretin-1 at 1 M was inactive on nine cardiac ionic channels and on 155 G-protein–coupled receptors expressed on eukaryotic cells (SI Method 1: Mambaquaretin-1 Identification and data not shown).
Fig. 1.
Identification and characterization of mambaquaretin-1. (A) Green mamba, reproduced with permission from C. Vanbellingen, Alphabiotoxine Laboratory sprl, Belgium. (B) Fractionation of 1 g of Dendroaspis angusticeps crude venom by ion-exchange chromatography. (C) Fractionation by reverse-phase chromatography of fraction F. (D) Fractionation by reverse-phase chromatography of fraction D. Arrows indicate active peaks. (E) Coelution between fraction A and synthetic mambaquaretin-1. (F) Binding of 3H-AVP on V2R, V1aR, V1bR, and Oxytocin R (hOTR) in the presence of mambaquaretin-1 (colored circles) and AVP (black circles). Data represent at least three independent experiments and are presented as mean SD. Abs, absorbance; AU, absorbance unit.
Fig. S1.
MALDI-TOF spectra of oxidized and reduced mambaquaretin-1. Shown are MALDI-TOF spectra of mambaquaretin-1 before (Top) and after (Bottom) reduction of the disulfide bonds. Each reduced disulfide bond leads to the molecular weight increase by 2 Da. The difference between the masses of the two species charged with one proton clearly indicates that mambaquaretin-1 has three disulfide bonds (M = 6,374.23 to 6,368.21 = 6.02 Da). Monoisotopic masses are in bold.
Fig. S2.
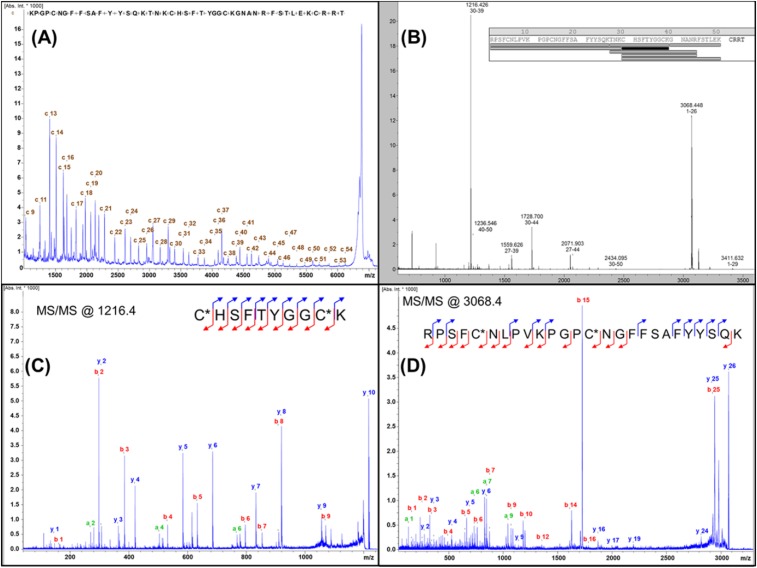
MALDI-TOF/TOF identification of amino acid sequence of mambaquaretin-1. (A) ISD mass spectrum obtained for the reduced peptide. The spectrum displays a large c-ion series that allows the toxin to be sequenced from the +09 to the +54 amino acid. (B) Peptide mass fingerprint acquired after the reduction, alkylation, and tryptic digestion of mambaquaretin-1. The resulting peptides, which match with the proposed sequence, confirm the results of the ISD experiment. (C) Further characterization with the MS/MS of the peptide detected at m/z 1216.4. b- and y-type ions fit perfectly with the sequence found by ISD. (D) MS/MS characterization of the N-terminal peptide (m/z 3068.4) that could not be characterized from the ISD experiment (due to intense adducts of matrix that hide the signals in the low-m/z range). This spectrum perfectly validates sequence obtained from Edman’s degradation.
Table S1.
Identification of amino acid sequence of mambaquaretin-1
 |
Fig. S3.
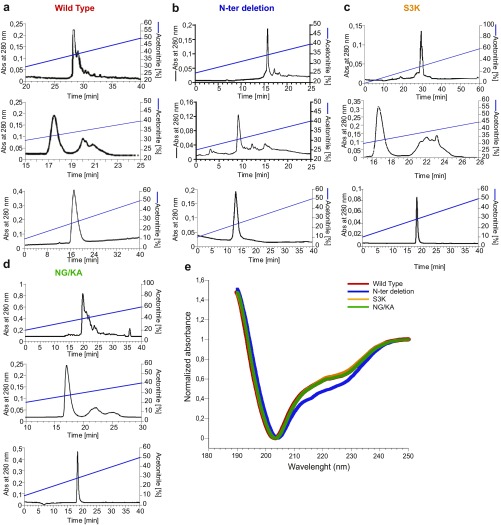
Solid-phase synthesis of WT mambaquaretin-1 and its three variants. (A–D) Reverse-phase liquid chromatography of the mambaquaretin-1 WT (A), the N-ter deletion peptide lacking its four first residues (B), the S3K (C), and the NG/KA variants (D). Solvents are A (water, TFA 0.1%) and B (acetonitrile, TFA 0.1%). A–D, Top corresponds to the purification of the crude synthesis on Waters X-bridge C18, 19 250 mm, 10 m, flow of 15 mL/min. The gradients were 10–40% of B in 40 min (mambaquaretin-1 WT), 15–40% of B in 25 min (N-ter deletion peptide), 0–60% of B in 60 min (S3K variant), and 20–60% of B in 40 min (NG/KA variant). A–D, Middle corresponds to the purification of the oxidized peptide performed on a Waters Sunfire 10 m, 10 250 mm. The gradients were 15–40% of B in 25 min (mambaquaretin-1 WT and N-ter deletion peptide), 20–60% of B in 40 min (S3K variant), and 10–40% of B in 30 min (NG/KA variant). A–D, Bottom corresponds to the analytical chromatography of the pure oxidized peptide performed on Waters X-bridge C18, 4.6 150 mm, 3.5 m. Gradient was 10–50% of B in 40 min. (E) Circular dichroism of WT mambaquaretin-1 and its three variants. Absorbance was normalized to fix at 1 the values at 250 nm and at 0 the minima. Size of the symbol equals SD, n = 8–12. Abs, absorbance.
Fig. S4.
Electrophysiological recordings of the effect of mambaquaretin-1 on conductivity of potassium (Kv) and sodium (Nav) channels. All channels were expressed in Xenopus laevis oocytes. Currents were recorded without (black traces) or in the presence of 10 M mambaquaretin-1 (red traces). Mambaquaretin-1 showed moderate inhibitory activity only on the Kv 1.1 channel.
Loop 1 of Mambaquaretin-1 Mediates Binding to V2R.
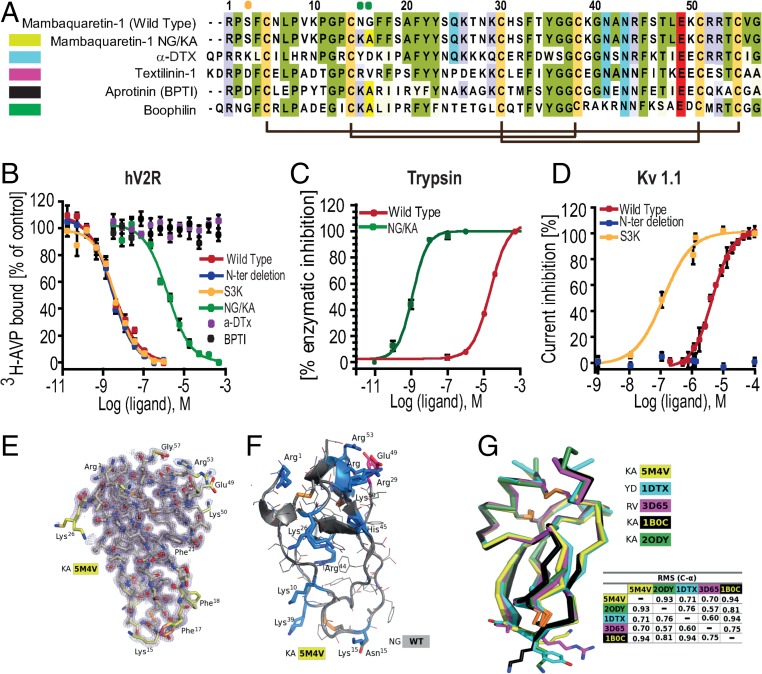
Mambaquaretin-1 shares between 49% and 57% of sequence identity with typical Kunitz-fold proteins (Fig. 2) such as -dendrotoxin (-DTX) (17, 21), which blocks the potassium channel Kv1.1 conductivity, and three inhibitors of trypsin activity: aprotinin (22), textilinin-1 (18), and boophilin (20). The molecular strategies used by the -DTX and the aprotinin to interact with their respective targets are different. -DTX blocks Kv1.1 mainly with its lysine in position 5 (21) whereas aprotinin to inhibit trypsin activity uses a dyad of residues composed of a lysine and an alanine (KA) located in its first loop (23). These positions are occupied by a serine (position 3 in mambaquaretin-1; Fig. 2A, orange circle) and by asparagine and glycine (positions 15 and 16 in mambaquaretin-1; Fig. 2A, green circles). Three variants were synthesized to question the strategy used by mambaquaretin-1 to target V2R: S3K, an N-ter truncated version lacking the first four residues, and the N15G16/K15A16 double variant (Fig. S3). The S3K variant and the truncated toxin were found to have the same affinity for V2R (pKi 8.87 0.14 and pKi 8.84 0.38, respectively) whereas the NG/KA variant had an affinity 1,000-fold lower than WT (pKi 5.50 0.46; Fig. 2B). Remarkably, the NG/KA variant inhibited trypsin with nanomolar affinity (IC50 = 0.77 0.18 nM vs. WT: IC50 = 14.8 1.1 M, Fig. 2C), the S3K variant was found to be more active on Kv1.1 (IC50 = 308 52 nM vs. WT: IC50 = 8.2 M), and the truncated polypeptide was inactive against Kv1.1 (IC50 > 50 M, Fig. 2D). Mambaquaretin-1 uses its first loop to interact with V2R, like aprotinin to inhibit trypsin (Fig. 2 B–D). On their own, at concentrations up to 10 M, neither -DTX nor aprotinin was found to bind V2R (Fig. 2B).The X-ray structure of mambaquaretin-1 (variant KA) was obtained from crystals diffracting to 1.06 Å resolution (Fig. 2E, SI Method 2: Crystallization and Structure Determination, Table S2, and Fig. S5). The structure is highly compact with extremely low mobility apart from the first loop including the two adjacent Phe residues in positions 17 and 18. A model of WT mambaquaretin-1 can be built from the variant K15A16 by K15N and A16G substitutions with the selection of the closest Asp rotamer to that used by the Lys (Fig. 2F). Mambaquaretin-1 has a large number of positively charged residues distributed throughout the sequence and only two negative ones: the conserved Glu-49 and the C-terminal Gly-57. The backbone of mambaquaretin-1, that of -DTX, and those of three other serine-protease inhibitors superimpose very well with an rmsd on C- between 0.57 Å and 0.94 Å (Fig. 2G). Mambaquaretin-1 was submitted to the MEROPS database (24). It has been classified as belonging to the I2 family that contains diverse Kunitz peptides found in animals, similar to -DTX and aprotinin.
Fig. 2.
Mambaquaretin-1 binds V2R with its first loop. (A) Sequence comparison between mambaquaretin-1, its KA variant, -DTX, Australian common brown snake textilinin-1, aprotinin (BPTI), and cattle tick clotting inhibitor boophilin. Cysteines are shaded light green, positively charged residues are shaded blue, negatively charged residues are shaded red, and other conserved residues are shaded gray. Orange and green circles indicate residues critical for -DTX and BPTI activity, respectively. (B) Binding inhibition of 3H-AVP on hV2R by mambaquaretin-1, its three variants, BPTI, and -DTX. (C) Trypsin inhibition by mambaquaretin-1 and its NG/KA variant. (D) Current inhibition of Kv1.1 channels obtained by plotting the percentage of blocked current in function of increasing toxin concentrations by mambaquaretin-1, N-ter deletion, and S3K variant. (E) X-ray structure of mambaquaretin-1 KA in stick representation colored according to B value (light blue to red). (F) Cartoon representation of mambaquaretin-1 and the KA variant showing the preponderance of positively charged residues. (G) Superposition on C- of mambaquaretin-1 KA (PDB ID: 5M4V), -DTX [PDB ID: 1DTX (17)], textilin-1 [PDB ID: 3D65 (18)], BPTI [PDB ID: 1B0C (19)], and boophilin [PDB ID: 2ODY (20)] with rmsd between the structures from PyMOL alignment.
Table S2.
Statistics for mambaquaretin–KA structure determination
| PDB code 5M4V | |
| Data collection | |
| Synchrotron source | ESRF, ID29 |
| Wavelength, Å | 0.976251 |
| Space group | P4212 |
| Unit-cell parameters, Å | 63.86, 63.86, 32.98 |
| Molecules/asymmetric unit | 1 |
| Resolution, Å | 45.14–1.06 |
| , % | 8.0 |
| , % | 7.8 |
| Mean I/(I) | 19.36 |
| , % | 100.0 |
| Completeness, % | 99.9 |
| Multiplicity | 23.76 |
| Refinement | |
| Resolution, Å | 45.14–1.06 |
| No. reflections | 29,915 |
| , % | 13.07 |
| , % | 15.57 |
| rmsds | |
| Bond lengths, Å | 0.029 |
| Bond angles, ° | 2.709 |
| Ramachandran* | |
| Favored, % | 64 |
| Outliers, % | 0 |
PDB code 5M4V. *Values from PDB Validation server.
Fig. S5.
Electron density maps. (A) Fitted electron density map at 1.06 Å showing the central stretch 21FYYS21 for the final refined structure. (B) Experimental radiation damage-induced phasing (RIP) map with automatically built polyalanine chain obtained from data collected from a mambaquaretin KA crystal that has suffered radiation damage. The 21FYYS21 is easily interpretable and the disulfide Cys5 to Cys55 is clearly visible.
Mambaquaretin-1 Competitively Antagonizes V2R-Induced Signaling Pathways.
By acting on V2R, vasopressin activates at least three signaling pathways: a Gs-coupled stimulation of adenylyl cyclase that initiates intracellular cAMP production, an arrestin-mediated V2R desensitization, and a stimulation of MAP kinase phosphorylation. Mambaquaretin-1 alone was unable to activate these signaling pathways (Fig. 3 A, C, and D), but could antagonize all of them with a Ki of 12.0 nM (PA2 = 7.92 0.02, n = 3) for cAMP production in CHO cells stably expressing V2R, 110 nM (PA2 = 7.0 0.2, n = 3) for -arrestin-1 mobilization in a tsA cell line transiently transfected with -arrestin-1–YFP and hV2R-Rluc, and 210 nM (PA2 = 6.9 0.2, n = 7) for MAP kinase phosphorylation in a tsA cell line transiently transfected with hV2R (Fig. 3 A, C, and D). Increasing concentrations of mambaquaretin-1 induced parallel rightward shifts of the activation curves. Arunlakshana–Schild plots show a purely competitive behavior between vasopressin and mambaquaretin-1 on the three different activation pathways because the IC50 regression can be linearized with unitary slope (Fig. 3 B, D, and F). Mambaquaretin-1 was tested on immortalized KC3AC1 renal cells that naturally express V2R. These cells, isolated from the cortical collecting ducts of a transgenic mouse, display an epithelial polarized phenotype when cultivated on filters (25). 3H-AVP was found to bind to KC3AC1 cells with an affinity between 4 nM and 6 nM and a of 21,000 receptors per cell. 1-Desamino-8-D-arginine vasopressin (dDAVP) induced cAMP production in a dose-dependent manner with an of 0.3 0.2 nM, whereas in the presence of 1 M mambaquaretin-1, its was 60-fold higher (18 1.2 nM; Fig. 3G). Moreover, mambaquaretin-1 antagonized the effect of 0.8 nM dDAVP () with an of 37 15 nM. No change in cAMP production was observed with mambaquaretin-1 alone (Fig. 3H).
Fig. 3.
V2R antagonist activity of mambaquaretin-1 (MQ-1). (A, C, and E) Competitive inhibition of AVP-induced (A) cAMP production in stable CHO-hV2R cell line, (C) -arrestin-1 recruitment by BRET--arrestin-1–YFP and hV2R-Rluc tsA transfected cell line, and (E) MAP kinase phosphorylation on hV2R tsA transfected cell line. (B, D, and F) Corresponding Arunlakshana–Schild plots. (G) Antagonistic effect of mambaquaretin-1 on cAMP production in dDAVP-stimulated renal KC3AC1 cells. (H) Effect of increasing concentrations of mambaquaretin-1 on cAMP production in the absence or in the presence of 0.8 nM of dDAVP in renal KC3AC1 cell line. All panels are representative of at least three independent experiments and Schild representations are plotted as mean SEM. mBU, milliBRET unit.
Aquaretic Effect of Mambaquaretin-1.
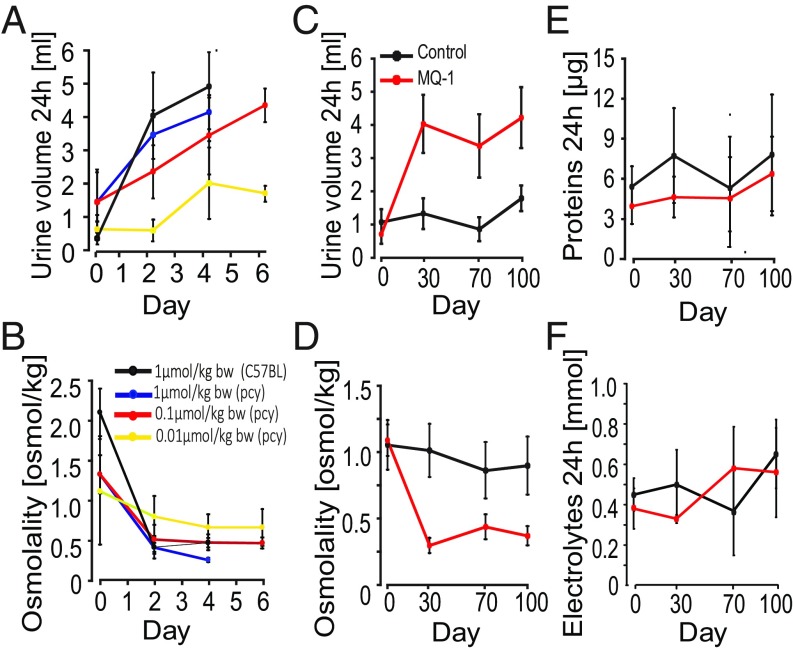
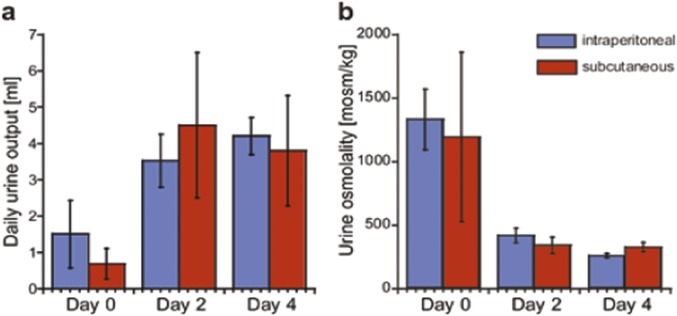
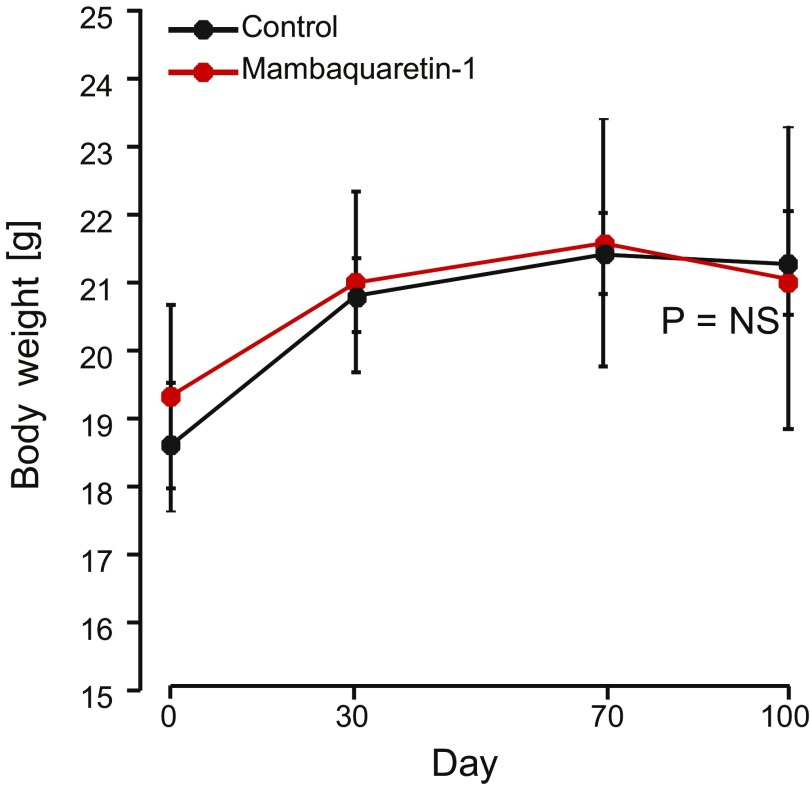
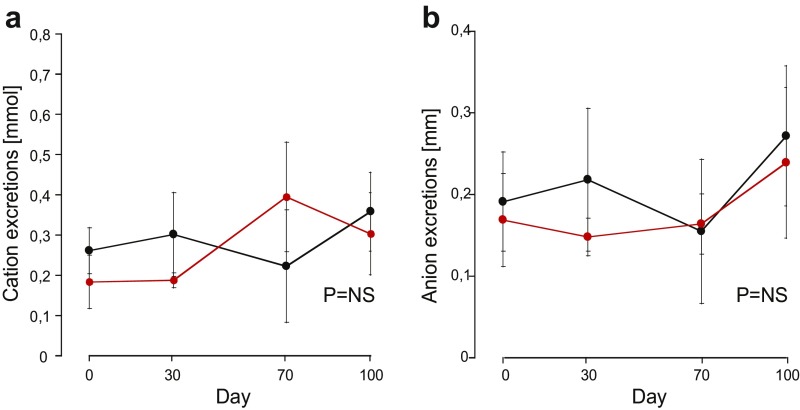
The CD1-pcy/pcy mouse strain suffers from type 3 nephronophthisis, similar in many aspects to ADPKD, caused by a spontaneous missense mutation (T1841G) in the gene orthologous to human NPHP3 (26). This strain is a pertinent model for in vivo evaluation of renoprotective efficacy of novel drug candidates (6). Ten-week-old C57BL/6 female mice were given 1 mol/kg by body weight (BW) mambaquaretin-1 via daily intraperitoneal (i.p.) injections for 6 d whereas female CD1-pcy/pcy mice received three different doses of mambaquaretin-1: 0.01 > mol/kg BW, 0.1 > mol/kg BW, and 1 mol/kg BW. We used female mice to maximize the likelihood to observe a therapeutic effect of mambaquaretin-1. Urine output increased and urine osmolality decreased dramatically under mambaquaretin-1 treatment without differences between the two mouse strains (Fig. 4 A and B). For the two largest doses of mambaquaretin-1, a marked diuretic effect was observed within 1 d after the first injection. The effect reached a maximum with urine volumes around 4 mL/d. For the 0.01-mol/kg BW dose of mambaquaretin-1, four injections were necessary to provoke an increase in diuresis with a stabilized urinary volume around 2 mL/d. The diuresis caused by mambaquaretin-1 was paralleled by a decrease in urine osmolality consistent with an aquaretic effect in vivo. Intraperitoneal and subcutaneous injections gave identical biological results in terms of urine volume and osmolality (Fig. S6). The i.p. route was found to be more practical. Starting at 10 wk of age, CD1-pcy/pcy female mice received 0.1 mol/kg BW (n = 6) mambaquaretin-1 intraperitoneally for 99 d, whereas control mice received saline solution (n = 7). Mambaquaretin-1 was well tolerated as judged by the equivalent body weight (21.1 2.2 g vs. 21.3 0.8 g in controls, P = 0.41, Fig. S7) and by their normal social behavior during the course of the experiment. In addition, we did not notice any difference in the locomotive behavior, in the exterior aspect, or in the amount of food or water ingested between the two groups. Constant increase in diuresis and decrease in urine osmolality were observed at each time point until the end of the trial (Fig. 4 C and D). Protein and electrolyte excretions in the urine samples were similar in the treated and control groups (Fig. 4 E and F). No differences were found in cation and anion levels (Fig. S8).
Fig. 4.
Aquaretic effect of mambaquaretin-1. (A and B) Increase in urinary volume (A) and decrease in urine osmolality (B) after daily administration of mambaquaretin-1 at three doses to pcy mice and to C57BL/6 mice (violet curve, one dose) for 6 d. (C–F) Monitoring of (C) diuresis, (D) urine osmolality, (E) excretion of proteins, and (F) electrolytes during the 99-d treatment with 0.1 mol/kg BW of mambaquaretin-1. Data are presented as mean SD, n = 6–7.
Fig. S6.
Effect on urine output and urine osmolality of CD1-pcy/pcy mice after daily intraperitoneal or subcutaneous injections of mambaquaretin-1 at a dose of 1 mol/kg body weight. (A) Total urine volume (24 h). (B) Urine osmolality. Data are presented as mean SD, n = 6–7. P = NS (not significant), one-way t test.
Fig. S7.
Effect of mambaquaretin-1 at a dose of 0.1 mol/kg BW on BW of CD1-pcy/pcy mice after daily intraperitoneal injections for 99 d. Data are presented as mean SD, n = 6–7. P = NS (not significant), one-way t test.
Fig. S8.
Effect of mambaquaretin-1 at a dose of 0.1 mol/kg BW on cation and anion urinary excretions of CD1-pcy/pcy mice after daily intraperitoneal injections for 99 d. (A) Cation urinary excretions; (B) anion urinary excretions. Data are presented as mean SD, n = 6–7. P = NS (not significant), one-way t test.
Blood creatinine and urea, two important parameters related to renal function, were measured at the end of the trial (Fig. S9 A and B). No difference in urea concentration was noted between the two groups (73.1 6.6 mg/dL vs. 75.9 11.9 mg/dL in controls, P = 0.3). However, a threefold decrease of the creatinine levels was measured in the mambaquaretin-1–treated group (0.59 0.11 mg/dL vs. 1.86 0.73 mg/dL in controls, P = 0.002). Urea and creatinine levels were consistent with the mambaquaretin-1–treated mice having better renal function.
Fig. S9.
Effect of mambaquaretin-1 (MQ-1) at a dose of 0.1 mol/kg BW on (A) blood urea, (B) blood creatinine, and (C) heart weight of CD1-pcy/pcy mice after daily intraperitoneal injections for 99 d. P = NS (not significant), one-way t test. n = 6–7.
Mambaquaretin-1 Inhibits Cyst Progression in pcy Mice.
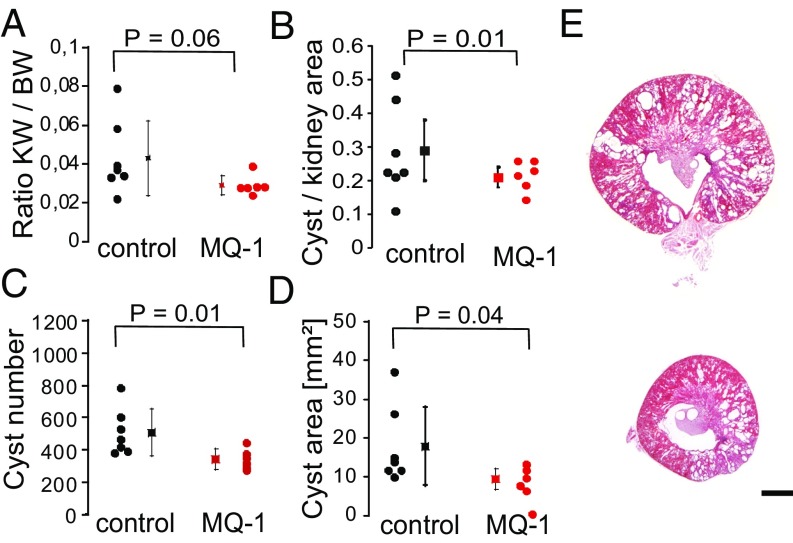
By the end of the treatment, mice were perfusion fixed and organs were removed for analysis. Heart weights were found to be equivalent between treated and nontreated female mice (113 10 mg vs. 114 10 mg in controls, n = 6–7, P = 0.45; Fig. S9C). Kidneys from mambaquaretin-1–treated mice appeared smaller relative to those from control mice (kidney to body ratio: 0.029 0.005 vs. 0.043 0.018 in controls, P = 0.06; Fig. 5A). The renoprotective effect of mambaquaretin-1 was clearly discernible in quantitative analysis of imaged kidney sections. The ratio of cyst to kidney area was significantly smaller after treatment with mambaquaretin-1 (0.21 0.03 vs. 0.29 0.09 in controls, decrease by 28%, P = 0.03; Fig. 5B). The average number of renal cysts was reduced by 33% (from 509 134 in control animals to 342 57 in those treated with mambaquaretin-1, P = 0.01; Fig. 5C). The total area of renal cysts was decreased by 47% (from 17.9 9.3 mm2 in controls to 9.4 2.4 mm2 in the treated mice, P = 0.04; Fig. 5D). Finally, analysis of representative kidney sections (Fig. 5E) showed a globally beneficial effect of mambaquaretin-1. The tests carried out on a limited cohort of mice demonstrated that a low dose of mambaquaretin-1 (0.1 mol/kg BW) was effective.
Fig. 5.
Beneficial effect of treatment with mambaquaretin-1 (MQ-1) in pcy mice. Ratio of kidney weight to body weight (KW/BW) (A), ratio of cyst area to kidney area (B), cyst number (C), cyst area (D), and representative H&E-stained sections from kidneys of nontreated pcy mice (E, Top) and treated with mambaquaretin-1 (E, Bottom). P values were calculated with a t test by comparing treated and control animals, n = 6–7. (Scale bar, 2 mm.)
SI Method 1: Mambaquaretin-1 Identification
Fraction F was further purified by reverse-phase HPLC, using a linear gradient from 0% to 100% acetonitrile and 0.1% trifluoroacetic acid in 100 min. Fraction D was finally purified on a C18 Vydac column (4.6 mm, 5 m, 15 cm, flow = 1 mL/min), using a gradient of 0.5% acetonitrile per minute. Venom fractionation was done only once. Venom fractions and membrane protein concentrations were determined using the Bio-Rad protein assay with BSA as a standard. Mambaquaretin-1 sequence was determined by Edmans degradation and mass analysis. N-terminal sequencing of the fraction FDA was performed as described in ref. 13. Sequencing by in-source decay (ISD) MALDI-TOF was carried out with 15 g of fraction FDA treated with 2 L of 100 mM Tris(carboxyethyl)phosphine at 50 °C and purified on a Zip-Tip C18 microcolumn. ISD experiments used 1,5-diaminonaphthalene (Acros) as described in ref. 13. For peptide mass fingerprinting, 300 ng of purified toxin was reduced in 5 L of 50 mM NH4HCO3, pH 8, by 2 L of 250 mM DTT for 30 min at 56 °C, followed by 2.2 L of 500 mM iodoacetamide during 1 h in the dark at room temperature. The mass analysis was made as described in ref.13. Tandem mass spectrometry experiments were performed using LIFT-TOF/TOF technology (45). Data were acquired with Flex Control 3.0. Resulting spectra were analyzed with Biotools 3.2 and Sequence Editor 3.2 (Bruker Daltonics).
SI Method 2: Crystallization and Structure Determination
Crystallization trials were set up for the WT, the truncated mambaquaretin-1 lacking its four first residues, and the KA variant. The trials were set up with 250 g peptides resuspended at a concentration of 7 mg/mL in 50 mM sodium acetate, pH 5.5, for which the largest amount of protein was available. The other constructs were resuspended at the same concentration in the same buffer. The screen consisted of 24 conditions consisting of high precipitation strength precipitants and additives used in the crystallization of BPTI. Crystallization was carried out in sitting-drop CrystChem plates with 1-L drops of protein and 1-L drops of reservoir solution consisting of 36% monomethyl polyethylene glycol 2,000 (MPEG-2K), 450 mM NaCl, 90 mM KSCN, and 100 mM imidazole-HCl, pH 7.5, and allowed to equilibrate in a constant temperature incubator at 20 °C. The mixed cryoprotectant solution consisted of 5% diethylene glycol, 5% ethylene glycol, 5% MPD, 5% glycerol, 5% 1,2-propanediol, 5% DMSO, 18% MPEG-2K, and 100 mM linear mixed buffer: sodium acetate, ADA, and bicine, 20% at pH 4 and 80% at pH 10. Crystals were obtained from 36% MPEG-2K, 450 mM NaCl, 90 mM KSCN, 100 mM imidazole HCl, pH 7.5. A screen consisting of 12 conditions for the WT did not give crystals, even after cross-seeding with the KA mutant. A screen consisting of 6 conditions for the shortened construct also gave no crystals. Seven crystals were used for data collection on beamline ID29 at the European Synchrotron Radiation Facility in Grenoble, France. Processing was carried with XDS and XSCALE (46) with the resolution cutoff chosen on the basis of a mean I/(I) better than 1 and a greater than 50%. The structure was solved by molecular replacement using Phaser (47) and aprotinin as a model (PDB ID: 1B0C) (19). Model building was done with COOT (48) and refinement with REFMAC5 (49) and Phenix (50). Given the high MPEG concentration used in the crystallization, two crystals were flash-cooled in liquid nitrogen without prior transfer to a cryoprotectant solution. These two crystals diffracted to 1.27 Å and 1.15 Å. The best diffraction, at 1.06 Å, was obtained from a crystal transferred to a mixed cryoprotectant solution consisting of 5% diethylene glycol, 5% ethylene glycol, 5% MPD, 5% glycerol, 5% 1,2-propanediol, 5% DMSO, 18% MPEG-2K, 100 mM mixed linear buffer sodium acetate, ADA, and bicine 20% at pH 4 and 80% at pH 10. The overall resolution for these data was 1.38 Å.
Discussion
Currently V2R inhibition represents the most promising pharmaceutical strategy against PKD (27). We report the identification of mambaquaretin-1, a venom peptide that strongly antagonizes V2R with a therapeutic potential against renal polycystic disease. Venom components target principally enzymes and ionic channels involved in the control of the hemostatic, nervous, and cardiovascular systems (28). Components acting on the GPCR superfamily are rare and represent less than 1% of the characterized toxins. Mamba snakes (Dendroaspis sp.) are among the most dangerous snakes in Africa because their toxins act on potassium channels and acetylcholinesterase. Currently, their venom is also the richest source of GPCR ligands. These ligands are all three-finger–fold toxins active on amine-sensitive receptors (29–33). Mambaquaretin-1 is unique because it is a Kunitz-fold toxin active on a peptide-sensitive receptor. Mambaquaretin-1 is a minor component and its role as part of the venom has not been determined. Kunitz-type toxins were first identified in the early 1970s in black mamba (Dendroaspis polylepis) venom (34). Kunitz peptides are also common in other snakes, scorpions, spiders, ticks, and sea anemones and are known to interact with diverse targets. These include calcium channels (35), TRPV1 (36), cysteine proteases (37), or ASIC channels. Prevalently, individual Kunitz toxins act as potassium channel blockers (38), inhibitors of serine proteases (22), or both (39). Mambaquaretin-1 effectively and selectively targets V2R, expanding the repertoire of activities associated with the Kunitz fold. By using the first loop instead of the N-terminal part to interact with V2R, mambaquaretin-1 mimics aprotinin rather than -DTX in its binding strategy. The Kunitz-fold versatility is revealed by simple residue substitutions in mambaquaretin-1 sequence that significantly improve alternatively K and trypsin inhibition. Mambaquaretin-1 is a polypeptide five times bigger than vasopressin. Its great selectivity toward V2R may be related to a binding not confined to the orthosteric pocket. Certain hV2R loops peripheral to the orthosteric pocket are acidic whereas mambaquaretin-1 has a strongly basic character (net charge +9). Charge complementarity may help drive complex formation. The larger interaction surface, compared with vasopressin and vaptans, may also explain why mambaquaretin-1 acts as a full antagonist in three intracellular signaling pathways controlled by V2R activation. It can be speculated that its binding may induce a frizzed and nonfunctional V2R conformation that could have advantages in PKD treatment. The physiological consequences of a complete blockage of V2R will need a more detailed examination. The most promising finding is that mambaquaretin-1 is an efficient renoprotective agent able to slow down the progression of ADPKD in the murine model of the disease without any detectable adverse effects and no apparent toxicity up to 1 mol/kg BW. The pcy mice treated with mambaquaretin-1 compared with untreated animals had fewer smaller cysts. The renoprotective effect of mambaquaretin-1 could be due to lower cAMP levels in V2R-expressing cells. We demonstrated that mambaquaretin-1 inhibited the dDAVP-induced cAMP production in a dose-dependent manner. All therapeutic effects observed for mambaquaretin-1 were similar to those reported for vaptans. Despite its liver toxicity, tolvaptan is currently the key drug for PKD treatment (40, 41). Mambaquaretin-1, being a natural peptide, is unlikely to share the adverse effects associated with long-term vaptan use. Mambaquaretin-1 being the most selective ligand for V2R is likely to have fewer side effects because of its better selectivity. Animal venoms constitute a natural library of several million molecules, largely unexplored at present as a source of potential drugs. Six peptidic drugs derived from venoms are now on the market. Tens of other candidates are in clinical development and hundreds of patents have been filed, highlighting their therapeutic potential. Mambaquaretin-1 could be added to this list as a promising candidate for PKD treatment.
Materials and Methods
Unless mentioned otherwise, all chemicals were obtained from Sigma-Aldrich.
Identification of Mambaquaretin-1.
One gram of Dendroaspis angusticeps venom (Latoxan) was separated into 13 peaks by ion exchange as described (42) and the fraction F in seven fractions as described in SI Method 1: Mambaquaretin-1 Identification.
Peptide Synthesis and Crystal Structure Determination.
Mambaquaretin-1 and its variants were synthesized on an Applied Biosystems 433A peptide synthesizer, purified, and folded according to a method previously described (43). Briefly, this involved solid-phase synthesis, using an Fmoc strategy on 50 mol of Chemmatrix resin loaded with the glycine residue. The linear peptide was folded in the presence of 25% glycerol and oxidized and reduced glutathione (1 mM) in Tris buffer at pH 8 for 16 h at room temperature (13). Crystallization trials were set up for the WT, the truncated mambaquaretin-1 lacking its four first residues, and the KA variant as described in SI Method 2: Crystallization and Structure Determination.
Assays.
Binding assays were performed using radioactive tracers on cell membrane preparation from CHO cells expressing the receptor of interest as described in SI Method 3: Radioligand Binding Assay. Selectivity profiles of mambaquaretin-1 have been subcontracted to a service company as described in SI Method 4: Selectivity Profile of Mambquaretin-1. Voltage-gated ion channels pharmacology was performed on Xenopus oocytes expressing potassium and sodium channels as described in ref. 44 and in SI Method 5: Voltage-Gated Ion Channels Pharmacology. Trypsin inhibition assays were performed by monitoring hydrolysis of the fluorogenic substrate Mca-R-P-K-P-V-E-NVal-W-R-PK(Dnp)-NH2 as described in SI Method 6: Trypsin Inhibition Assays. Cell-based assays were performed on eukaryotic cells expressing the vasopressin-sensitive receptors as described in SI Method 7: Cell-Based Assays. All animal assays were conducted in accordance with the German Animal Protection Law and are described in SI Method 8: Animal Assays.
SI Method 3: Radioligand Binding Assay
The 3H-AVP, 125I-GVIA, and membrane preparations from CHO cells expressing oxytocin and vasopressin receptors V1a, V1b, and V2 subtypes were purchased from PerkinElmer. Binding experiments were performed using 1 nM 3H-AVP in a 100-L reaction mixture at room temperature in buffer composed of 50 mM TrisHCl, pH 7.4, 10 mM MgCl2, and 1 g/L BSA, with increasing concentrations of competitors. Nonspecific binding was measured in the presence of 1 M AVP. Binding experiments on N-type calcium channels were performed as described in ref. 51. Incubation was stopped by filtration through 96 GF/C filter plates preincubated with 0.5% polyethylenimine. A total of 25 L of Microscint 0 was added onto each dry filter and the radioactivity was quantified on a TopCount beta counter with a 33% and 45% yield for tritium and iodine, respectively (PerkinElmer). Competition binding data were fitted to a one-site/state inhibition mass action curve using Kaleidagraph (Synergy software). IC50 values were converted to , using the Cheng–Prusoff equation (52) and 1.1 nM as . Data represent at least three independent experiments performed in duplicate and are presented as mean SD.
SI Method 4: Selectivity Profile of Mambaquaretin-1
Electrophysiological assays were performed by GE Healthcare (Millipore Corporation), using 1 M of the mambaquaretin-1 for activities on cardiac ion channels Nav1.5, Cav1.2, Kv4.3/KChIP2, Kv1.5, KCNQ1/mink, Kir2.1, hERG, and HCN4. Mambaquaretin-1 did not exhibit significant inhibition of any of the ion channels at a concentration of 1 M. FLIPRassays were conducted by GE Healthcare to profile the mambaquaretin-1 (1 M) for agonist and antagonist activities on 156 GPCRs: M1, M2, M3, M4, M5, A1, A2B, A3, alpha1A, alpha1B, alpha1D (Delta 2 to 79), alpha2A, beta 1, beta 2, beta 3, C3aR, C5aR, AT1, APJ, BB1, BB2, BB3, Bradykinin B2, CGPR1, CaS, CB1, CB2, ChemR23, CCR1, CCR10, CCR2B, CCR3, CCR4, CCR5 rhesus macaque, CCR6, CCR7, CCR8, CCR9, CX3CR1, CXCR1, CXCR2, CXCR3, CXCR4, CXCR5, CXCR6, XCR1/GPR5, CCK1, CCK2, CRF1, CRF2, D1, D2L, D4, D5, ETA, ETB, GPR41, GPR43, GABAB1b, GAL1, GAL2, Ghrelin receptor, GIP, GLP-1, GLP-2, glucagon, secretin receptor, mGlu1, mGlu2, TSH, GnRH, H1, H2, H3, GPR99, GPR54, BLT1, CysLT1, CysLT2, LPA1, LPA3, LPA5/GPR92, S1P1, S1P2, S1P3, S1P4, S1P5, MrgD, MRGX1, MRGX2, MCHR1, MCHR2, MC2, MC4, MC5, motilin receptor, NMU1, NMU2, NPBW1/GPR7, Y2, Y4, NTR1, FPR1, FPRL1, GPR109A, Delta, Kappa, Mu, NOP/ORL1, OX1, OX2, GPR39, OT, GPR103/QRFP, P2RY1, P2RY2, P2RY4, P2RY11, P2RY12, PAF, PK1, PK2, PRP, DP, EP1, EP2, EP3, EP4, FP, IP1, TP, trypsin-activated PARs, thrombin-activated PARs, PTH1, PTH2,5-HT1A, 5-HT2A, 5-HT2B, 5-HT2C, 5-HT4B, 5-HT6, SST2, SST3, SST4, SST5, GPR68/OGR1, SUCNR1/GPR91, NK1, NK2, NK3, TRH, GPR14, V1A, V1B, PAC1 long isoform, VPAC1, and VPAC2.
SI Method 5: Voltage-Gated Ion Channels Pharmacology
For the expression of the potassium and sodium channels in Xenopus oocytes, the linearized plasmids were transcribed using the T7 or SP6 mMESSAGEmMACHINE transcription kit (Ambion) as previously described (44). Two-electrode voltage-clamp recordings were performed as described in ref. 53. Data were fitted with the Hill equation: y = 100/[1 +(IC50/[toxin])h], where y is the amplitude of the toxin-induced effect, IC50 is the toxin concentration at half-maximal efficacy, [toxin] is the toxin concentration, and h is the Hill coefficient. All data represent at least three independent experiments and are presented as mean SD.
SI Method 6: Trypsin Inhibition Assays
Trypsin inhibition assays were carried out in 200 L of 50 mM TrisHCl buffer (pH 6.8), 100 mM NaCl, 10 mM CaCl2 at 20 °C with a fluorogenic substrate Mca-R-P-K-P-V-E-NVal-W-R-PK(Dnp)-NH2 (RD Systems) and trypsin at 0.4-nM concentration (Sigma Aldrich). Continuous assays were performed by recording the increase in fluorescence induced by the cleavage of the fluorogenic substrate, using a Fluoroscan Ascent photon counter spectrophotometer, y = 100/[1 +(IC50/[toxin])h], where y is the amplitude of the toxin-induced effect, IC50 is the toxin concentration at half-maximal efficacy, [toxin] is the toxin concentration, and h is the Hill coefficient. All data represent at least three independent experiments and are presented as mean SD.
SI Method 7: Cell-Based Assays
The SV40 temperature-sensitive T-antigen–transformed HEK 293 cell line tsA-201 (purchased from ECACC) and the CHO cell line expressing hV2R were cultured at 37 °C in 5% CO2 in DMEM containing 10% FCS and 100 units/mL penicillin/100 g/mL streptomycin supplemented with 0.1 mM nonessential amino acids and 0.4 mg/mL geneticin for CHO cells. The renal KC3AC1 cell line established by targeted oncogenesis was isolated from microdissected cortical collecting ducts of a transgenic mouse in which expression of the SV40 T antigen was placed under the control of the proximal promoter (P1) of the human MR gene 226. These cells were cultured on collagen I-coated (Institut Jacques Boy) Petri dishes with an epithelial culture medium composed of DMEM/Ham’s F12 (1:1), 2 mM glutamine, 50 nM dexamethasone, 50 nM sodium selenite, 5 g/mL transferrin, 5 g/mL insulin, 10 ng/mL EGF (Tebu), 2 nM T3, 100 units/mL penicillin/streptomycin, 20 mM Hepes (pH 7.4), and 5% dextran charcoal-treated serum. For the quantification of cAMP, stable CHO cells expressing the hV2R were seeded at 5,000 cells per well into a 96-well plate and KC3AC1 cells were seeded at 50,000 cells per well into a collagen I-coated 96-well plate. CHO-hV2R cells were preincubated for 15 min at 37 °C in the absence or in the presence of increasing mambaquaretin-1 concentrations and then stimulated by increasing AVP concentrations in a total 50 L volume incubation medium containing DMEM, 5% BSA, and 0.1 mM Ro201724. KC3AC1cells were stimulated with increasing dDAVP concentrations in the absence or presence of 1 M mambaquaretin-1 without preincubation. Competition experiments in KC3AC1 cells were performed by adding simultaneously buffer (mambaquaretin-1 alone) or 0.8 nM dDAVP and increasing doses of mambaquaretin-1. Experiments lasted for 30 min at 37 °C and were stopped by the addition of lysis buffer from the cAMP Dynamic 2 kit (Cisbio International). The addition of donor and acceptor entities (100 L total volume per well) elicited a FRET signal (F% = 100 (Rpos – Rneg)/Rneg) with Rpos fluorescence ratio (665/620 nm) in wells incubated with both donor- and acceptor-labeled antibodies, and Rneg being the same ratio for the negative control with donor fluorophore-labeled antibody. This signal was then transformed into cAMP concentration in wells, using a calibration curve. To characterize arrestin–V2 interaction, 2.5 × 10⁶ tsA cells transiently transfected with 150 ng of the hV2Rluc plasmid and with 1 g of the -arrestin-1–YFP plasmid were seeded in 6-well plates. Forty-eight hours after transfection, cells were washed with KREBS buffer containing 146 mM NaCl, 4.2 mM KCl, 0.5 mM MgCl2, 1 mM CaCl2, 10 mM Hepes (pH 7.4), and 1 mg/mL glucose and suspended in 1 mL of this buffer. BRET measurements between the V2-Rluc and the -arrestin-1–YFP were performed in 96-well plates with a final volume of 50 L containing 30 L of cell suspension (75,000 cells), 10 L of KREBS buffer or the mix of ligands containing either increasing concentrations of AVP or mambaquaretin-1. A total of 10 L Coelenterazine (luciferase substrate) was then added to the mix and incubated at 37 °C before BRET measurements were performed in a BertholdTech Mithras LB940, using MikroWin software. The kinetics of interaction were performed and the saturable specific BRET signal measured 600 s after AVP addition to the cells transfected with both donor V2-Rluc and acceptor -arrestin–YFP was calculated using the following equation: BRET in milliBRET units (mBU) = 1,000 (Rpos – Rneg), with Rpos being the fluorescence ratio (530/485 nm) calculated in wells incubated with both donor V2-Rluc and acceptor -arrestin–YFP and Rneg being the same ratio for the negative control incubated only with the donor V2-Rluc. Activation curves were plotted to the log of AVP concentrations and fitted to the Hill equation to extract the EC50, using Graphpad Prism software. The corresponding Arunlakshana–Schild plots allowed determining Schild parameters (pA2 and slope) from the Schild equation. Experiments were repeated at least three times on different cultures, and each condition was extracted from the kinetics only once. Data for Schild representation are presented as mean SEM. The MAP kinase phosphorylation activity was measured on 10 × 106 tsA cells transiently transfected with 500 ng of an expression plasmid for human V2R and were plated into polyornithine-coated 96-well plates with 75,000 cells per well with DMEM containing 10% serum. Eight hours and 24 h later, the cells were starved with medium without serum. Stimulation was performed 27 h later. Transfected cells were incubated for 7 min at 37 °C with DMEM in the absence (control condition) or with increasing doses of AVP (stimulated condition) or with a mix of AVP and mambaquaretin-1 (stimulated condition with inhibitor). Then, the medium was replaced with 50 L lysis buffer from the Cellul’ERK kit (Cisbio International) and the cells were rocked gently for 30 min at room temperature. ERK phosphorylation measurement was performed with the time-resolved fluorescence energy transfer-based Cellul’ERK kit (Cisbio Bioassays) according to the manufacturer’s recommendation. In a 384-well plate, 2 L of the donor-labeled antibody and then 2 L of the acceptor-labeled antibody were successively added to 16 L lysed cells. After 2 h incubation at room temperature, fluorescence emissions were measured on a RubyStar fluorometer. The specific FRET signal was calculated using the following equation: specific FRET ratio = (Rpos – Rneg), where Rpos and Rneg are the ratio of the signals measured at 665 nm and 620 nm when both donor- and acceptor-labeled antibodies were added to lysed cells (Rpos) or to lysis buffer alone (Rneg). Activation curves were plotted to the log of AVP concentrations and fitted to the Hill equation to extract the EC50, using Graphpad Prism software. The corresponding Arunlakshana–Schild plots allowed determining Schild parameters (pA2 and slope) from the Schild equation. Experiments were repeated at least three times on different cultures, each condition in triplicate. Data are presented as mean SEM.
SI Method 8: Animal Assays
Mambaquaretin-1 (1 mg/mL in 0.9% NaCl) was administered daily at different doses to 10-wk-old female CD1-pcy/pcy and C57BL/6 mice via intraperitoneal or subcutaneous routes. Urine was collected in metabolic cages for 24 h and centrifuged for 30 min at 20,800 × g before urine osmolality was determined with a Knauer osmometer. Creatinine and urea concentrations were determined with the commercial enzyme-based kits (LT-SYS creatinine and urea kits; Eberhard Lehmann GmbH). In the case of creatinine, absorption was measured at 564 nm and in the case of urea, absorption was measured at 340 nm. For the therapeutic trial, mambaquaretin-1 was daily administered via i.p. injections at a dose of 0.1 mol toxin/kg BW to female CD1-pcy/pcy mice starting at the age of 10 wk. Ninety-nine days later the mice were perfusion fixed with 4% paraformaldehyde. Kidneys and hearts were removed and
weighed. For furtherwere removed and weighed. For further processing, the kidneys were embedded in paraffin. The 7-m-thick paraffin sections were stained with Sirius Red to quantify the fibrotic changes and with H&E to quantify all other parameters with Image J ver. 1.2 software. Cysts were included in the analysis only if they exceeded an area of 0.05 mm2. Statistical analysis was performed using IBM SPSS Statistics ver. 21. To detect differences in cyst area and average size of cysts the one-way t test was used. The differences in urine volume and urine osmolality were analyzed using the paired t test. All experiments were approved by the local government (Regierung der Oberpfalz).
Acknowledgments
We are grateful to the European Synchrotron Radiation Facility synchrotron for allocation of beam time and to Dr. Leonard Gordon for assistance during data collection on beamline ID29.
Footnotes
The authors declare no conflict of interest.
This article is a PNAS Direct Submission.
Data deposition: The atomic coordinates and structure factors have been deposited in the Protein Data Bank, www.pdb.org (PDB ID code 5M4V).
This article contains supporting information online at www.pnas.org/lookup/suppl/doi:10.1073/pnas.1620454114/-/DCSupplemental.
References
- 1.Sun Y, Zhou H, Bx Yang. Drug discovery for polycystic kidney disease. Acta Pharmacol Sin. 2011;32:805–816. doi: 10.1038/aps.2011.29. [DOI] [PMC free article] [PubMed] [Google Scholar]
- 2.Willey CJ, et al. 2016. Prevalence of autosomal dominant polycystic kidney disease in the European Union. Nephrol Dial Transplant, gfw240.
- 3.Torres VE, Harris PC. Autosomal dominant polycystic kidney disease: The last 3 years. Kidney Int. 2009;76:149–168. doi: 10.1038/ki.2009.128. [DOI] [PMC free article] [PubMed] [Google Scholar]
- 4.Gattone VH. Emerging therapies for polycystic kidney disease. Curr Opin Pharmacol. 2005;5:535–542. doi: 10.1016/j.coph.2005.04.016. [DOI] [PubMed] [Google Scholar]
- 5.Mangoo-Karim R, et al. Renal epithelial fluid secretion and cyst growth: The role of cyclic AMP. FASEB J. 1989;3:2629–2632. doi: 10.1096/fasebj.3.14.2480260. [DOI] [PubMed] [Google Scholar]
- 6.Gattone VH, Wang X, Harris PC, Torres VE. Inhibition of renal cystic disease development and progression by a vasopressin V2 receptor antagonist. Nat Med. 2003;9:1323–1326. doi: 10.1038/nm935. [DOI] [PubMed] [Google Scholar]
- 7.Caroli A, et al. Effect of long-acting somatostatin analogue on kidney and cyst growth in autosomal dominant polycystic kidney disease (ALADIN): A randomised, placebo-controlled, multicentre trial. Lancet. 2013;382:1485–1495. doi: 10.1016/S0140-6736(13)61407-5. [DOI] [PubMed] [Google Scholar]
- 8.Torres VE, et al. Tolvaptan in patients with autosomal dominant polycystic kidney disease. N Engl J Med. 2012;367:2407–2418. doi: 10.1056/NEJMoa1205511. [DOI] [PMC free article] [PubMed] [Google Scholar]
- 9.Decaux G, Soupart A, Vassart G. Non-peptide arginine-vasopressin antagonists: The vaptans. Lancet. 2008;371:1624–1632. doi: 10.1016/S0140-6736(08)60695-9. [DOI] [PubMed] [Google Scholar]
- 10.Yamamura Y, et al. OPC-41061, a highly potent human vasopressin V2-receptor antagonist: Pharmacological profile and aquaretic effect by single and multiple oral dosing in rats. J Pharmacol Exp Ther. 1998;287:860–867. [PubMed] [Google Scholar]
- 11.King GF, editor. Venoms to Drugs, Drug Discovery. Royal Society of Chemistry; London: 2015. pp. P001–320. [Google Scholar]
- 12.Fruchart-Gaillard C, et al. Different interactions between MT7 toxin and the human muscarinic M1 receptor in its free and N-methylscopolamine-occupied states. Mol Pharmacol. 2008;74:1554–1563. doi: 10.1124/mol.108.050773. [DOI] [PubMed] [Google Scholar]
- 13.Rouget C, et al. Identification of a novel snake peptide toxin displaying high affinity and antagonist behaviour for the 2-adrenoceptors. Br J Pharmacol. 2010;161:1361–1374. doi: 10.1111/j.1476-5381.2010.00966.x. [DOI] [PMC free article] [PubMed] [Google Scholar]
- 14.Palea S, et al. Effects of -Da1a a peptidic (1) (A) -adrenoceptor antagonist in human isolated prostatic adenoma and anaesthetized rats. Br J Pharmacol. 2013;168:618–631. doi: 10.1111/j.1476-5381.2012.02231.x. [DOI] [PMC free article] [PubMed] [Google Scholar]
- 15.Cruz LJ, et al. Invertebrate vasopressin/oxytocin homologs. Characterization of peptides from Conus geographus and Conus straitus venoms. J Biol Chem. 1987;262:15821–15824. [PubMed] [Google Scholar]
- 16.Dutertre S, et al. Conopressin-T from Conus tulipa reveals an antagonist switch in vasopressin-like peptides. J Biol Chem. 2008;283:7100–7108. doi: 10.1074/jbc.M706477200. [DOI] [PubMed] [Google Scholar]
- 17.Skarzyński T. Crystal structure of alpha-dendrotoxin from the green mamba venom and its comparison with the structure of bovine pancreatic trypsin inhibitor. J Mol Biol. 1992;224:671–683. doi: 10.1016/0022-2836(92)90552-u. [DOI] [PubMed] [Google Scholar]
- 18.Millers EKI, et al. Crystal structure of textilinin-1, a Kunitz-type serine protease inhibitor from the venom of the Australian common brown snake (Pseudonaja textilis) FEBS J. 2009;276:3163–3175. doi: 10.1111/j.1742-4658.2009.07034.x. [DOI] [PubMed] [Google Scholar]
- 19.Hamiaux C, et al. The BPTI decamer observed in acidic pH crystal forms pre-exists as a stable species in solution. J Mol Biol. 2000;297:697–712. doi: 10.1006/jmbi.2000.3584. [DOI] [PubMed] [Google Scholar]
- 20.Macedo-Ribeiro S, et al. Isolation, cloning and structural characterization of boophilin, a multifunctional Kunitz-type proteinase inhibitor from the cattle tick. PLoS One. 2008;3:1–17. doi: 10.1371/journal.pone.0001624. [DOI] [PMC free article] [PubMed] [Google Scholar]
- 21.Gasparini S, et al. Delineation of the functional site of -dendrotoxin: The functional topographies of dendrotoxins are different but share a conserved core with those of other Kv1 potassium channel-blocking toxins. J Biol Chem. 1998;273:25393–25403. doi: 10.1074/jbc.273.39.25393. [DOI] [PubMed] [Google Scholar]
- 22.Kunitz M, Northrop JH. Isolation from beef pancreas of crystalline trypsinogen, trypsin, a trypsin inhibitor, and an inhibitor-trypsin compound. J Gen Physiol. 1936;19:991–1007. doi: 10.1085/jgp.19.6.991. [DOI] [PMC free article] [PubMed] [Google Scholar]
- 23.Otlewski J, et al. Structure-function relationship of serine protease - protein inhibitor interaction. Acta Biochim Pol. 2001;48:419–428. [PubMed] [Google Scholar]
- 24.Rawlings ND, Barrett AJ. MEROPS: The peptidase database. Nucleic Acids Res. 1999;27:325–331. doi: 10.1093/nar/27.1.325. [DOI] [PMC free article] [PubMed] [Google Scholar]
- 25.Viengchareun S, et al. Osmotic stress regulates mineralocorticoid receptor expression in a novel aldosterone-sensitive cortical collecting duct cell line. Mol Endocrinol. 2009;23:1948–1962. doi: 10.1210/me.2009-0095. [DOI] [PMC free article] [PubMed] [Google Scholar]
- 26.Nagao S, Kugita M, Yoshihara D, Yamaguchi T. Animal models for human polycystic kidney kisease. Exp Anim. 2012;61:477–488. doi: 10.1538/expanim.61.477. [DOI] [PubMed] [Google Scholar]
- 27.Chebib FT, Sussman CR, Wang X, Harris PC, Torres VE. Vasopressin and disruption of calcium signalling in polycystic kidney disease. Nat Rev Nephrol. 2015;11:451–464. doi: 10.1038/nrneph.2015.39. [DOI] [PMC free article] [PubMed] [Google Scholar]
- 28.Fry BG, et al. The toxicogenomic multiverse: Convergent recruitment of proteins into animal venoms. Annu Rev Genom Hum Genet. 2009;10:483–511. doi: 10.1146/annurev.genom.9.081307.164356. [DOI] [PubMed] [Google Scholar]
- 29.Maïga A, et al. G protein-coupled receptors, an unexploited animal toxin target: Exploration of green mamba venom for novel drug candidates active against adrenoceptors. Toxicon. 2012;59:487–496. doi: 10.1016/j.toxicon.2011.03.009. [DOI] [PubMed] [Google Scholar]
- 30.Harvey AL, et al. Effects of muscarinic toxins MT1 and MT2 from green mamba on different muscarinic cholinoceptors. Neurochem Res. 2002;27:1543–1554. doi: 10.1023/a:1021660708187. [DOI] [PubMed] [Google Scholar]
- 31.Blanchet G, et al. New -adrenergic property for synthetic MT and CM-3 three-finger fold toxins from black mamba. Toxicon. 2013;75:160–167. doi: 10.1016/j.toxicon.2013.04.017. [DOI] [PubMed] [Google Scholar]
- 32.Koivula K, Rondinelli S, Näsman J. The three-finger toxin MTalpha is a selective alpha(2B)-adrenoceptor antagonist. Toxicon. 2010;56:440–447. doi: 10.1016/j.toxicon.2010.05.001. [DOI] [PubMed] [Google Scholar]
- 33.Jerusalinsky D, Kornisiuk E, Alfaro P. Muscarinic toxins: Novel pharmacological tools for the muscarinic cholinergic system. Toxicon. 2000;38:747–761. doi: 10.1016/s0041-0101(99)00196-8. [DOI] [PubMed] [Google Scholar]
- 34.Harvey AL, Karlsson E. Dendrotoxin from the venom of the green mamba, Dendroaspis angusticeps. A neurotoxin that enhances acetylcholine release at neuromuscular junction. Naunyn Schmiedebergs Arch Pharmacol. 1980;312:1–6. doi: 10.1007/BF00502565. [DOI] [PubMed] [Google Scholar]
- 35.Schweitz H, et al. Calcicludine, a venom peptide of the Kunitz-type protease inhibitor family, is a potent blocker of high-threshold Ca2+ channels with a high affinity for L-type channels in cerebellar granule neurons. Proc Natl Acad Sci USA. 1994;91:878–882. doi: 10.1073/pnas.91.3.878. [DOI] [PMC free article] [PubMed] [Google Scholar]
- 36.Andreev YA, et al. Analgesic compound from sea anemone Heteractis crispa is the first polypeptide inhibitor of vanilloid receptor 1 (TRPV1) J Biol Chem. 2008;283:23914–23921. doi: 10.1074/jbc.M800776200. [DOI] [PMC free article] [PubMed] [Google Scholar]
- 37.Smith D, et al. Unexpected activity of a novel Kunitz-type inhibitor: Inhibition of cysteine proteases but not serine proteases. J Biol Chem. 2016;291:19220–19234. doi: 10.1074/jbc.M116.724344. [DOI] [PMC free article] [PubMed] [Google Scholar]
- 38.Harvey AL. Twenty years of dendrotoxins. Toxicon. 2001;39:15–26. doi: 10.1016/s0041-0101(00)00162-8. [DOI] [PubMed] [Google Scholar]
- 39.Peigneur S, et al. A bifunctional sea anemone peptide with Kunitz type protease and potassium channel inhibiting properties. Biochem Pharmacol. 2011;82:81–90. doi: 10.1016/j.bcp.2011.03.023. [DOI] [PubMed] [Google Scholar]
- 40.Watkins PB, et al. Clinical pattern of Tolvaptan-associated liver injury in subjects with autosomal dominant polycystic kidney disease: Analysis of clinical trials database. Drug Saf. 2015;38:1103–1113. doi: 10.1007/s40264-015-0327-3. [DOI] [PMC free article] [PubMed] [Google Scholar]
- 41.European Medicines Agency 2017 Jinarc. Available at http://www.ema.europa.eu/ema/index.jspcurl=pages/medicines/human/medicines/002788/human_med_001857.jsp&mid=WC0b01ac058001d124 Accessed June 12, 2016.
- 42.Quinton L, et al. Isolation and pharmacological characterization of AdTx1, a natural peptide displaying specific insurmountable antagonism of the -1A-adrenoceptor. Br J Pharmacol. 2010;159:316–325. doi: 10.1111/j.1476-5381.2009.00532.x. [DOI] [PMC free article] [PubMed] [Google Scholar]
- 43.Mourier G, Dutertre S, Fruchart-Gaillard C, Ménez A, Servent D. Chemical synthesis of MT1 and MT7 muscarinic toxins: Critical role of Arg-34 in their interaction with M1 muscarinic receptor. Mol Pharmacol. 2003;63:26–35. doi: 10.1124/mol.63.1.26. [DOI] [PubMed] [Google Scholar]
- 44.Liman ER, Tytgat J, Hess P. Subunit stoichiometry of a mammalian K+ channel determined by construction of multimeric cDNAs. Neuron. 1992;9:861–871. doi: 10.1016/0896-6273(92)90239-a. [DOI] [PubMed] [Google Scholar]
- 45.Suckau D, et al. A novel MALDI LIFT-TOF/TOF mass spectrometer for proteomics. Anal Bioanal Chem. 2003;376:952–965. doi: 10.1007/s00216-003-2057-0. [DOI] [PubMed] [Google Scholar]
- 46.Kabsch W. Integration, scaling, space-group assignment and post-refinement. Acta Crystallogr D Biol Crystallogr. 2010;66:133–144. doi: 10.1107/S0907444909047374. [DOI] [PMC free article] [PubMed] [Google Scholar]
- 47.McCoy AJ, et al. Phaser crystallographic software. J Appl Crystallogr. 2007;40:658–674. doi: 10.1107/S0021889807021206. [DOI] [PMC free article] [PubMed] [Google Scholar]
- 48.Emsley P, Lohkamp B, Scott WG, Cowtan K. Features and development of Coot. Acta Crystallogr D Biol Crystallogr. 2010;66:486–501. doi: 10.1107/S0907444910007493. [DOI] [PMC free article] [PubMed] [Google Scholar]
- 49.Murshudov GN, et al. REFMAC5 for the refinement of macromolecular crystal structures. Acta Crystallogr D Biol Crystallogr. 2011;67:355–367. doi: 10.1107/S0907444911001314. [DOI] [PMC free article] [PubMed] [Google Scholar]
- 50.Adams PD, et al. PHENIX: A comprehensive python-based system for macromolecular structure solution. Acta Crystallogr D Biol Crystallogr. 2010;66:213–221. doi: 10.1107/S0907444909052925. [DOI] [PMC free article] [PubMed] [Google Scholar]
- 51.Favreau P, et al. A new -conotoxin that targets N-type voltage-sensitive calcium channels with unusual specificity. Biochemistry. 2001;40:14567–14575. doi: 10.1021/bi002871r. [DOI] [PubMed] [Google Scholar]
- 52.Cheng Y, Prusoff WH. Relationship between the inhibition constant (K1) and the concentration of inhibitor which causes 50 per cent inhibition (I50) of an enzymatic reaction. Biochem Pharmacol. 1973;22:3099–3108. doi: 10.1016/0006-2952(73)90196-2. [DOI] [PubMed] [Google Scholar]
- 53.Cerni FA, et al. Electrophysiological characterization of Ts6 and Ts7, K+ channel toxins isolated through an improved Tityus serrulatus venom purification procedure. Toxins. 2014;6:892–913. doi: 10.3390/toxins6030892. [DOI] [PMC free article] [PubMed] [Google Scholar]


