Significance
Preservation and/or enhancement of Treg function is becoming a key component of modern immunotherapeutic strategies, but the direct influence of many immunosuppressive drugs on Tregs remains unknown. Calcineurin inhibitors (CNIs), which are widely used to treat inflammatory disorders, reduce the size of the Treg pool substantially, and this reduction might hinder their overall beneficial effects. Here we show that the decrease in Treg numbers is caused by increased cell death as a result of the limited availability of the IL-2 growth factor. Hence, the addition of IL-2 restores the survival and suppressive properties of Tregs exposed to CNIs and improves allograft survival. Our data provide a strong rationale for combining CNIs with IL-2 therapy to maximize effective immunosuppression and to promote tolerance acquisition.
Keywords: regulatory T cells, transplantation, IL-2 therapy, calcineurin inhibitors, NFAT translocation
Abstract
CD4+CD25+FOXP3+ Tregs constitute a heterogeneous lymphocyte subpopulation essential for curtailing effector T cells and establishing peripheral tolerance. Calcineurin inhibitors (CNIs) are among the most effective agents in controlling effector T-cell responses in humans. However, CNIs also reduce the size of the Treg pool. The functional consequences of this negative effect and the mechanisms responsible remain to be elucidated. We report here that CNIs compromise the overall Treg immunoregulatory capacity to a greater extent than would be predicted by the reduction in the size of the Treg compartment, given that they selectively promote the apoptosis of the resting and activated Treg subsets that are known to display the most powerful suppressive function. These effects are caused by reduced access to IL-2, because Tregs remain capable of translocating NFAT even in the presence of high CNI levels. Exogenous IL-2 restores the phenotypic changes and overall gene-expression effects exerted by CNIs and can even promote Treg expansion by enhancing antiapoptotic Bcl-2 expression. In a skin transplant model, the addition of IL-2 synergizes with CNIs treatment, promoting intragraft accumulation of Tregs and prolonged allograft survival. Hence, the combination of IL-2 and CNIs constitutes an optimal immunomodulatory regimen that enhances the pool of suppressive Treg subsets while effectively controlling cytopathic T cells.
CD4+CD25+FOXP3+ Tregs are essential for limiting the activity of effector T cells (Teffs) during proinflammatory responses and for maintaining self-tolerance. Treg imbalances and/or dysfunction lead to the development of immune-mediated diseases and tissue damage (1). Furthermore, Tregs are involved in the mechanisms of action of a variety of immunotherapeutic strategies used in humans to curtail pathogenic immune responses. However, the extent to which currently used anti-inflammatory and/or immunosuppressive agents influence the functional and homeostatic properties of Tregs is still incompletely understood. Calcineurin inhibitors (CNIs) such as tacrolimus or cyclosporine A constitute the mainstay immunosuppressive agents in transplantation. CNIs inhibit the T-cell receptor (TCR)-induced translocation of nuclear factor of activated T cells (NFAT) into the nucleus, thereby blocking Teff function and IL-2 transcription (2). However, the inhibition of NFAT translocation may also hampers the function of tissue-protective Tregs, given the dependence of these cells on IL-2 and their need for nuclear NFAT to express FOXP3 efficiently (3, 4). Indeed, several reports have described that transplanted patients treated with CNIs exhibit a reduced number of Tregs (5), and the use of CNIs has been shown to break tolerance in allograft models known to be dependent on Tregs (6). However, the specific mechanisms through which CNIs exert these effects and hinder the maintenance and function of Tregs remain to be elucidated.
Increasing evidence suggests that Tregs are heterogeneous in phenotype and function and that different Treg subsets display distinct homeostatic requirements that vary depending on the immunological context. Miyara et al. (7) classified human CD4+FOXP3+ Tregs in three functionally distinct subsets: (i) resting Treg cells (CD45RA+FOXP3lo) and (ii) activated Treg cells (CD45RA−FOXP3hi), both of which are suppressive in vitro, and (iii) cytokine-secreting nonsuppressive T cells (CD45RA−FOXP3lo). Although this topic is still contentious [e.g., CD45RA−FOXP3lo Tregs have been shown to be suppressive in other laboratories (8)], the classification proposed by Miyara et al. remains widely used and has provided very useful information when applied to autoimmunity and cancer (9, 10).
IL-2 is essential for the optimal development, survival, and function of Tregs. The IL-2 receptor α chain (CD25) is highly expressed in Tregs, allowing them to respond to very low concentrations of IL-2. IL-2 signaling through STAT5 is important for the expression of Treg-related genes such as Foxp3 and prosurvival genes such as Bcl-2 and Bcl-XL (11). Furthermore, several clinical studies have shown that low-dose IL-2 preferentially expands Tregs and is safe and efficacious in patients with autoimmunity or graft-versus-host disease (12–15).
In the current study we sought to delineate the effects of CNIs on the homeostasis and function of Tregs and the extent to which these effects are influenced by IL-2 availability. Our data indicate that CNIs markedly disrupt Treg homeostasis and have a negative impact on the most highly immunosuppressive Treg subsets. However, provision of exogenous IL-2 reverses these effects and synergizes with CNIs in neutralizing Teff responses and promoting allograft survival.
Results
CNI Treatment Selectively Reduces Resting and Activated Tregs by Increasing Cellular Turnover and Apoptosis.
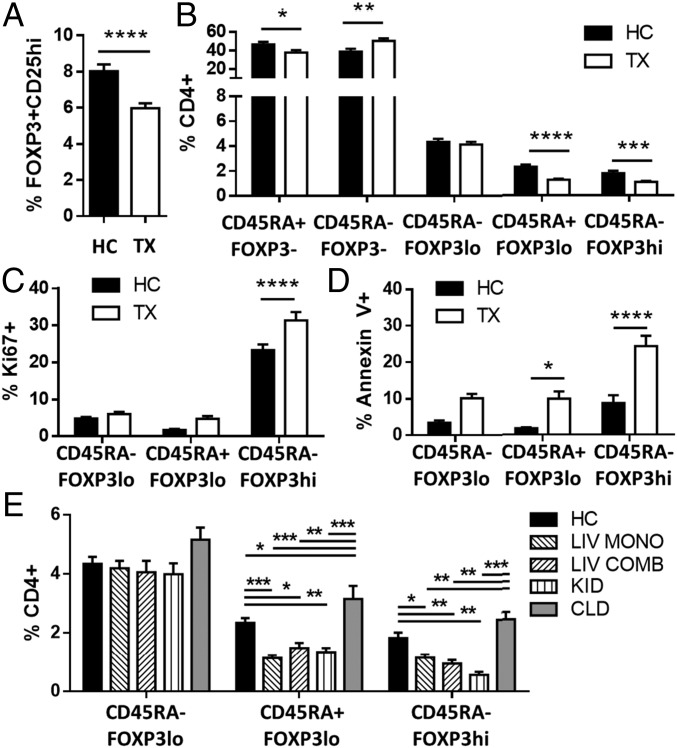
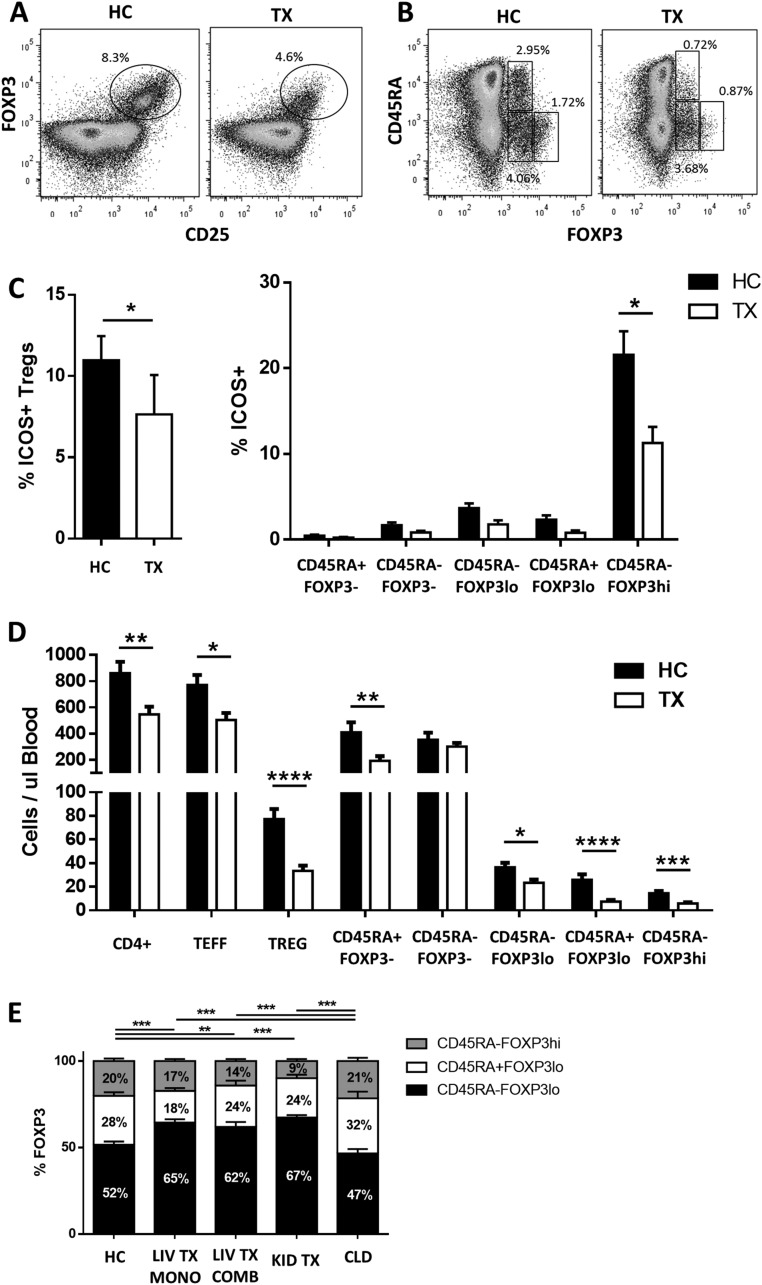
To accurately assess the impact of CNI treatment on the Treg repertoire we conducted flow cytometry experiments of blood samples collected from liver transplant recipients receiving tacrolimus. Liver transplant patients displayed a lower frequency of circulating CD4+CD25+FOXP3+ Tregs than age-matched healthy individuals (Fig. 1A and Fig. S1A). However, the reduction in Treg frequency observed in liver recipients differed across the various Treg subsets. The frequency of resting CD45RA+FOXP3lo and activated CD45RA−FOXP3hi Treg subpopulations was markedly decreased (Fig. 1B and Fig. S1B), whereas the frequency of the CD45RA−FOXP3lo subset was not influenced by tacrolimus. Furthermore, in agreement with previous reports describing the preferential expression of ICOS by CD45RA−FOXP3hi Tregs (7, 16), we observed a reduced proportion of ICOS+ Tregs in transplanted patients (Fig. S1C). Absolute lymphocyte quantification revealed an overall decrease in circulating CD4+ T cells in liver transplant patients (36%), with the most pronounced reduction in the CD45RA+FOXP3lo and CD45RA−FOXP3hi subsets (71 and 60% respectively) (Fig. S1D).
Fig. 1.
CNIs influence Treg homeostasis and subset distribution in transplanted patients. (A–D) Flow cytometry analysis of fresh blood from liver transplant patients (TX, n = 37) and healthy controls (HC, n = 23). (A and B) Quantification of FOXP3+CD25hi Tregs gated on CD4+ T cells (A) and percentages of CD4+ T cells based on FOXP3 and CD45 staining (B). (C and D) Quantification of proliferative (C) and apoptotic (D) Treg subsets based on FOXP3 and CD45RA expression patterns. (E) Flow cytometry analysis of fresh blood from healthy controls (HC, n = 23), liver transplant patients receiving tacrolimus monotherapy (LIV MONO, n = 22) or tacrolimus combined with other drugs (LIV COMB, n = 15), kidney recipients receiving tacrolimus therapy (KID, n = 24), and patients with chronic liver disease (CLD, n = 18). *P < 0.05, **P < 0.01, ***P < 0.001, and ****P < 0.0001.
Fig. S1.
Flow cytometry analysis of PBMCs from transplant recipients (TX) and healthy controls (HC). (A and B) Representative plots of Treg gating based on FOXP3+CD25hi (A) and FOXP3 plus CD45RA staining (B). (C) Percentage of ICOS+ cells among FOXP3+CD25+ Tregs (Left) and distribution of ICOS+ cells among T-cell subsets (Right) in liver transplant patients (n = 12) and healthy controls (n = 8). (D) Total quantification of the CD4+ T-cell subpopulation per microliter of blood in liver transplant patients (n = 15) and healthy controls (n = 10). (E) Relative distribution of the three subsets of FOXP3+ cells in healthy controls (n = 23) and in liver transplant patients receiving tacrolimus monotherapy (LIV TX MONO, n = 22) or tacrolimus combined with other drugs (LIV TX COMB, n = 15), kidney recipients receiving tacrolimus therapy (KID TX, n = 24), and patients with chronic liver disease (CLD, n = 18). *P < 0.05, **P < 0.01, ***P < 0.001, and ****P < 0.0001.
The effects of CNIs on Treg homeostasis were explored by quantifying cell proliferation and apoptosis using the cell-cycle–related protein Ki67 and Annexin V, respectively (Fig. 1 C and D). Activated Treg subsets exhibited higher proliferation in transplant recipients than in healthy controls. The increased Treg proliferation observed in transplant recipients was paralleled by a higher proportion of resting and activated Tregs undergoing apoptosis.
To evaluate whether the influence of CNIs was independent of demographic and clinical parameters, we analyzed a cohort of kidney transplant recipients receiving CNIs and a cohort of nontransplanted chronic liver disease patients receiving no immunosuppressants (Table S1). In comparison with healthy controls, the number of resting and activated Tregs in kidney recipients was reduced to levels similar to those observed in CNI-treated liver recipients. In contrast, no changes in Treg subsets were observed in nontransplanted liver patients (Fig. 1E and Fig. S1E). When all study transplant recipients were analyzed together, age, but not recipient gender or time since transplantation, was noted to influence Treg subset distribution (CD45RA−FOXP3lo cells increased, whereas CD45RA+FOXP3hi cells decreased with age; P = 0.004 and P = 0.027, respectively). Moreover, no differences in Treg subsets were noted between transplant recipients receiving CNI monotherapy and those taking CNI in combination with other immunosuppressants.
Table S1.
Baseline clinical and demographic characteristics of patients and healthy controls
| Characteristic | Liver transplant recipients (n = 37) | Renal transplant recipients (n = 24) | Chronic liver disease patients (n = 18) | Healthy controls (n = 23) | P value |
| Age, y | 52 ± 14 | 54 ± 15 | 55 ± 14 | 46 ± 14 | Ns |
| Age at transplantation, y | 45 ± 15 | 46 ± 15 | — | — | Ns |
| Gender, % male | 51 | 67 | 67 | 48 | Ns |
| Primary indication for liver transplantation, no. of patients | |||||
| Acute liver failure | 1 | — | — | — | |
| Alcohol related cirrhosis | 16 | — | 5 | — | |
| Subacute liver failure | 1 | — | — | — | |
| Biliary atresia | 2 | — | — | — | |
| Primary sclerosing cholangitis | 3 | — | 2 | — | |
| Primary biliary cirrhosis | 2 | — | 4 | — | |
| Haemochromatosis | 1 | — | — | — | |
| Mdr3 mutation | 1 | — | — | — | |
| Hepatoportal sclerosis | 1 | — | — | — | |
| Congenital hepatic fibrosis | 1 | — | — | — | |
| Cryptogenic cirrhosis | 4 | — | 3 | — | |
| Hepatocellular carcinoma | 3 | — | — | — | |
| Noncirrhotic portal hypertension | 1 | — | — | — | |
| Nonalcoholic fatty liver disease | — | — | 3 | — | |
| Budd–Chiari syndrome | — | — | 1 | — | |
| Primary indication for renal transplantation, no. of patients | |||||
| Hypertensive nephropathy | 7 | — | |||
| Diabetic nephropathy | 2 | — | |||
| Renovascular disease | 1 | — | |||
| IGA Nephropathy | 3 | — | |||
| Minimal change glomerulonephritis | 1 | — | |||
| Reflux nephropathy | 1 | — | |||
| Hydronephrosis | 1 | — | |||
| Polycystic kidney disease | 3 | — | |||
| Cryptogenic | 5 | — | |||
| Time from transplantation, mo | 71 ± 53 | 92 ± 80 | — | — | Ns |
| Immunosuppressive therapy | |||||
| Tacrolimus | 30 | — | — | — | |
| Tacrolimus + mycophenolate | 5 | 5 | — | — | |
| Tacrolimus + prednisolone | 11 | 2 | — | — | |
| Tacrolimus + azathioprine | 2 | 1 | — | — | |
| Tacrolimus + sirolimus | — | 1 | — | — | |
| Tacrolimus + mycophenolate + prednisolone | — | 14 | — | — | |
| Cyclosporine + azathioprine | — | 1 | — | — | |
| Tacrolimus trough levels, ng/mL | 5.8 ± 2 | 6.4 ± 3 | — | — | Ns |
Ns, not significant.
CNI Treatment Modifies IL-2 and IL-7 Signaling in Tregs.
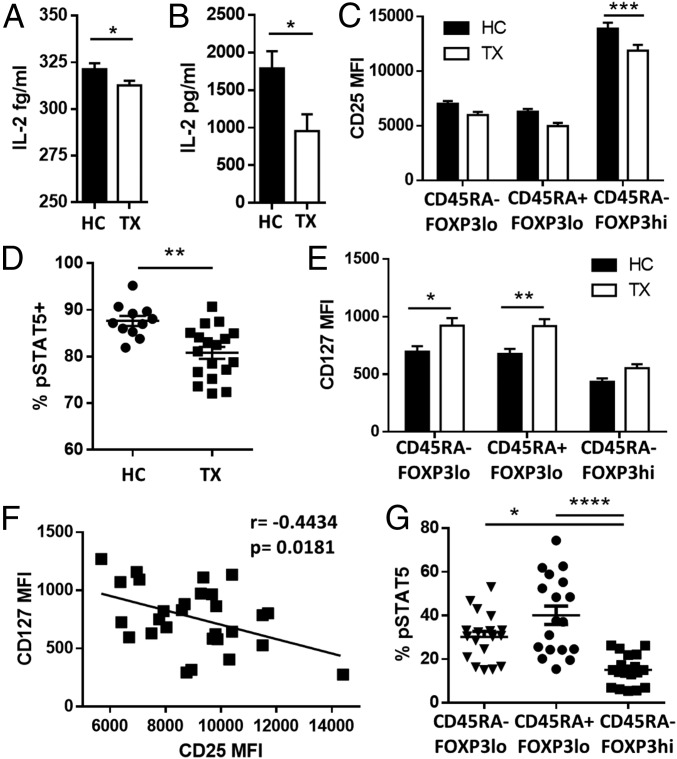
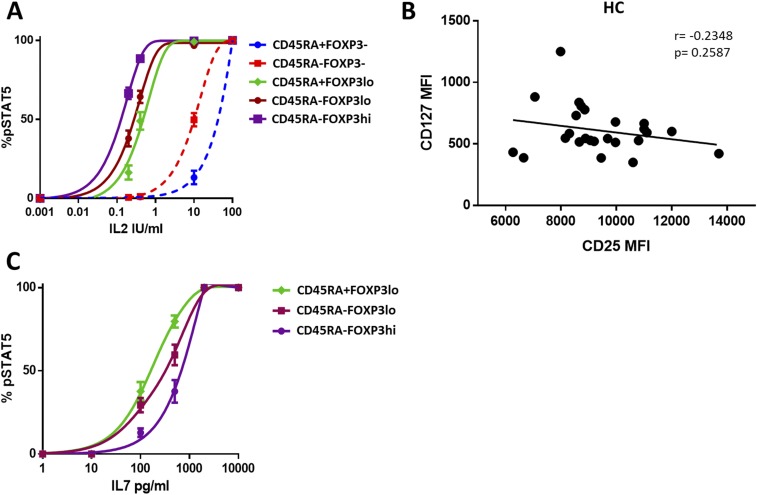
Because IL-2 is essential to maintain Treg homeostasis, we investigated the availability and signaling efficiency of IL-2 in liver transplant patients. Transplant recipients showed a mild but significant reduction of circulating IL-2 (Fig. 2A) that became more apparent upon cell activation (Fig. 2B). In addition the expression of CD25 on the CD45RA−FOXP3hi-activated Treg subpopulation was significantly reduced in transplant recipients as compared with healthy controls (Fig. 2C), and this decrease was associated with decreased sensitivity to IL-2 as assessed by the phosphorylation of STAT5 (Fig. 2D, Fig. S2A, and Table S2). On the other hand, transplant patients exhibited higher CD127 expression in CD45RA+Foxp3lo Tregs and CD45RA−Foxp3lo T cells (Fig. 2E). This overexpression was inversely correlated with the expression of CD25 in liver recipients but not in healthy individuals (Fig. 2F and Fig. S2B). CD127 expression among FOXP3+ T-cell subsets was associated with differences in their capacity to respond to low concentrations of IL-7; this response was significantly lower in the activated CD45RA−FOXP3hi Treg subset (Fig. 2G and Fig. S2C).
Fig. 2.
Effects of CNIs on IL-2 and IL-7 signaling. (A) IL-2 serum concentration in fresh blood from healthy controls (HC, n = 20) and liver transplant recipients (TX, n = 20). (B) IL-2 production after 5-h whole-blood incubation with phytohaemagglutinin at 37 °C (HC, n = 10; TX, n = 10). (C) Quantification of CD25 expression on Treg subsets in liver recipients (TX, n = 37) and healthy controls (HC, n = 23). (D) STAT5 phosphorylation (pSTAT5) analysis of activated Tregs (CD4+CD45RA−FOXP3hi) in liver transplant recipients (TX, n = 18) and healthy controls (HC, n = 12) after in vitro culture for 30 min with IL-2 (0.2 IU/mL). (E) Correlation between CD127 and CD25 expression in liver transplant patients. (F) Quantification of CD127 expression on Treg subsets in liver transplant recipients and healthy controls. (G) STAT5 phosphorylation analysis of Treg subsets in liver transplant recipients (n = 18) after culture of peripheral blood mononuclear cells (PBMCs) for 30 min with 100 pg/mL of IL-7. *P < 0.05, **P < 0.01, ***P < 0.001, and ****P < 0.0001. MFI, mean fluorescence intensity.
Fig. S2.
Effects of CNIs in IL-2 and IL-7 signaling. (A) STAT5 phosphorylation analysis of CD4+ T-cell subsets of liver transplant patients (n = 18) after culture of PBMCs for 30 min in various concentrations of IL-2. (B) Correlation between CD127 and CD25 expression in healthy controls (HC, n = 25). (C) STAT5 phosphorylation analysis of Treg subsets in liver transplant patients (n = 18) after culture of PBMCs for 30 min in increasing concentrations of IL-7.
Table S2.
Flow cytometry antibody list
| Manufacturer | Antibody | Fluorochrome | Clone |
| Human phenotypic studies | |||
| BD Biosciences | Anti-CD25 | APC | M-A251 |
| BD Biosciences | Anti-CD25 | APC | 2A3 |
| BioLegend | Anti-CD4 | Alexa Fluor 700 | RPA-T4 |
| eBioscience | Anti-CD127 | FITC | eBioRDR5 |
| BD Biosciences | Anti-CD45RA | PE Cy7 | L48 |
| BioLegend | Anti-FoxP3 | PE | 259D |
| Becton Dickinson | Anti-BCL-2 | FITC | Bcl-2/100 |
| BioLegend | Anti-Ki-67 | Alexa Fluor 488 | Ki-67 |
| BioLegend | Anti-ICOS | FITC | C398.4A |
| BioLegend | Annexin V | FITC | |
| Human pSTAT5 experiments | |||
| BD Biosciences | Anti-CD25 | PE | M-A251 |
| BD Biosciences | Anti-CD25 | PE | 2A3 |
| BD Biosciences | Anti-CD4 | FITC | SK3 |
| BD Biosciences | Anti-STAT5a | Alexa Fluor 647 | pY694 |
| BD Biosciences | Anti-CD45RA | eFluor 450 | SK3 |
| eBioscience | Anti-CD127 | PerCP-Cy5.5 | eBioRDR5 |
| BioLegend | Anti-CD4 | Alexa Fluor 700 | RPA-T4 |
| BioLegend | Anti-CD45RA | Pacific Blue | H100 |
| BioLegend | Anti-FOXP3 | PE | 259D |
| BD Biosciences | Anti-STAT5a | Alexa Fluor 488 | pY694 |
| Mouse phenotypic studies | |||
| BioLegend | Anti-CD25 | PerCP-Cy5.5 | PC61 |
| BioLegend | Anti-CD4 | PE Cy7 | GK1.5 |
| BioLegend | Anti-FoxP3 | PE | 150D |
| BioLegend | Anti-Ki-67 | APC | 16A8 |
| BioLegend | Annexin V | FITC | |
| BioLegend | Anti-CD8 | PerCP | 53–6.7 |
| BioLegend | Anti-CD3 | APC Cy7 | 145–2C11 |
| BioLegend | Anti-CTLA4 | APC | UC10-4B9 |
| BioLegend | Anti-ICOS | APC | C398.4A |
| Mouse NFAT studies | |||
| BioLegend | Anti-CD25 | PerCP-Cy5.5 | PC61 |
| BioLegend | Anti-CD4 | PE Cy7 | GK1.5 |
| BioLegend | Anti-FoxP3 | PE | 150D |
| Cell Signaling | Anti-NFAT1 | — | D43B1 |
| Thermo Fisher | Anti-Rabbit IgG | A488 | Polyclonal |
APC, Allophycocyanin; PE, phycoerythrin.
IL-2 Enhances the Survival of CD45RA−Foxp3high Tregs.
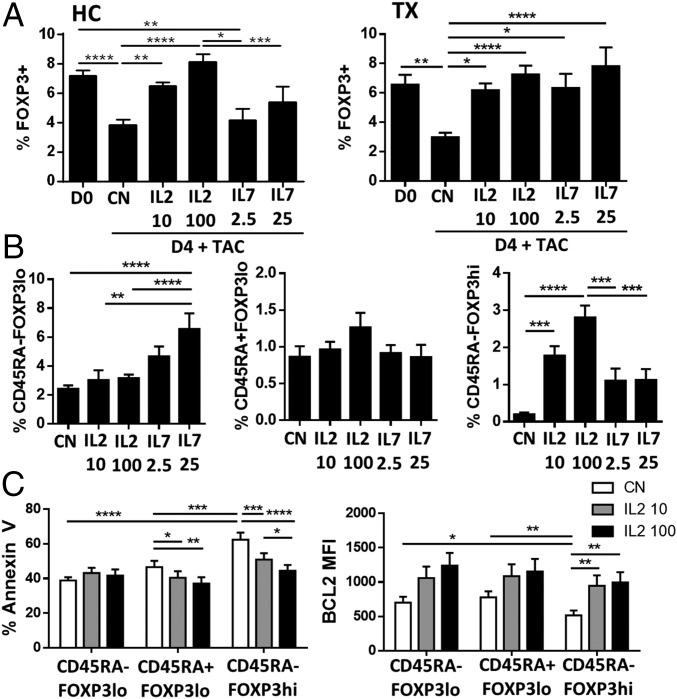
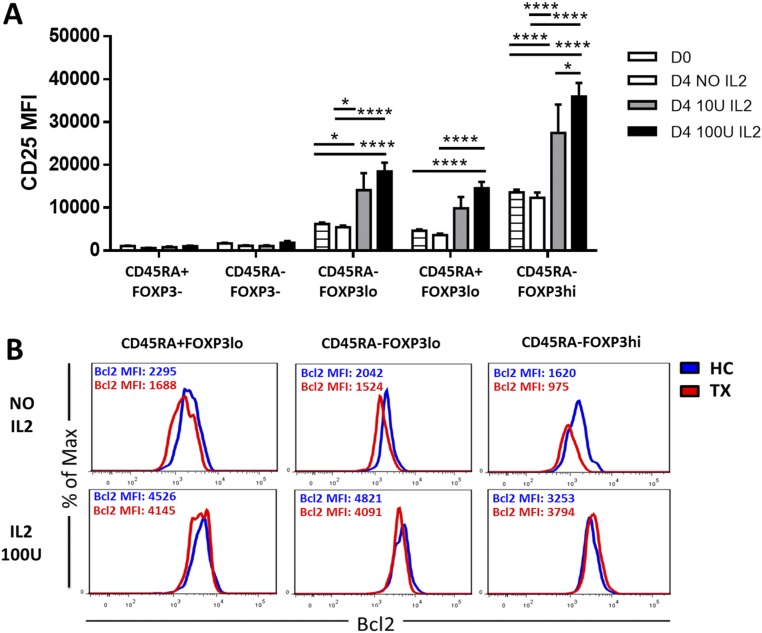
To determine if the homeostatic impairment of Tregs observed in CNI-treated patients was the result of differential responsiveness to IL-2 and IL-7, whole-blood specimens were cultured in vitro in the presence of clinically relevant concentrations of tacrolimus and either exogenous recombinant IL-2 (rIL-2) or IL-7 (rIL-7). FOXP3+ Treg subsets were reduced in frequency after 4 d of culture in samples collected from healthy individuals and transplanted patients (Fig. 3A). The addition of low doses of rIL-2 reversed the global FOXP3+ cell reduction in both groups and enhanced the expression of CD25 in Tregs but not in Teffs (Fig. S3A). In contrast, rIL-7 significantly increased the number of FOXP3+ T cells only in transplant recipients. The improvement on FOXP3+ T cells observed in transplanted patients in response to IL-7 was caused by the increased survival of CD45RA−FOXP3lo T cells. In contrast, IL-2 preferentially influenced the CD45RA−FOXP3hi Treg subset (Fig. 3B). The enhanced viability of activated Tregs after low-dose IL-2 treatment in the presence of tacrolimus correlated with decreased apoptosis and increased protein levels of the antiapoptotic gene Bcl-2 (Fig. 3C and Fig. S3B).
Fig. 3.
IL-2 effectively promotes suppressive Treg survival in the presence of CNIs. Whole blood was cultured for 4 d in the presence of physiological concentrations of tacrolimus (TAC) (5–25 ng/mL) with or without daily addition of IL-2 (10 and 100 IU/mL) or IL-7 (2.5 and 25 pg/mL). (A) Quantification of CD4+FOXP3+ T cells before (D0) and after 4-d culture of whole blood from healthy controls (HC) and from liver transplant patients (TX) treated with IL-2 (n = 6) or IL-7 (n = 10) or without IL-2 or IL-7 treatment (CN). (B) Quantification of Treg subsets based on CD45RA and FOXP3 expression in liver transplant patients after 4 d of culture in the indicated conditions. (C) Flow cytometry analysis of Annexin V and BCL2 in Treg subsets of liver transplant recipients after 4 d of culture. *P < 0.05, **P < 0.01, ***P < 0.001, and ****P < 0.0001.
Fig. S3.
IL-2, but not IL-7, effectively promotes suppressive Treg survival in the presence of CNIs. (A) Analysis of CD25 expression in CD4+ T-cell subsets from liver transplant patients (n = 10) before (D0) or after 4 d (D4) of culture with 0, 10, or 100 IU/mL of IL-2. (B) Representative experiment showing BCL2 expression in one liver transplant patient (TX) and one healthy control (HC) after 4 d of culture with or without IL-2. *P < 0.05, ****P < 0.0001. MFI, mean fluorescence intensity.
IL-2 Restores the CNIs-Induced Homeostatic Dysfunction of Tregs in Vivo.
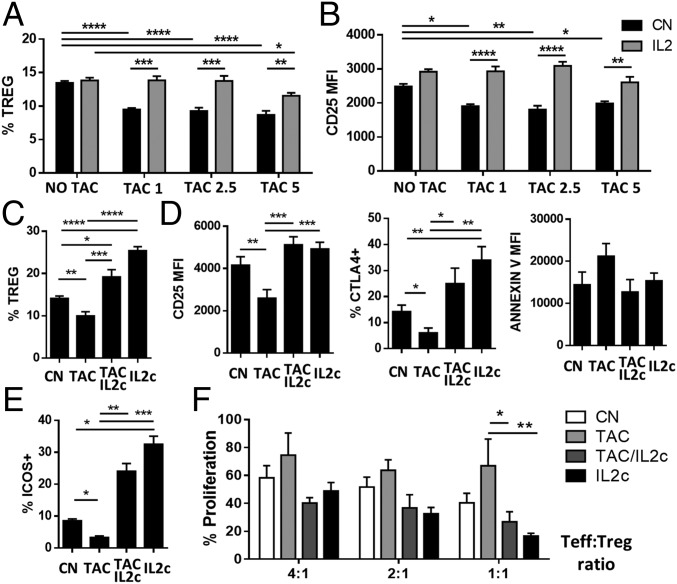
To elucidate the capacity of IL-2 to reverse the detrimental effects induced by CNIs, we assessed the changes in Treg homeostasis in mice treated with a 7-d course of tacrolimus with or without exogenous IL-2 administration. In agreement with our human data, Treg numbers in peripheral tissues decreased following tacrolimus administration, and this reduction was associated with a reduction in the expression of CD25 (Fig. 4 A and B). Administration of low-dose rIL-2 (20,000 IU/d) to animals treated with tacrolimus restored Treg numbers and CD25 expression to normal levels.
Fig. 4.
IL-2 restores CNI-induced Treg dysfunction in vivo. (A and B) B6 mice were treated for 7 d with different concentrations of tacrolimus (5, 2.5, and 1 mg⋅kg−1⋅d−1) in the presence or absence of low-dose rIL-2 (20,000 IU/d). Quantification (A) and CD25 expression (B) of CD4+FOXP3+ splenocytes from untreated mice (NO TAC) and mice treated with various concentrations of tacrolimus (n > 8). (C–F) B6 mice were treated for 7 d with tacrolimus with or without IL-2 immunocomplexes. CN, mice treated with PBS (control); IL2c, mice treated with IL-2c alone; TAC/IL2c, mice treated with tacrolimus plus IL-2c; TAC, mice treated with tacrolimus alone. (C–E) Flow cytometry analysis of spleen cells harvested from treated mice (n > 10 per group). Quantification of CD4+FOXP3+ Tregs (C) and analysis of CD25, CTLA4, and Annexin V (D) and ICOS (E) expression in Tregs. (F) Proliferation analysis of activated CD4+CD25− effector T cells from untreated mice cultured at different cell-to-cell ratios with CD4+CD25+ Tregs from treated mice (n > 6 per group from three independent experiments). *P < 0.05, **P < 0.01, ***P < 0.001, and ****P < 0.0001.
In humans, low doses of rIL-2 (0.5–3 million IU⋅m−2⋅d−1) increase the proportion and absolute number of circulating Tregs two- to eightfold (17, 18), but in mice this increase is observed only following administration of rIL-2/anti–IL-2 antibody complexes (IL-2c) (19). To better model the human setting, we treated mice with a 7-d course of tacrolimus (5 mg/kg) in combination with IL-2c (on days 2, 3, and 4). The changes in Treg CD25, CTLA4, and Annexin-V expression following IL-2c treatment were similar to those observed after rIL-2 (Fig. 4 C and D). In contrast to rIL-2, however, IL-2c significantly increased Treg numbers regardless of whether mice had been exposed to tacrolimus. In agreement with our human data, CNIs decreased the expression of ICOS, a receptor reported to be important for Treg homeostasis and function (20, 21) in Tregs (Fig. 4E). This reduction was restored by IL-2 treatment, confirming the dependence of ICOS expression on IL-2 (22). Next, we assessed the suppressive function of the Tregs by culturing them with CD4+CD25− Teffs from untreated mice activated with anti-CD3/CD28 beads. Tregs collected from tacrolimus-treated mice were less efficient in suppressing effector T-cell proliferation (Fig. 4F). However, the addition of IL-2c to tacrolimus therapy rescued the Treg phenotype and normalized the Treg suppressive properties.
Compared with Teffs, Tregs Exhibit Increased Nuclear NFAT Localization Under Tacrolimus Treatment.
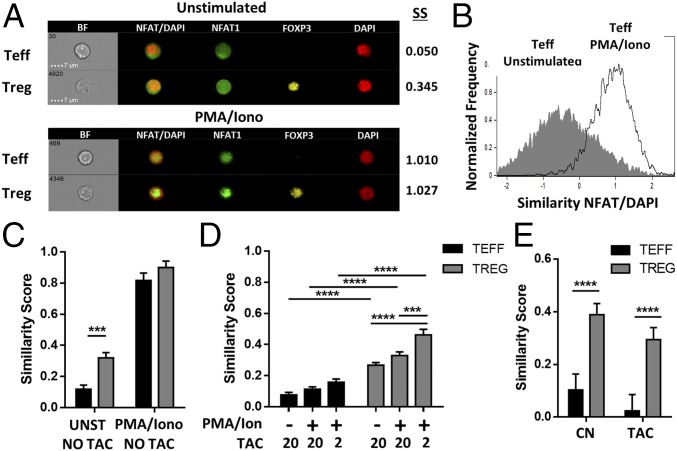
CNIs can intrinsically influence Treg homeostasis by hindering the nuclear translocation of NFAT. Thus, we investigated the direct effect of CNIs in the distribution of NFAT1 in Tregs and Teffs. Cellular NFAT1 localization was determined with image cytometry-based measurements by assessing the signal overlap between NFAT1 and the DAPI nuclear marker, expressed as the similarity score. Mouse CD4+ T cells were cultured in the absence or presence of phorbol12-myristate13-acetate (PMA)/ionomycin for 30 min to evaluate NFAT1 localization in steady state and after stimulation (Fig. 5 A and B). Although the concentration of NFAT1 in the nucleus of Tregs and Teffs was similar with PMA/ionomycin treatment, Tregs constitutively exhibited higher NFAT1 nuclear translocation in resting conditions (Fig. 5C). To determine the differential effect of CNIs, we precultured the CD4+ T cells with various concentrations of tacrolimus (20 and 2 ng/mL) before stimulation. Similarly, nuclear NFAT1 was significantly increased in Tregs as compared with Teffs (Fig. 5 C and D). Next, we further investigated whether these differences in NFAT1 localization remained following prolonged CNI exposure in vivo. Freshly isolated T cells were analyzed from mice after a 7-d course of tacrolimus (5 mg⋅kg−1⋅d−1). Tregs displayed a significantly higher nuclear translocation of NFAT1 than Teffs, independently of tacrolimus treatment (Fig. 5E). Thus, Tregs exhibit an increased resistance to the intrinsic effects of CNIs with constitutive localization of NFAT into the nucleus.
Fig. 5.
Under tacrolimus treatment Tregs exhibit greater nuclear NFAT localization than Teffs. Image flow cytometry (ImageStream; EMD Millipore) was performed to assess NFAT translocation in Tregs and Teffs. (A–D) Murine CD4+ T cells were cultured with or without PMA/ionomycin in the presence of different concentrations of tacrolimus. (A) Representative images of unstimulated and stimulated subpopulations with their corresponding similarity scores (SS). (B) Nuclear localization of NFAT1 based on similarity score distribution of unstimulated and stimulated Teffs. (C and D) Similarity scores for NFAT1/DAPI of Teffs and Tregs without (UNST) or after stimulation with PMA/ionomycin (PMA/Iono in C, PMA/Ion in D) in the absence (C) or presence (D) of pretreatment with 20 or 2 ng/mL of tacrolimus (n > 6 per group from three independent experiments). (E) Similarity score for NFAT1/DAPI of fresh isolated splenic Teffs and Tregs from untreated mice (CN) or mice treated with 5 mg/kg of tacrolimus (TAC) for 7 d (n = 6 from three independent experiments). ***P < 0.001, and ****P < 0.0001.
Tacrolimus Drastically Modifies the Treg-Specific Transcriptional Program in Vivo in an IL-2–Dependent Manner.
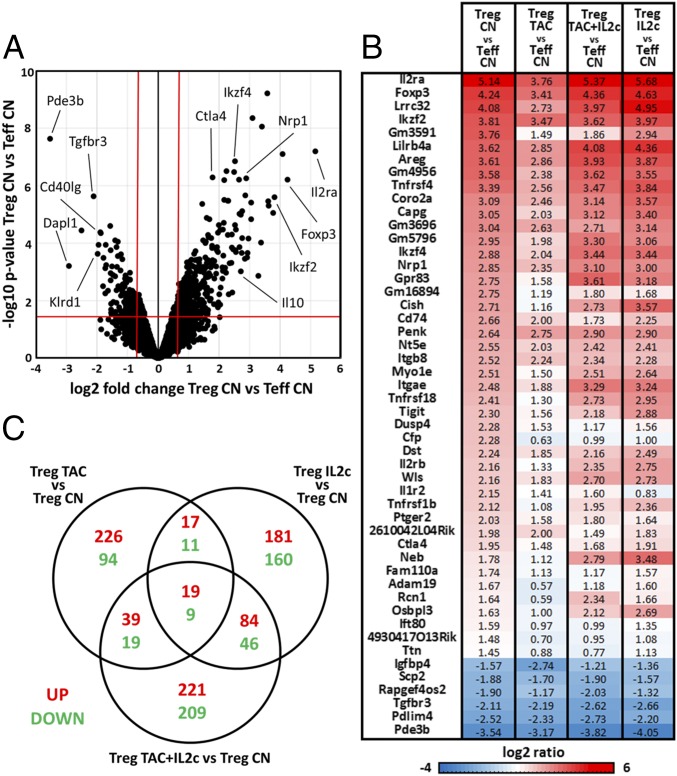
To evaluate further the transcriptional effects of CNIs on Tregs, we performed whole-genome microarray analysis of Tregs and Teffs sorted from FOXP3-YFP reporter mice. The Treg-related gene signature was defined as the differential expression between Tregs and Teffs from untreated control mice (860 genes, P <0.05 and fold change >1.5) (Fig. 6A). We selected the 50 genes with the highest differential expression and explored their transcriptional changes in Tregs sorted from mice treated with tacrolimus and/or IL-2c (Fig. 6B and Fig. S4A). Tacrolimus diminished the expression of genes known to be critical for effective Treg function, such as Foxp3, Il2ra, Tigit, Nrp1, and Areg. In contrast, only minimal transcriptional differences were observed in the 50-gene set when Tregs from control mice were compared with those treated with tacrolimus plus IL-2c or with IL-2c alone. Examination of all differentially expressed genes between control Tregs and those exposed to tacrolimus and/or IL-2c revealed, however, that each treatment combination resulted in a distinct transcriptional profile (Fig. 6C).
Fig. 6.
Transcriptional profiling of in vivo tacrolimus and IL-2 treatment. FOXP3.YFP B6 mice were treated daily with tacrolimus (5 mg/kg) with or without IL-2 complexes at days 2, 3, and 4 after tacrolimus initiation. After 7 d, microarray gene-expression analysis of FACS-sorted CD4+YFP+ Tregs and CD4+YFP− Teffs from mice treated only with tacrolimus (TAC), only with IL-2c, with the combination of tacrolimus and IL-2 (TAC/IL2c), or with PBS (CN) was performed (n = 3 per group or higher). (A) Transcriptional differences between Tregs and Teffs from untreated mice (CN) are presented as a volcano plot. Red lines delimitate the differently expressed genes based on fold change >1.5 and P < 0.05. (B) List of the top 50 genes differently expressed between Tregs and Teffs. Fold change transcriptional differences between control Tregs (Treg CN) and control Teffs (Teff CN), between Tregs treated with tacrolimus (Treg TAC) and control Teffs, between Tregs treated with tacrolimus and lL-2c (Treg TAC+IL2c) and control Teffs, and between Tregs treated with IL-2c and control Teffs are shown in the heat map. (C) Venn diagram showing the global differentially expressed genes up- and down-regulated in control Tregs (CN) and Tregs treated with tacrolimus (TAC), IL-2c, or tacrolimus plus IL-2c (P < 0.05, fold change > 1.5).
Fig. S4.
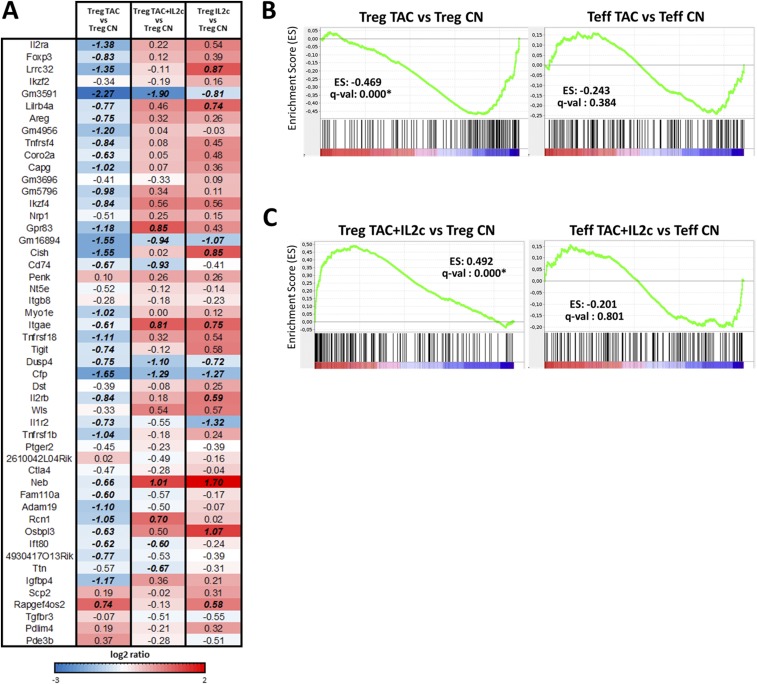
Transcriptional profiling of in vivo tacrolimus and IL-2 treatment. (A) Heat map of the transcriptional comparison of the top 50 Treg-related signatures between control Tregs (Treg CN) and Tregs isolated from mice treated with tacrolimus alone (Treg TAC), tacrolimus plus IL-2c (TAC/IL2c), or IL-2c alone (IL2c). Italic bold numbers represent a fold change >1.5. (B and C) Graphic visualization of the enrichment score (ES) in the IL-2/STAT5 transcription regulation gene set between untreated Tregs and Tregs treated with tacrolimus (Left) and untreated Teffs and Teffs treated with tacrolimus (Right) (B) and between untreated Tregs and Tregs treated with tacrolimus plus IL-2c (Left) and untreated Teffs and Teffs treated with tacrolimus plus IL-2c (Right) (C). The complete list of genes (18,359 transcripts) is ranked according to the fold change differences in expression between the two analyzed cell types (red and blue scale). The genes present in the gene sets are mapped in the ranked list (black bars). The enrichment score represents the degree to which a set of genes is overrepresented in one of the two cell types being compared (green line). The asterisk indicates an FDR q-val <25%.
Gene Set Enrichment Analysis (GSEA) was used to confirm the differential effects of CNIs on Tregs and Teffs by evaluating the influence of tacrolimus on STAT5 transcriptional target genes. Among the 18,026 gene sets in the Molecular Signatures Database (MSigDB), we identified the Hallmark–IL-2–Stat5 signaling pathway (GSEA M5947; 200 genes) as the group of genes that best described the STAT5 pathway. The IL-2/Stat5 pathway was significantly overrepresented in the genes differentially expressed between control and tacrolimus-treated Tregs (q-value: 0.000) but not between control and tacrolimus-treated Teffs (q-value: 0.384) (Fig. S4B). Of note, the addition of IL-2c to tacrolimus completely reversed these effects in Tregs but not in Teffs (Fig. S4C). Thus, tacrolimus has a major impact on the Treg transcriptional profile that can be partially attributed to the lack of adequate IL-2 availability in vivo.
IL-2 Therapy Synergizes with CNIs in Promoting Skin Allograft Survival.
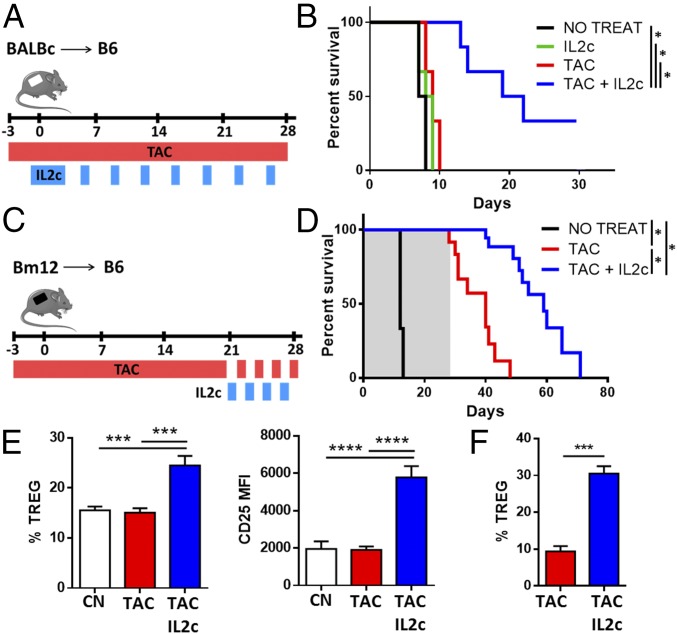
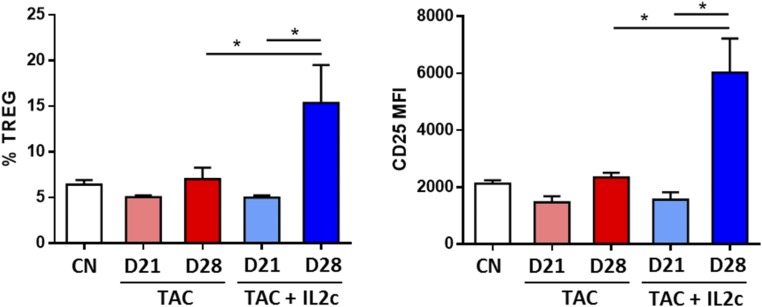
In an attempt to explore the clinical implications of our findings, and in particular whether administration of IL-2 together with a CNI optimizes the graft-protective properties of CNIs, B6 mice receiving a BALB/c skin transplant were treated with tacrolimus alone (daily from day −3 for up to 4 wk), IL-2c alone (four doses of IL-2c from day −1 to day 2 followed by two additional doses per week for up to 4 wk), or tacrolimus and IL-2c in combination (Fig. 7A). Neither tacrolimus nor IL-2c alone could prolong graft survival compared with untreated controls. In contrast, combined tacrolimus plus IL-2c significantly increased graft survival (Fig. 7B). To assess the capacity of IL-2 therapy to restore the Treg dysfunction observed in mice on prolonged CNI treatment, we conducted additional experiments in a MHC class-II mismatched skin transplant model in which the graft is protected by tacrolimus administration but rejection occurs rapidly once tacrolimus is discontinued (Fig. 7C). In this model, in the absence of tacrolimus skin allografts were rejected within 14 d of transplantation (Fig. 7D). In mice treated with tacrolimus the grafts survived during the 28 d of treatment but were rejected 12 d after drug discontinuation. In contrast, administration of four doses of IL-2c during the last week of tacrolimus treatment resulted in a significant prolongation of the skin allograft survival, with a mean rejection time of 31 d following tacrolimus discontinuation. Administration of IL-2c increased the frequency of Tregs and their surface expression of CD25 in peripheral blood (Fig. S5), in draining lymph nodes (Fig. 7F), and in the allograft itself (Fig. 7G). Together, these findings indicate that in vivo IL-2 therapy efficiently restores the numbers and function of Tregs in the presence of prolonged CNIs treatment.
Fig. 7.
IL-2 synergizes with CNIs to improve skin graft survival. B6 mice receiving skin grafts from BALB/c and Bm12 mice were treated with tacrolimus or IL-2c alone or in combination as described in SI Materials and Methods. (A) Schema of the allogeneic BALB/c skin graft treatment. (B) Comparison of graft survival in untreated mice (NO TREAT, n = 6) and mice treated with IL-2c (IL2c, n = 6), tacrolimus (TAC, n = 6), or tacrolimus plus IL-2c (TAC+IL2c, n = 6). Cumulative data of three independent experiments are shown. (C) Schema of the allogeneic Bm12 skin graft treatment. (D) Comparison of graft survival in untreated mice (NO TREAT, n = 3) and mice treated with tacrolimus (TAC, n = 10) or with tacrolimus plus IL-2 (TAC+IL2c, n = 10). Cumulative data of four independent experiments are shown (gray shade indicates tacrolimus treatment). (E and F) Flow cytometry analysis of CD4+FOXP3+ Tregs and CD25 expression in graft draining lymph nodes (E) and skin allografts (F) from nontransplanted (CN) and transplanted mice treated with tacrolimus (TAC) and treated or not treated with IL-2c 28 d after transplantation (n = 9 per group). *P < 0.05, ***P < 0.001, and ****P < 0.0001.
Fig. S5.
IL-2 synergizes with CNIs to improve skin graft survival. Flow cytometry analysis of CD4+FOXP3+ Treg quantification and CD25 expression from peripheral blood of control nontransplanted (CN) and transplanted mice treated with tacrolimus (TAC) or with tacrolimus plus IL-2c (TAC/IL2c) before (day 21) and after (day 28) IL-2c treatment (n = 6 per group). *P < 0.05. MFI, mean fluorescence intensity.
Discussion
Given the growing interest in manipulating Treg numbers for immunomodulatory purposes, there is an increasing need to understand the mechanisms controlling Treg homeostasis and whether/how this regulation is influenced by currently available immunosuppressive agents. Because CNIs are known to decrease the number of circulating Tregs in transplanted patients, they are often excluded from immunotherapeutic regimens designed to promote immune regulation. However, the direct influence of CNIs on Tregs is by no means well established, given that calcium influx following TCR ligation is impaired in Tregs, and FOXP3 has been shown to repress NFAT2 transcriptionally, suggesting that Tregs may be less dependent on NFAT activity than Teffs (23, 24). CNIs can also influence Tregs extrinsically by reducing the availability of IL-2 produced by Teffs. IL-2 signaling through STAT5 enhances the transcription of Foxp3 and Bcl-2 family genes, which are essential for the functional competence, stability and survival of Tregs (25).
The constitutive expression of CD25 by Tregs increases their affinity to IL-2 by 10- to 100-fold compared with Teffs (11). Several studies in autoimmune patients have reported that even modest changes in CD25 expression modify IL-2 sensitivity and greatly influence Treg function (26, 27). In the present study we observed diminished CD25 expression, reduced sensitivity to low concentrations of IL-2, and increased cell apoptosis in Tregs from transplant recipients receiving tacrolimus therapy. These effects occurred in a hierarchical manner, with CD45RA−FOXP3hi-activated Tregs being the most affected, as is consistent with their greater dependency on IL-2 survival signals, followed by the CD45RA+FOXP3lo resting Treg subset. In contrast, CD45RA−FOXP3lo CD4+ T cells were preserved because of their capacity to up-regulate CD127 and respond to IL-7. These data suggest that the insufficient basal production of IL-2 by Teffs is the direct cause of the dysfunctional Treg homeostasis observed in transplant recipients treated with CNIs.
Two additional lines of evidence support this interpretation. First, microarray analysis conducted on Tregs sorted from mice treated with tacrolimus demonstrated that a significant impairment in the expression of IL-2/STAT5 signaling and Treg-specific genes was reversed following administration of exogenous IL-2. Second, analysis of NFAT translocation demonstrated that, compared with Teffs, Tregs displayed an increased nuclear localization of NFAT in the presence of tacrolimus. These data differ from two previous publications reporting reduced effects of CNIs on Tregs (28, 29). Vaeth et al. (29) failed to detect NFAT in the nucleus of Tregs and concluded that their function was not dependent on NFAT. Li et al. (28) reported that in Tregs a fraction of NFAT translocation was independent of calcineurin and constitutively localized into the nucleus. Our results obtained using image flow cytometry, which recapitulates the diversity of a cell population much better than the Western blot and confocal microscopy approaches used in the previous publications, indicate that tacrolimus is capable of restricting NFAT translocation in Tregs, but the overall effect is much lower than that observed in Teffs. These observations clarify why CNI-induced NFAT pathway disruption is unlikely to be the primary cause for the Treg homeostatic abnormalities observed in transplanted patients and provide a mechanistic explanation for the capacity of IL-2 to reverse partially the effects induced by tacrolimus.
The immunotherapeutic relevance of these results is illustrated by the observation that the administration of tacrolimus in combination with IL-2 enhances the graft-protecting effects of tacrolimus by selectively expanding Tregs without unduly activating Teffs. These effects are synergistic when the combined tacrolimus and IL-2 treatment is initiated at the time of transplantation and are also apparent when IL-2 is administered at a later time point to transplant recipients on prolonged tacrolimus therapy. A synergistic effect of IL-2 and CNIs in combination with donor-specific transfusion or anti-lymphocyte serum had been described previously in a murine MHC-mismatched islet model and in a rat hind-limb transplant model, respectively (30, 31). Our current work provides a clear mechanistic explanation for these previously reported findings.
The use of low-dose IL-2 therapy in different clinical contexts has been reported to result in preferential expansion of Tregs, with increased suppressive function on a cell-per-cell basis. Importantly, these effects are maintained for months while IL-2 is being administered and, in agreement with the findings reported here, are still observed in the presence of immunosuppressive drugs such as CNIs (32–35). Our current data indicate that CNIs do not interfere with the capacity of IL-2 to expand Tregs. Hence, the combination of reduced levels of CNIs and low-dose IL-2 is likely to constitute an optimal immunosuppressive regimen to restrain Teffs while at the same time promoting Treg expansion in clinical transplantation.
Materials and Methods
Study Subjects.
Age- and sex-matched patients and healthy controls were enrolled after providing informed consent and approval of the protocol by the Health Research Authority of the National Health Service, King’s College London (reference: 15/NS/0062). Transplanted patients had stable graft function and were at least 1 y posttransplantation. Clinical and demographic characteristics are summarized further in Table S1 and in SI Materials and Methods.
Mice.
Wild-type C57BL/6 (B6), BALB/c, and B6(C)-H2-Ab1bm12/KhEgJ (hereafter, “bm12”) mice were purchased from Harlan and were kept in our specific pathogen-free animal facility at King's College London, London. FOXP3-YFP/cre mice were a kind gift of G. Lombardi, King's College London, London. All animals received humane care in compliance with the Animals (Scientific Procedures) Act 1986, and protocols were approved by the Animal Welfare and Ethical Review Body of King’s College London.
Statistics.
Unless otherwise stated, statistical analyses were performed with GraphPad Prism software. Student’s t test was used for comparison between two groups, and ANOVA analysis with Tukey’s post hoc correction for pairwise comparisons was used to compare more than two groups (*P < 0.05, **P < 0.01, ***P < 0.001, and ****P < 0.0001). Data are reported as mean ± SEM.
SI Materials and Methods
Study Subjects.
PBMCs were obtained from 37 liver transplant patients, 24 kidney recipients, 18 patients with chronic liver disease, and 23 age- and sex-matched healthy controls after informed consent and approval by the Health Research Authority of the National Health Service–King’s College London (reference: 15/NS/0062). Liver transplant recipients had stable graft function, were at least 1 y posttransplantation, and were receiving CNI-based immunosuppression (either in monotherapy or in combination with other agents). Clinical and demographic characteristics are summarized in Table S1.
Cell Isolation and Separation.
Human PBMCs were separated by density gradient sedimentation of whole blood on Ficoll-Paque (GE Healthcare). Mouse cells from spleen and lymph nodes were isolated by mechanic tissue disruption, and red blood cells were lysed with ammonium chloride. For skin cell isolation, skin fragments were incubated for 30 min at 37 °C with RPMI 1640 medium and 1 mg/mL Collagenase D (Roche) before mechanical homogenization. For gene-expression analysis of Teffs and Tregs isolated from Foxp3YFP reporter mice, CD4+ T cells, respectively YFP− and YFP+, were sorted on a BD FACSAria. For functional analysis of Tregs, CD4+CD25+ Tregs and CD4+CD25− Teffs were isolated using magnetic separation according to the manufacturer’s protocol (STEMCELL Technologies).
Whole-Blood in Vitro T-Cell Assay.
The study of the effects of CNIs on in vitro-cultured T lymphocytes is complicated by these drugs being heavily bound to red blood cells in vivo (36). To address this issue, we set up a whole-blood cell culture in which 500-μL aliquots of heparinized blood were cultured in 48-well plates for 4 d with regular assessment of whole-blood tacrolimus concentration. Tacrolimus was supplemented as required to maintain its concentration within 5–40 ng/mL. Cultures were also supplied with daily IL-2 (Proleukin; Novartis) or IL-7 (R&D Systems), depending on the experimental conditions. IL-2 concentrations (10 and 100 IU/mL) were selected to replicate the low-dose IL-2 concentrations given in clinical use [300,000 and 3,000,000 IU/m2, respectively (12)]. IL-7 concentrations were determined based on physiological levels in humans (2.5 and 25 pg/mL).
Functional Assays.
The mouse Treg suppression assay was performed by culturing 200,000 CD4+CD25− T cells with CD3/CD28 activation beads (1:1 ratio) (Thermo Fisher) and the addition of CD4+CD25+ Tregs as shown in Fig. 4F. T-cell proliferation was assessed by 3H-thymidine incorporation at 4 d of culture.
Cytokine Quantification.
Serum IL-2 after phytohaemagglutinin activation (1 g/L) of whole blood (5 h at 37 °C) was analyzed by ELISA according to the manufacturer’s protocol (eBioscience). IL-2 levels in serum from transplanted patients and controls were assessed using the V-PLEX Human IL-2 Kit (Meso Scale Discovery). IL-2 concentrations were calculated using linear regression after the generation of a standard curve.
Tacrolimus, rIL-2, and IL-2c Treatments.
Low-dose recombinant human IL-2 (Proleukin; 20,000 IU) was injected for 7 d in combination or not with tacrolimus (5 mg⋅kg−1⋅d−1). The IL-2c was formed by incubating 1 μg recombinant mouse IL-2 (eBioscience) and 5 μg of purified anti-mouse IL-2 (clone JES6-1A12) (eBioscience) for 30 min at 37 °C. This complex was administered at days 2, 3, and 4 after initiation of tacrolimus. All treatments were administered intraperitoneally.
Skin Transplant Model.
Skin grafting was performed according to an adaptation of the method of Billingham and Medawar (20). Briefly, skin grafting was conducted by grafting full-thickness tail skin (1 cm2) on the lateral flank. Grafts were monitored daily after the removal of the bandage on day 8 and were considered rejected when more than 75% of epithelial breakdown had occurred.
Skin allografts from BALB/c or bm12 donor mice were transplanted onto B6 mice. BALB/c skin recipients were left untreated, treated with a daily dose of tacrolimus (5 mg/kg) from day −3, treated with four consecutive doses of IL-2c from day −1 to day 2 followed by two more doses per week (IL-2c), or with the combination of both tacrolimus and IL-2c (Fig. 6A). Bm12 skin recipients were treated with 5 mg/kg tacrolimus from day −3 until day 28. Tacrolimus was administered daily until day 21 and every other day from day 21–28 posttransplantation, when the drug was discontinued completely (Fig. 6C). Four doses of IL-2c were injected during the last week of tacrolimus treatment (on days 21, 23, 25, and 27).
RNA Preparation and Microarray Analysis.
RNA samples for microarray were prepared by TRIzol extraction (Thermo Fisher), and the quantity, purity, and integrity of the samples were measured with a Qubit HS and a Bioanalyzer (Agilent). The samples then were reverse transcribed and amplified before hybridization to Affymetrix Mouse Gene 2.1 ST array. Hybridization and data collection were performed by the IDIBAPS Genome Core (University of Barcelona, Barcelona).
Microarray expression data were processed using quantile normalization using the Affy Bioconductor package. A conservative probe-filtering step was conducted next to exclude probes with a coefficient of variation >5%. To identify genes differentially expressed between groups, we used significant analysis of microarray (SAM). To assess the deregulation of sets of genes associated with specific functional pathways, we computed an enrichment score for each of the predefined gene sets included in the MSigDB (https://www.broadinstitute.org/gsea/msigdb/index.jsp) using the GSEA method. The enrichment score reflects the degree to which a gene set is overrepresented at the extremes (top or bottom) of the entire ranked gene list (the entire filtered gene list is ranked according to SAM). All microarray data discussed in this article have been deposited in National Center for Biotechnology Information Gene Expression Omnibus (GEO) (accession no. GSE80814).
Flow Cytometry Analysis.
Flow cytometry analysis was performed on freshly isolated human PBMCs and isolated mouse cells using the BD FACSCantoII cell analyzer (BD Bioscience) and were analyzed using FlowJo software (TreeStar, Inc.). Intracellular staining was performed using the FOXP3 Fixation/Permeabilization Kit (eBioscience) in accordance with the manufacturer’s protocol. For total cell count, 100 μL of whole blood were stained and treated with RBC lysis buffer (BioLegend) before the addition of CountBright beads (Thermo Fisher).
Phosphorylated STAT5a analyses for fresh or cryopreserved PBMC samples were performed in a batch manner using a violet fluorescent cell barcoding kit (BD Biosciences) as previously described (26). Briefly, for the initial IL-2 and IL-7 sensitivity screen, cryopreserved PBMC samples were thawed and rested for 10 min at 37 °C in X-VIVO-15 medium with 1% human pooled AB+ sera (Sigma-Aldrich). PBMCs then were stimulated with 0.2, 0.4, or 10 IU/mL human IL-2 (Proleukin; Novartis) and 100 or 500 pg/mL IL-7 (R&D Systems) for 30 min at 37 °C, fixed with BD Lyse/Fix buffer for 10 min, washed in PBS, and permeabilized with prechilled (−20 °C) BD Perm Buffer III for 30 min on ice. Cells were spun and resuspended in prechilled 50% BD Perm Buffer III (diluted with PBS) and incubated with the barcoding dye mixture at 4 °C for 30 min. Antibodies used in this study are detailed in Table S2.
Imaging Flow Cytometry.
CD4+ T cells were cultured for 30 min with PMA (20 ng/mL) and ionomycin (1.5 μM) or control medium after 30-min preculture with different concentrations of tacrolimus (20 or 2 ng/mL) or control medium. The NFAT1-staining protocol was performed using cultured or fresh cells as follows. After regular extracellular staining, the Foxp3 Staining Kit was used to permeabilize/fix and stain for Foxp3 (30 min). Permeabilization wash buffer consisting of 0.1% Triton X-100 was used from this point to incubate anti-NFAT1 (30 min) and anti-rabbit IgG (30 min). DAPI was added before cell acquisition. Quantitative analysis of nuclear translocation of NFAT was performed with the IDEAS image-analysis software (ImageStream/Amnis ;EMD Millipore). The corresponding nuclear (DAPI) and NFAT1 (FITC) images of each cell were compared, and a similarity score was assigned to individual cells. The similarity score is a Fisher Z transform of Pearson's correlation of the pixel intensity values of the DAPI and NFAT1 images within the nuclear area of each cell.
Linear Regression Analysis.
Linear regression analysis was performed to explore the influence of clinical and demographic parameters on the distribution of Treg subsets. We used each individual cell type as outcome and the different parameter as predictor variables. We used univariable models to examine separately the association of each predictor variable with the outcome and multivariable models to examine all predictor variables jointly.
Acknowledgments
We thank all the subjects and patients who volunteered for this study and the Medical Research Council Centre for Transplantation (reference J006742/1) and the National Institute for Health Research Biomedical Research Centre based at Guy's and St Thomas' National Health Service Foundation Trust and King's College London. This work was funded by King’s Health Partners Research Grant R140807 (to M.M.-L.), Fundacio Marato TV3 Grant 287/C/2012 (to A.S.-F. and J.J.L.), and Medical Research Council Grants MR/L008890/1 (to A.S.-F.) and MRK0255381 (to G.W.).
Footnotes
The authors declare no conflict of interest.
This article is a PNAS Direct Submission.
Data deposition: RNA microarray data have been deposited in the National Center for Biotechnology Information's Gene Expression Omnibus (GEO) database (accession no. GSE80814).
See Commentary on page 6883.
This article contains supporting information online at www.pnas.org/lookup/suppl/doi:10.1073/pnas.1620835114/-/DCSupplemental.
References
- 1.Sakaguchi S, Miyara M, Costantino CM, Hafler DA. FOXP3+ regulatory T cells in the human immune system. Nat Rev Immunol. 2010;10:490–500. doi: 10.1038/nri2785. [DOI] [PubMed] [Google Scholar]
- 2.Hermann-Kleiter N, Baier G. NFAT pulls the strings during CD4+ T helper cell effector functions. Blood. 2010;115:2989–2997. doi: 10.1182/blood-2009-10-233585. [DOI] [PubMed] [Google Scholar]
- 3.Wu Y, et al. FOXP3 controls regulatory T cell function through cooperation with NFAT. Cell. 2006;126:375–387. doi: 10.1016/j.cell.2006.05.042. [DOI] [PubMed] [Google Scholar]
- 4.Li X, Liang Y, LeBlanc M, Benner C, Zheng Y. Function of a Foxp3 cis-element in protecting regulatory T cell identity. Cell. 2014;158:734–748. doi: 10.1016/j.cell.2014.07.030. [DOI] [PMC free article] [PubMed] [Google Scholar]
- 5.Akimova T, et al. Differing effects of rapamycin or calcineurin inhibitor on T-regulatory cells in pediatric liver and kidney transplant recipients. Am J Transplant. 2012;12:3449–3461. doi: 10.1111/j.1600-6143.2012.04269.x. [DOI] [PMC free article] [PubMed] [Google Scholar]
- 6.Li Y, et al. Blocking both signal 1 and signal 2 of T-cell activation prevents apoptosis of alloreactive T cells and induction of peripheral allograft tolerance. Nat Med. 1999;5:1298–1302. doi: 10.1038/15256. [DOI] [PubMed] [Google Scholar]
- 7.Miyara M, et al. Functional delineation and differentiation dynamics of human CD4+ T cells expressing the FoxP3 transcription factor. Immunity. 2009;30:899–911. doi: 10.1016/j.immuni.2009.03.019. [DOI] [PubMed] [Google Scholar]
- 8.Afzali B, et al. CD161 expression characterizes a subpopulation of human regulatory T cells that produces IL-17 in a STAT3-dependent manner. Eur J Immunol. 2013;43:2043–2054. doi: 10.1002/eji.201243296. [DOI] [PMC free article] [PubMed] [Google Scholar]
- 9.Saito T, et al. Two FOXP3(+)CD4(+) T cell subpopulations distinctly control the prognosis of colorectal cancers. Nat Med. 2016;22:679–684. doi: 10.1038/nm.4086. [DOI] [PubMed] [Google Scholar]
- 10.Pan X, et al. Increased CD45RA+ FoxP3(low) regulatory T cells with impaired suppressive function in patients with systemic lupus erythematosus. PLoS One. 2012;7:e34662. doi: 10.1371/journal.pone.0034662. [DOI] [PMC free article] [PubMed] [Google Scholar]
- 11.Boyman O, Sprent J. The role of interleukin-2 during homeostasis and activation of the immune system. Nat Rev Immunol. 2012;12:180–190. doi: 10.1038/nri3156. [DOI] [PubMed] [Google Scholar]
- 12.Koreth J, et al. Interleukin-2 and regulatory T cells in graft-versus-host disease. N Engl J Med. 2011;365:2055–2066. doi: 10.1056/NEJMoa1108188. [DOI] [PMC free article] [PubMed] [Google Scholar]
- 13.Long SA, et al. Diabetes TrialNet and the Immune Tolerance Network Rapamycin/IL-2 combination therapy in patients with type 1 diabetes augments Tregs yet transiently impairs β-cell function. Diabetes. 2012;61:2340–2348. doi: 10.2337/db12-0049. [DOI] [PMC free article] [PubMed] [Google Scholar]
- 14.Saadoun D, et al. Regulatory T-cell responses to low-dose interleukin-2 in HCV-induced vasculitis. N Engl J Med. 2011;365:2067–2077. doi: 10.1056/NEJMoa1105143. [DOI] [PubMed] [Google Scholar]
- 15.He J, et al. Low-dose interleukin-2 treatment selectively modulates CD4(+) T cell subsets in patients with systemic lupus erythematosus. Nat Med. 2016;22:991–993. doi: 10.1038/nm.4148. [DOI] [PubMed] [Google Scholar]
- 16.Ito T, et al. Two functional subsets of FOXP3+ regulatory T cells in human thymus and periphery. Immunity. 2008;28:870–880. doi: 10.1016/j.immuni.2008.03.018. [DOI] [PMC free article] [PubMed] [Google Scholar]
- 17.Krieg C, Létourneau S, Pantaleo G, Boyman O. Improved IL-2 immunotherapy by selective stimulation of IL-2 receptors on lymphocytes and endothelial cells. Proc Natl Acad Sci USA. 2010;107:11906–11911. doi: 10.1073/pnas.1002569107. [DOI] [PMC free article] [PubMed] [Google Scholar]
- 18.Hirakawa M, et al. Low-dose IL-2 selectively activates subsets of CD4+ Tregs and NK cells. JCI Insight. 2016;1:e89278. doi: 10.1172/jci.insight.89278. [DOI] [PMC free article] [PubMed] [Google Scholar]
- 19.Klatzmann D, Abbas AK. The promise of low-dose interleukin-2 therapy for autoimmune and inflammatory diseases. Nat Rev Immunol. 2015;15:283–294. doi: 10.1038/nri3823. [DOI] [PubMed] [Google Scholar]
- 20.Charbonnier LM, et al. CTLA4-Ig restores rejection of MHC class-II mismatched allografts by disabling IL-2-expanded regulatory T cells. Am J Transplant. 2012;12:2313–2321. doi: 10.1111/j.1600-6143.2012.04184.x. [DOI] [PubMed] [Google Scholar]
- 21.Kornete M, Sgouroudis E, Piccirillo CA. ICOS-dependent homeostasis and function of Foxp3+ regulatory T cells in islets of nonobese diabetic mice. J Immunol. 2012;188:1064–1074. doi: 10.4049/jimmunol.1101303. [DOI] [PubMed] [Google Scholar]
- 22.Sim GC, et al. IL-2 therapy promotes suppressive ICOS+ Treg expansion in melanoma patients. J Clin Invest. 2014;124:99–110. doi: 10.1172/JCI46266. [DOI] [PMC free article] [PubMed] [Google Scholar]
- 23.Sumpter TL, Payne KK, Wilkes DS. Regulation of the NFAT pathway discriminates CD4+CD25+ regulatory T cells from CD4+CD25- helper T cells. J Leukoc Biol. 2008;83:708–717. doi: 10.1189/jlb.0507321. [DOI] [PubMed] [Google Scholar]
- 24.Torgerson TR, et al. FOXP3 inhibits activation-induced NFAT2 expression in T cells thereby limiting effector cytokine expression. J Immunol. 2009;183:907–915. doi: 10.4049/jimmunol.0800216. [DOI] [PMC free article] [PubMed] [Google Scholar]
- 25.Liston A, Gray DH. Homeostatic control of regulatory T cell diversity. Nat Rev Immunol. 2014;14:154–165. doi: 10.1038/nri3605. [DOI] [PubMed] [Google Scholar]
- 26.Yang JH, et al. Natural variation in IL-2 sensitivity influences regulatory T cell frequency and function in individuals with long-standing type 1 diabetes. Diabetes. 2015;64:3891–3902. doi: 10.2337/db15-0516. [DOI] [PMC free article] [PubMed] [Google Scholar]
- 27.Cerosaletti K, et al. Multiple autoimmune-associated variants confer decreased IL-2R signaling in CD4+ CD25(hi) T cells of type 1 diabetic and multiple sclerosis patients. PLoS One. 2013;8:e83811. doi: 10.1371/journal.pone.0083811. [DOI] [PMC free article] [PubMed] [Google Scholar]
- 28.Li Q, et al. Constitutive nuclear localization of NFAT in Foxp3+ regulatory T cells independent of calcineurin activity. J Immunol. 2012;188:4268–4277. doi: 10.4049/jimmunol.1102376. [DOI] [PubMed] [Google Scholar]
- 29.Vaeth M, et al. Dependence on nuclear factor of activated T-cells (NFAT) levels discriminates conventional T cells from Foxp3+ regulatory T cells. Proc Natl Acad Sci USA. 2012;109:16258–16263. doi: 10.1073/pnas.1203870109. [DOI] [PMC free article] [PubMed] [Google Scholar]
- 30.Jindal R, et al. Spontaneous resolution of acute rejection and tolerance induction with IL-2 fusion protein in vascularized composite allotransplantation. Am J Transplant. 2015;15:1231–1240. doi: 10.1111/ajt.13118. [DOI] [PubMed] [Google Scholar]
- 31.Kang HG, et al. Effects of cyclosporine on transplant tolerance: The role of IL-2. Am J Transplant. 2007;7:1907–1916. doi: 10.1111/j.1600-6143.2007.01881.x. [DOI] [PubMed] [Google Scholar]
- 32.Matsuoka K, et al. Low-dose interleukin-2 therapy restores regulatory T cell homeostasis in patients with chronic graft-versus-host disease. Sci Transl Med. 2013;5:179ra43. doi: 10.1126/scitranslmed.3005265. [DOI] [PMC free article] [PubMed] [Google Scholar]
- 33.Hartemann A, et al. Low-dose interleukin 2 in patients with type 1 diabetes: A phase 1/2 randomised, double-blind, placebo-controlled trial. Lancet Diabetes Endocrinol. 2013;1:295–305. doi: 10.1016/S2213-8587(13)70113-X. [DOI] [PubMed] [Google Scholar]
- 34.Ito S, et al. Ultra-low dose interleukin-2 promotes immune-modulating function of regulatory T cells and natural killer cells in healthy volunteers. Mol Ther. 2014;22:1388–1395. doi: 10.1038/mt.2014.50. [DOI] [PMC free article] [PubMed] [Google Scholar]
- 35.Kennedy-Nasser AA, et al. Ultra low-dose IL-2 for GVHD prophylaxis after allogeneic hematopoietic stem cell transplantation mediates expansion of regulatory T cells without diminishing antiviral and antileukemic activity. Clin Cancer Res. 2014;20:2215–2225. doi: 10.1158/1078-0432.CCR-13-3205. [DOI] [PMC free article] [PubMed] [Google Scholar]
- 36.Zahir H, McCaughan G, Gleeson M, Nand RA, McLachlan AJ. Changes in tacrolimus distribution in blood and plasma protein binding following liver transplantation. Ther Drug Monit. 2004;26:506–515. doi: 10.1097/00007691-200410000-00008. [DOI] [PubMed] [Google Scholar]


