Significance
Nonvolcanic stratospheric aerosols account for 20% of the radiative forcing of the entire atmospheric aerosol system since 1850. The Asian summer monsoon (ASM) effectively pumps Asian pollutants to the upper troposphere and lower stratosphere, leading to enhanced aerosol formation. Our in situ measurements combined with modeling work show that the aerosol formed within the ASM anticyclone is exported to the entire Northern Hemispheric stratosphere. On an annual average basis, we estimate that ∼15% of the Northern Hemisphere column stratospheric aerosol surface area originates from the Asian summer monsoon anticyclone region. This surface area is comparable to the modeled contribution from the sum of the small volcanic eruptions over the period 2000 to 2015.
Keywords: Asian summer monsoon, stratospheric aerosol, small volcanoes, Asian Tropopause Aerosol Layer, pollution
Abstract
An enhanced aerosol layer near the tropopause over Asia during the June–September period of the Asian summer monsoon (ASM) was recently identified using satellite observations. Its sources and climate impact are presently not well-characterized. To improve understanding of this phenomenon, we made in situ aerosol measurements during summer 2015 from Kunming, China, then followed with a modeling study to assess the global significance. The in situ measurements revealed a robust enhancement in aerosol concentration that extended up to 2 km above the tropopause. A climate model simulation demonstrates that the abundant anthropogenic aerosol precursor emissions from Asia coupled with rapid vertical transport associated with monsoon convection leads to significant particle formation in the upper troposphere within the ASM anticyclone. These particles subsequently spread throughout the entire Northern Hemispheric (NH) lower stratosphere and contribute significantly (∼15%) to the NH stratospheric column aerosol surface area on an annual basis. This contribution is comparable to that from the sum of small volcanic eruptions in the period between 2000 and 2015. Although the ASM contribution is smaller than that from tropical upwelling (∼35%), we find that this region is about three times as efficient per unit area and time in populating the NH stratosphere with aerosol. With a substantial amount of organic and sulfur emissions in Asia, the ASM anticyclone serves as an efficient smokestack venting aerosols to the upper troposphere and lower stratosphere. As economic growth continues in Asia, the relative importance of Asian emissions to stratospheric aerosol is likely to increase.
It is well documented that volcanic eruptions can inject aerosol and aerosol precursors into the stratosphere, resulting in cooling at the Earth’s surface (1, 2). In addition, a recent study (3) found that nonvolcanic stratospheric aerosols have a large cooling impact on climate, contributing about 20% of the aerosol radiative forcing relative to 1850. In the absence of volcanic injections, the largest source of stratospheric aerosols is transport from the tropical upper troposphere (4). Recent studies indicate that the Asian summer monsoon (ASM) anticyclone, which creates a dome or “bubble” of tropospheric air above the zonal mean tropopause (5), may also effectively transport tropospheric air into the stratosphere (6, 7). Satellite data show that the ASM system transports surface pollutants (e.g., carbon monoxide and hydrogen cyanide) to the upper troposphere (UT) and confines them within the upper-level ASM anticyclone (8, 9). The pollutants in the UT ascend across the tropopause into the lower stratosphere (LS). Trajectory analysis supports the role of the ASM system as a conduit for air parcels from the UT into the tropical and subtropical stratosphere (10–13). However, the transport efficiency to the stratosphere, especially for aerosols, and the resulting impact of ASM transport on stratospheric composition have not been quantified.
Satellites have observed values of aerosol extinction within the ASM anticyclone that are elevated relative to the global mean (14, 15). This enhanced aerosol extinction has been denoted the Asian Tropopause Aerosol Layer (ATAL). The satellite observations do not have sufficient vertical resolution, nor do they provide the accurate size distributions needed, to fully understand the processes that form and maintain the ATAL. Model simulations (16) suggest that the ATAL particles are composed of organics (mostly secondary organics formed in situ) and sulfate. However, the sources, spatial distribution, composition, and climate implications of the enhanced aerosol layer are not well understood, primarily due to the lack of in situ measurements of the size distribution and other physical/chemical properties. Although in situ balloon measurements have been made previously (17), the instrument used was not sufficiently sensitive to provide a detailed size distribution.
Recent years have seen large economic growth in Asia, resulting in increased anthropogenic emissions, including aerosol precursors. Deep convection associated with the ASM transports these precursors to the UT and LS where they contribute to aerosol nucleation and growth. Using satellite observations and model simulations, Vernier et al. (18) reported that the aerosol optical depth (AOD) of the ATAL has increased by 0.002 from 2000 to 2010. In this paper we present detailed aerosol size distribution profiles measured within the ASM anticyclone. We use the measurements to verify that the results from a detailed aerosol microphysics module coupled with a global climate model are representative and subsequently use the model output to assess global significance.
Results and Discussion
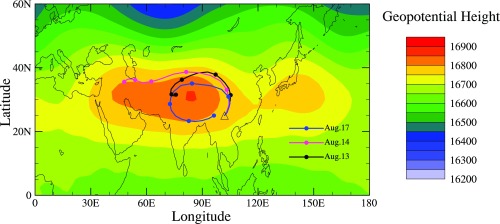
To study the vertical structure and size distribution of the ATAL we launched three balloon sondes from Kunming, China (25°N, 102°E) on August 13, 14, and 17, 2015. Each balloon carried an optical particle spectrometer, POPS (19), making high-quality in situ profile measurements of aerosol particle number density and size distribution in the 140- to 3,000-nm diameter range. Data were collected from the surface to 28 km in altitude. Each balloon payload also included sensors for ozone (20), water vapor (21), and optical particle backscatter (22). Additional measurements of temperature, pressure, and relative humidity were made with an Intermet (iMet-1-RSB) radiosonde on the same balloon. To place the measurement location in context, we show in Fig. 1 the time-averaged geopotential heights at 100 hPa from the Goddard Earth Observing System Version 5 data assimilation averaged for the time period of balloon operations. The area with the highest geopotential height (red in Fig. 1) indicates the center of the ASM anticyclone circulation. Five-day back trajectories using the National Oceanic and Atmospheric Administration (NOAA) HYSPLIT model were initiated at Kunming just above the tropopause for each of the balloon flight days. These trajectories show that the air sampled by the balloons is representative of the ASM anticyclone region.
Fig. 1.
Geopotential height at 100 hPa from the GEOS5 data assimilation, averaged from August 13–21, 2015. The black triangle denotes Kunming, China (25.1°N, 102.7°E). Five-days backward trajectories at 100 hPa over Kunming on August 13, 14, and 17 are shown in colored lines and dots on each trajectory line indicate positions at 1-d intervals. The 5-d trajectory uncertainties are estimated as ±5° latitude and ±11° longitude.
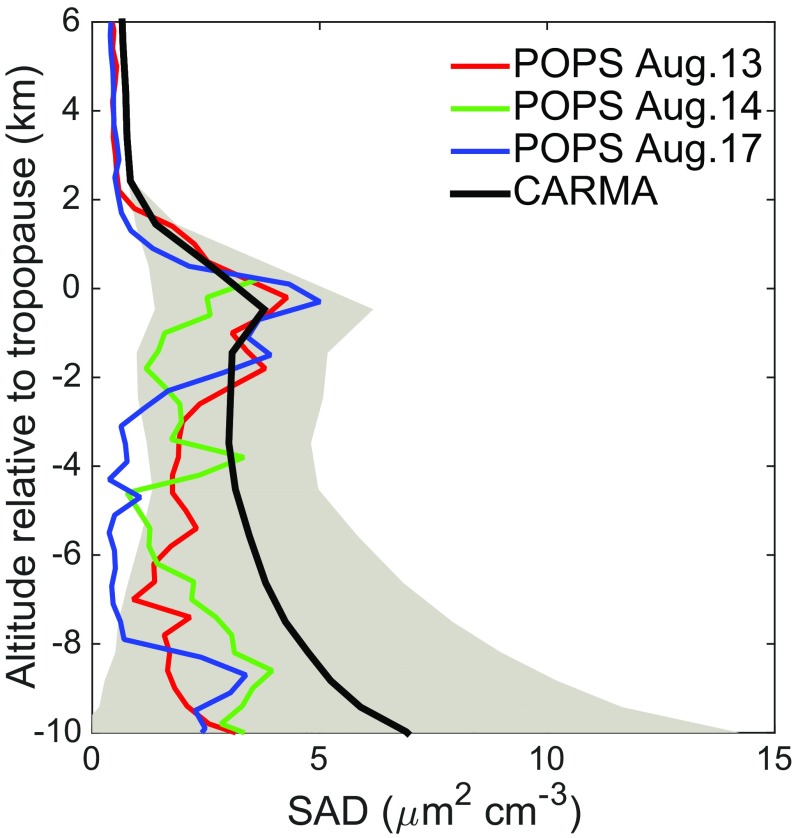
The particle surface area density (SAD) vertical profiles in the UT and LS over Kunming (Fig. 2) exhibit an enhanced layer near the tropopause. This aerosol layer extends from several kilometers below the tropopause up to 2 km above the tropopause. The layer is consistent with the location of the ATAL observed in satellite measurements and hereafter we will refer to it in that manner. The low values of SAD in the profiles below this layer suggest that aerosol from the lower troposphere is efficiently removed by scavenging associated with monsoon convection, and the ATAL is subsequently formed by in situ production of new particles from photochemically active sulfur and organic trace gases that were not completely scavenged during uplift. We note that the vertical aerosol distribution near the tropopause presented here is similar in shape (yet about three times as high in SAD values) to that observed in the tropics (4, 23), suggesting a similar formation mechanism. Once air parcels convectively lofted in the ASM reach the UT they tend to be contained by the strong anticyclonic circulation while continuing to ascend slowly into the LS. During this period of slow ascent, photochemistry produces lower volatility species that both nucleate new particles and condense on previously formed particles.
Fig. 2.
Aerosol SAD (square micrometers per cubic centimeter) vertical profiles in the UT and LS measured by POPS above Kunming, China (25°N, 102°E) on August 13, 14, and 17, 2015 (red, blue, and green lines) and simulated by CARMA averaged over the anticyclone region (black line). Gray shading denotes the range of spatial–temporal variability in the modeled profiles over the anticyclone region. The vertical coordinate is altitude relative to the tropopause.
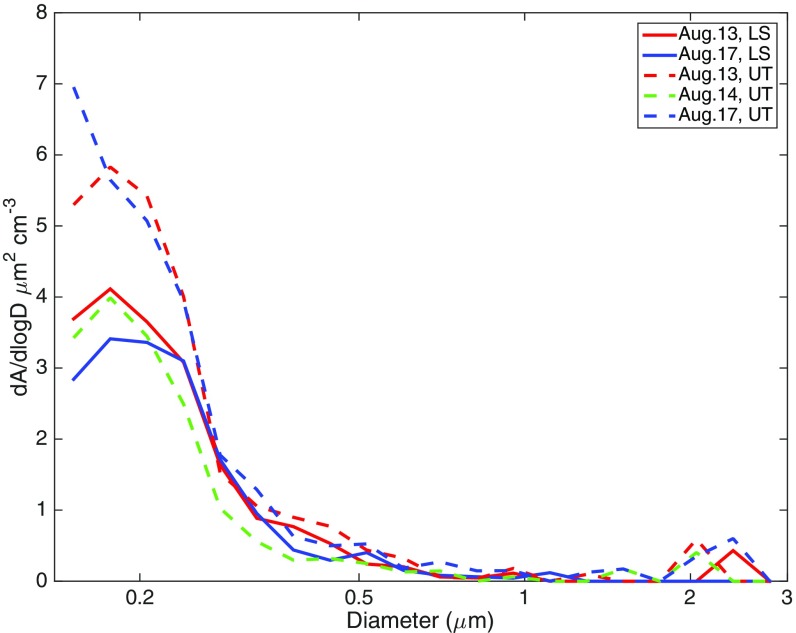
The observation of enhanced aerosol above the tropopause clearly indicates that air enters the stratosphere within the anticyclone, consistent with the conceptual model described in ref. 7 and shown in Fig. S1A. The similarity in the measured particle size distributions in the UT and LS (Fig. S2) suggests that nearly all of the formation of secondary organic aerosol (SOA) from short-lived photochemically active gases takes place in the UT. The back-trajectory analysis (Fig. 1) indicates that the air parcels sampled by the three flights have been circulating in the ASM for several days and are representative of a large area of the ASM. The fact that the ATAL was consistently observed in each flight suggests that it is a robust feature distributed throughout the ASM anticyclone.
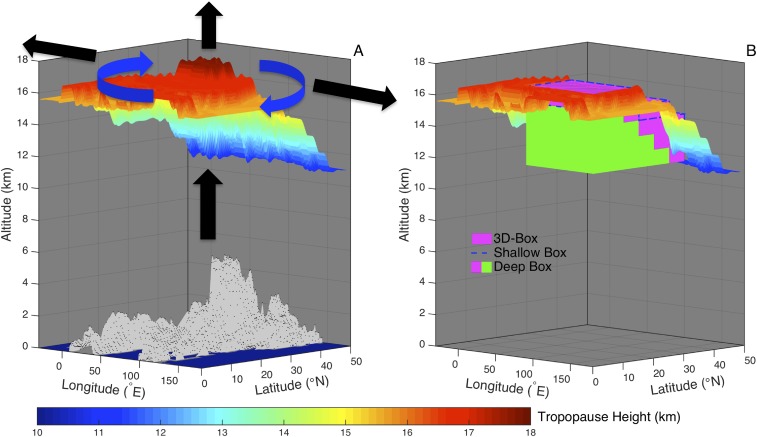
Fig. S1.
(A) Schematic showing air transport during the ASM. The modeled tropopause (from a June run) is denoted by the colored surface. Black arrows denote vertical and horizontal air transport. Blue arrows denote the anticyclone circulation. The ocean surface is shown in blue and land topography in light gray. The ASM dome is the higher tropopause heights denoted with orange and red colors. (B) Schematic showing the default 3D Box (in magenta), the shallow 3D box (in dashed blue), and the deep 3D box (magenta and green) with the modeled tropopause denoted by the colored surface.
Fig. S2.
Aerosol SAD distribution as a function of particle diameter for 1-km layers above and below the tropopause. The high-resolution data required for this plot above the tropopause on August 14 were not available. These curves indicate that the POPS measurements have generally captured over 60% of the aerosol surface area in the accumulation mode.
Our measurements show that the aerosol SAD decreases by about 80% between the tropopause and 2 km above the tropopause (Fig. 2). Because there is no known sink of aerosol mass in the LS and particle sedimentation is negligible during the 4-mo ASM season for the particle sizes observed, this decrease must be due to horizontal mixing with cleaner background stratospheric air as the anticyclone weakens at higher altitudes (7). We hypothesize that the ATAL particles mix out of the anticyclone and are transported throughout the entire Northern Hemisphere (NH) midlatitude belt.
Previous studies have suggested that pollution could be transported horizontally from the ASM region into the core of the tropical stratospheric upwelling region (8, 9). However, based on the latitudinal location (20–40°N) and height (17–19 km) of the ASM anticyclone, it is not clear how much of the air that ascends within the ASM anticyclone moves upward in the tropical LS vs. moving poleward and then descending through the lower extratropical branch of the Brewer–Dobson circulation. To further investigate the transport pathway for ASM aerosol, we use the Community Aerosol and Radiation Model for Atmospheres (CARMA) sectional aerosol model coupled with the Community Earth System Model (CESM); details are given in ref. 24. In general, the model, averaged over the entire ASM anticyclone region for August 2015, reproduces the vertical profile of aerosol surface area and size distribution observed by POPS in the UTLS reasonably well (Fig. 2). Modeled SAD in the UT (2–10 km below the tropopause) is generally higher than the observed values (Fig. 2), suggesting insufficient wet removal, whereas the agreement near the tropopause is very good. Additional model validation for global UTLS aerosol has been reported in previous studies (3, 16, 24). In particular, the modeled AOD of the ATAL is about 0.008 (16), and that observed AOD by Cloud-Aerosol Lidar and Infrared Pathfinder Satellite Observation is about 0.005 (18).
It is likely that there are deficiencies in the convective transport and scavenging in the model (25, 26), as evidenced by the discrepancies between model and measurements in the mid troposphere. However, for the purposes of this study, our interest is in the UT and LS (UTLS) where measurement/model agreement is good. For this study, it is the accuracy of the aerosol amounts and transport in the UTLS that is most important. In the UTLS, the slow ascent of air in the UT within the ASM anticyclone is in balance with dynamical and radiative processes. The level of zero radiative heating occurs near 15 km in the model, with positive heating rates above that, consistent with other climate/radiation models (27, 28). There are sources of uncertainty: Studies (27, 28) have shown that UTLS radiative heating and corresponding air motion are sensitive to the vertical distribution of clouds, which likely introduces some errors. Other uncertainties exist in regards to aerosol transport, including inaccuracies of subgrid scale parameterizations. Although we do not quantify those uncertainties relative to reality, our subsequent model analysis examines the differences between runs of the same model system, which likely minimizes errors in our conclusions.
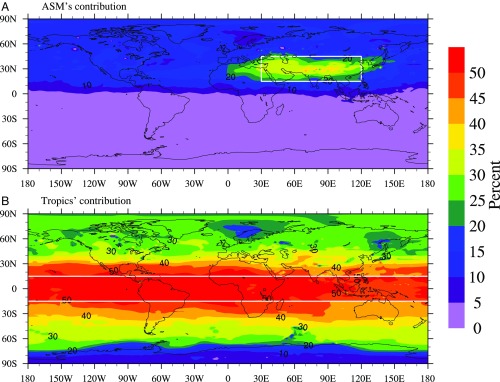
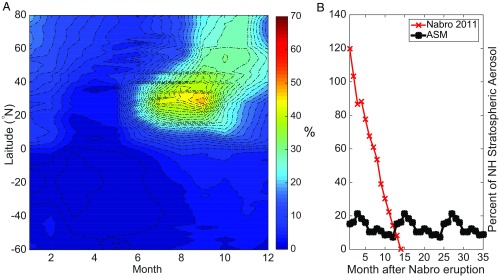
In our model, the ASM aerosol enters the LS both through ascent above the local tropopause in the ASM anticyclone and by horizontal transport out of the ASM dome (as indicated by black arrows in Fig. S1A). To diagnose the ASM contribution to the global stratospheric aerosol we compare two model simulations. The first is a normal, unperturbed control run that includes the ASM contribution to the stratospheric aerosol loading. For the second, we remove the ASM effect by eliminating all particles and aerosol precursor gases within the ASM anticyclone dome. One exception is carbonyl sulfide (OCS), which is a long-lived, well-mixed tracer; ASM-related transport of OCS is not expected to significantly affect the stratospheric aerosol budget. For ease of computation, a 3D box (Fig. S1B, volume colored in magenta, 15°–45°N, 30°–120°E, with latitude-dependent depth) is used to represent the dome during the period June through September (hereafter referred to as the 3D-box run). The difference between the control run and the 3D-box run represents the contribution of the ASM to the overall stratospheric aerosol. We use the ratio of that difference relative to the control run to compute the percent contribution plotted in this paper. Model details are given in Methods. For simplicity, only aerosol surface area densities, which are proportional to optical depth and therefore more relevant to radiative effects than number and volume densities, are discussed in this paper. As shown in Fig. 3A, the ASM contribution to stratospheric aerosol is confined to the NH. Its largest contribution is in the 10°N–40°N latitudinal band, and the peak coincides with the ASM anticyclone region. In the peak region, ∼20–35% of the annual averaged stratospheric column aerosol surface area is attributable to the ASM aerosol. Fig. 4A illustrates the cross-latitude transport of the ASM aerosol in the stratosphere. Between August and December a large portion of ASM aerosol moves poleward following the lower branch of the Brewer–Dobson circulation. The aerosol is eventually flushed out of the stratosphere at high latitudes.
Fig. 3.
(A) Contribution (percent) to the annual mean particle surface area in the stratosphere from aerosol that is transported through the ASM 3D box (15°–45°N, 30°–120°E, June–September). (B) Contribution to the annual mean particle surface area in the stratosphere from aerosol that is transported through the tropics (15°S–15°N, 0°–360°E, entire year). The white box in A shows the spatial extent of the region included in the 3D box where we scrub the aerosol and aerosol precursors.
Fig. 4.
(A) Contribution (percent) of the zonal-mean column SAD of stratospheric aerosol that was produced in or transported through the 3D box (15°–45°N, 30°–120°E, June to September). (B) Percentage of background NH stratospheric aerosol column surface area due to the Nabro 2011 eruption (in red) and ASM (in black).
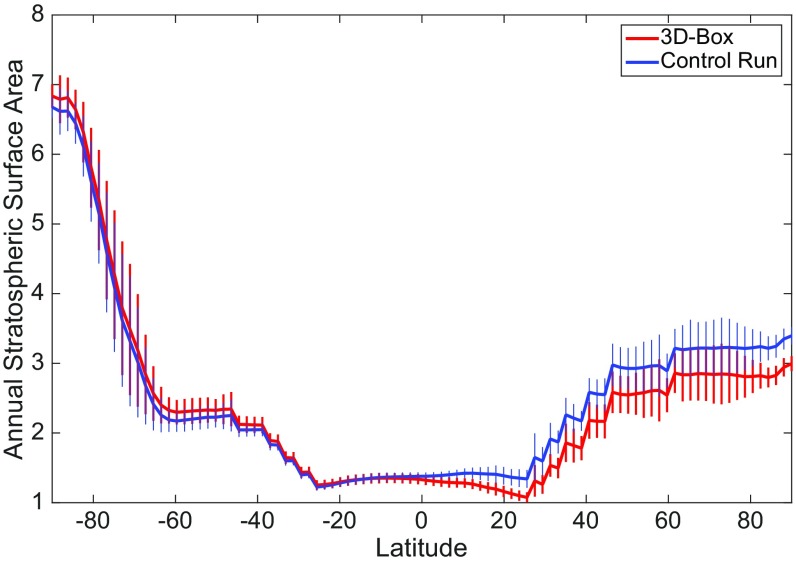
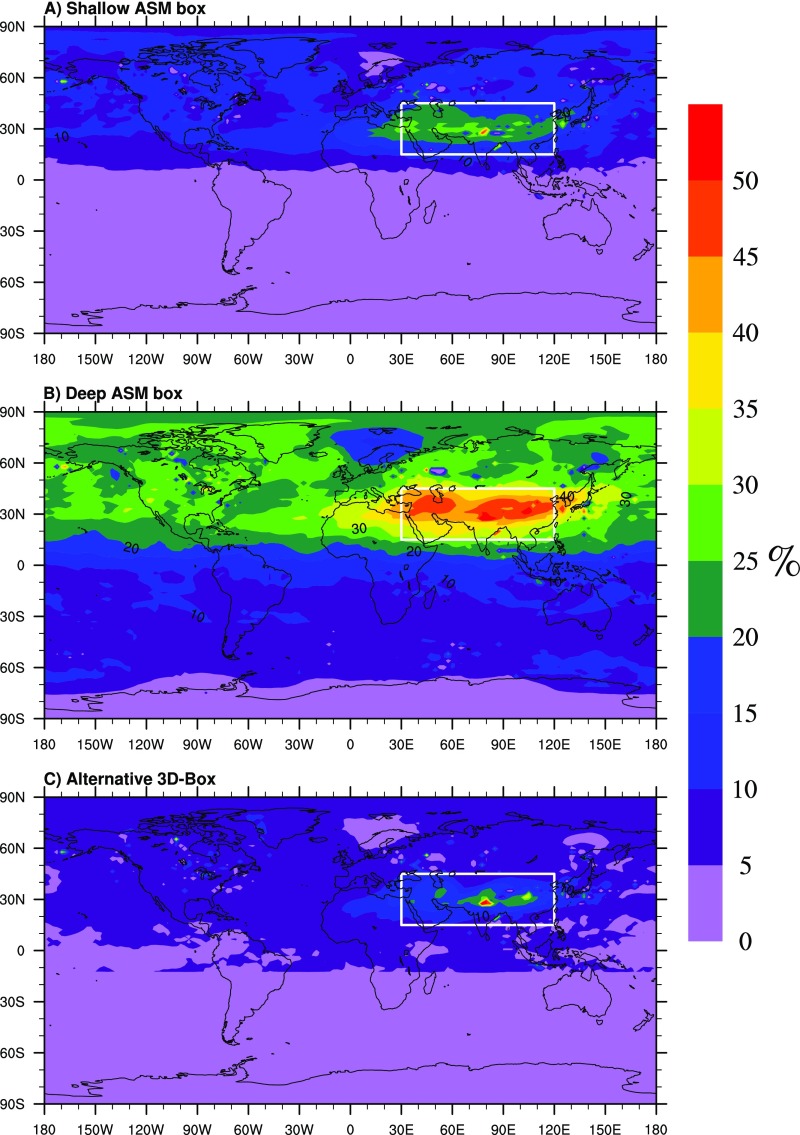
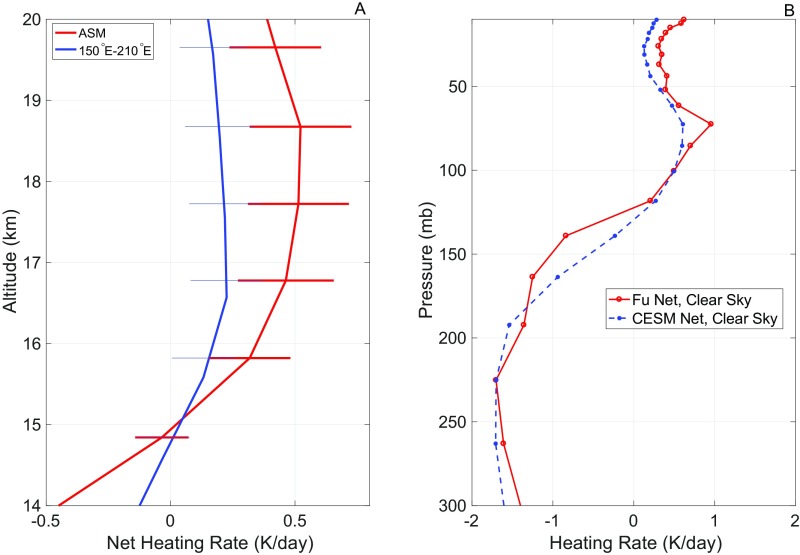
The large contribution from the ASM to stratospheric aerosol SAD in the NH (about 15% annually) is statistically robust (Fig. S3). The lower and upper bounds of the contribution are 10% and 25.4% (Fig. S4 A and B), respectively, determined through sensitivity study runs using either a shallow or deep 3D box. A shallow box eliminates vertical transport across the tropopause within the ASM anticyclone, whereas a deeper box also eliminates horizontal mixing out of the ASM anticyclone dome region. Detailed descriptions of the shallow and deep 3D boxes are given in Methods. Our model results indicate that the ASM’s contribution to the LS in the anticyclone region is primarily from direct vertical ascent. Contributions to the broader NH stratosphere are the result of horizontal mixing out of the ASM region. An alternate method (alternative 3D box hereafter) to estimate the ASM contribution is to set the concentrations of the various tracers inside the anticyclone to the mean of their values in the surrounding region (i.e., 150°–210°E, 15°–45°N) at each model step. As shown in Fig. S5, the heating rates inside the anticyclone are significantly higher than those in the adjacent regions outside of the anticyclone. The heating rates inside the model cannot be adjusted, and as a result of this greater heating particles in the lowest layer of the UT are pumped to higher altitudes faster inside the ASM anticyclone, resulting in an exaggerated upward aerosol flux in the model relative to what would be expected in reality. This exaggerated flux prevents the complete removal of the ASM effect on the stratospheric aerosol. Thus, this method provides another estimate of the lower limit of the ASM contribution. The lower limit calculated using this method is 7% (Fig. S4C).
Fig. S3.
Zonal mean annual column SAD (square micrometers per square centimeter) of stratospheric aerosols from two simulations. The control run is shown by the blue line, and the 3D-box run is shown by the red line. Error bars denote data variability (1 SD).
Fig. S4.
(A) Contribution (percent) to the annual mean particle surface area in the stratosphere from aerosol that is transported through the shallow Asian 3D box (15°–45°N, 30°–120°E, June–September). (B) Same as A but for the deep 3D box run. (C) Same as A but for the alternative 3D-box method for estimating the lower limit discussed in Results and Discussion.
Fig. S5.
(A) Modeled net heating rates for July 2015 within the inner ASM (25°–40°N, 70°–110°E; in red) and in the adjacent region outside of the ASM (25°–40°N, 150°–210°E; in blue). Error bars include several sources of uncertainties: radiative transfer model differences (∼0.1 K/d, estimated from ref. 27) and ozone and water vapor variations (assuming 20% uncertainties in the abundances). (B) Clear-sky net heating rate during July at a grid box within the ASM (29°N, 77°E) anticyclone simulated by CESM (dashed blue line) and the Fu-Liou (solid red line; see ref. 28) radiative transfer models.
Tropical upwelling has long been known to be the major pathway for transport of tropospheric aerosol into the stratosphere (4). To quantity the contribution to stratospheric aerosol from tropical upwelling we performed model simulations removing particles and condensable gases from the inner tropics (15°S–15°N, 0°–360°E) for the entire year. Our model results show that 35% of nonvolcanic stratospheric aerosol surface area in the NH is a consequence of upwelling from 15°S–15°N. As shown in Fig. 3B, the contribution from the inner tropics decreases from the equator (∼50%) to high latitudes (∼20%). In the ASM region, the model estimates that ∼70% of stratospheric aerosol originates from tropospheric SO2 and organics, with roughly equal contributions from within the ASM and from the tropics. At mid to high latitudes (40°–90°N), the ASM’s contribution (10–20%) is less than, but still comparable to, the tropical contribution (25–35%). The remaining sources of stratospheric aerosol are attributed to OCS and troposphere–stratosphere transport from other regions; there is still upwelling from 15° to the subtropical jet edge (which, depending on season, can extend to the midlatitudes).
The ASM contribution to stratospheric aerosol is difficult to directly quantify using measurements alone partially due to contributions from volcanic eruptions. Large volcanic eruptions, such as that of Mt. Pinatubo in 1991, greatly enhance the stratospheric aerosol loading for periods of up to a few years depending on the latitude, time, and injection height of the eruption (29). Since 2000 a number of smaller volcanic eruptions have contributed to variability in the stratospheric aerosol layer (30, 31). To assess the significance of the ATAL relative to recent volcanic activity, we performed a simulation of the 2011 Nabro volcanic eruption (13.37°N, 41.7°E), which was one of the larger tropical eruptions in recent years and contributed 23% of the volcanic SO2 injected above 10 km between 2000 and 2015 (30–32). Details of the model simulations are described in Methods. The model results show that the 2011 Nabro eruption led to an increase of ∼60% in the NH stratospheric aerosol surface area for about 1 y (Fig. 4B). Due to the consistent annual contribution of the monsoon (∼15% for the NH stratosphere annually), our study shows that the ASM makes a contribution comparable to that of the combined small volcanic eruptions in the period 2000–2015 (Methods).
Conclusions
Although the major sources of stratospheric aerosols are volcanic eruptions, tropical upwelling, and production due to OCS reactions, in this study we find that the ASM’s contribution to the stratosphere is significant, on the order of 15% for the NH annually. This is comparable to the combined contribution from small volcanic eruptions over the period from 2000 to 2015. Anthropogenic emissions in the ASM region are much larger than those averaged over the entire tropics, allowing the ASM to be a significant source (7.5% globally averaged) even though it only has an area that is 22% of that of the inner tropics (15°S–15°N, 0–360°E, 35% contribution to the global stratospheric aerosol). Given that the ASM anticyclone is only active for about 4 mo in each year, the ASM is currently about three times as effective in populating the NH stratosphere with aerosol as the tropics (Methods). The ASM’s contribution to the stratosphere is expected to grow as emissions increase from the rapidly expanding economies in Asia. Studies (10, 33) indicate that the dominant source of air within the ASM anticyclone is from the Indian subcontinent. With a substantial amount of organic and sulfur emissions in Asia, the ASM anticyclone is indeed an efficient chimney venting aerosols to the stratosphere, and its importance is likely to increase with time (34, 35).
Methods
Particle number size distribution was measured by custom-built POPS (18) with sufficiently low size detection limit to capture over 60% of the ATAL particle surface area (Fig. S2). The small size and low weight of the POPS makes it easily deployable on weather balloons. Each particle passing the laser beam creates a pulse signal, which is used to calculate particle size. The measured particle counts multiplied by their surface area assuming a spherical shape were binned by size to construct the particle area size distributions.
The CARMA sectional aerosol model coupled with the CESM global model (24, 36) is used for this study. In CARMA, we track two types of aerosol in two sets of size bins. One type consists of sulfuric acid particles formed through nucleation and condensation of water and sulfuric acid vapor. The other set of bins includes particles containing mixtures of organics, black carbon, sea salt, dust, and condensed sulfate. We run CESM/CARMA with a horizontal resolution of 1.9° × 2.5° and 56 levels vertically (with 20 levels above 100 hPa). A volatility-basis-set (37) method is used in CESM/CARMA to simulate SOA including oxidation of volatile organic compounds (VOCs) and partitioning between gas and particle phase. Emission databases used for SO2, VOCs, and primary organic aerosols (POA) are described in the ref. 38.
We conducted two types of model simulations to derive the contribution of ASM to the stratospheric aerosol loading. Both simulations are driven by the Modern-Era Retrospective Analysis for Research and Applications offline meteorology. The first was a control run of 5 y repeating the year 2011. The second (3D-box run) was a 5-y simulation (with an additional 3-y spin-up, repeating the year 2011) where no aerosol or condensable gases (i.e., SO2 and VOCs) within a specified region were transported to the stratosphere. Both of these cases have no volcanic emissions and we average the 5 y to obtain results. To compare the ASM with the volcanic contribution we did a third simulation to simulate the 2011 Nabro eruption (13.4°N, 41.7°E). Because we use a fixed dynamics model formulation, neither ASM particles nor Nabro particles feed back into changes in the dynamical or thermodynamical fields.
For the second type of simulation (3D-box run) we considered multiple cases. To assess the importance of the ASM aerosol transported into the stratosphere, we eliminated all particles and condensable gases inside the 3D box in the ASM anticyclone region just below the tropopause (Fig. S1B, region colored in magenta) from June through September. The depth of the 3D box is latitude-dependent, ranging from 1 km (15°–25°N) to about 4 km (40°–45°N) with the upper level set to be the local tropopause. The varying lower bound of the box is due to the decreasing zonal mean tropopause height with latitude (from ∼16 km at 15°N to ∼12 km at 45°N). The upper level of the box is fixed because the tropopause height within the ASM anticyclone is relatively constant with latitude at 15–17 km. Due to the relatively high tropopause associated with the ASM, any tracer transported out of the ASM dome either vertically or horizontally is counted as a stratospheric source. In the lower latitudes (15°–25°N) of the box we minimize the depth to one model layer (i.e., 100 hPa, 1 km thick); from 25°N to 35°N the depth of the box is about 2 km from to 100 hPa to 118 hPa (model pressure level), from 35° to 40°N the depth of the box is about 3 km from 100 to 139 hPa (model pressure levels), and from 40° to 45°N the depth of the box is about 4 km from 118 to 192 hPa (model pressure levels). To estimate the lower limit of the ASM’s contribution to stratospheric aerosol surface area, we apply a shallow 3D box with a 1-km-thick layer at 100 hPa in the entire ASM region (Fig. S1B, volume marked by blue dashed lines). This eliminates the vertical transport of aerosol to the stratosphere but still allows the horizontal transport of aerosol from the ASM dome to the stratosphere. To estimate the upper limit, we apply a deep box (Fig. S1B, volume colored in both magenta and green) that eliminates both vertical and horizontal transport from the ASM dome to the stratosphere. The model was run for 5 y using 2011 meteorology for both cases. To estimate the tropical contribution to the stratospheric aerosol layer, we removed particles and condensable gases from the tropical tropopause region (15°S–15°N, 0°–360°E) for the entire year to quantify the contribution from tropical upwelling. The differences in aerosol parameters between the control and 3D-box runs represent the contributions from the ASM circulation or the tropics.
For the 2011 Nabro eruption simulation (13.4°N, 41.7°E) we injected 1.5 Tg SO2 from 10 to 17 km (i.e., eight model vertical levels from 312 hPa to 100 hPa) on June 13, following emissions estimated from previous studies (30–32). We ran the model for 2 y from June 2011 to June 2013. To estimate the contribution of volcanic eruptions to stratospheric aerosol relative to that of the ASM we must consider the effective annual contribution from the 2011 Nabro simulation over the longer time period from 2000 to 2015. A simple estimate is to divide the 60% increase over the 1 y in the simulation by the 15 y of consideration. That gives a total contribution of a Nabro-type eruption of 4%/y. As stated in the text, the 2011 Nabro eruption accounted for 23% of the total volcanic SO2 likely producing stratospheric aerosols for the period of 2000–2015. We can then multiply 4%/y by the factor 1/23% to get an average volcanic contribution to NH stratospheric aerosol of 17.4%/y, which is comparable to the ASM contribution of 15%/y.
The effectiveness of the ASM transport relative to inner tropics in populating the stratosphere with aerosol (approximately a factor of 3) is calculated using the relative contributions to the stratospheric global annual average aerosol surface areas (7.5% vs. 35%, respectively), the months of the year they are both active (4 vs. 12 mo), and their relative sizes (ASM is 22% smaller than the inner topics), which gives (7.5/35)*(12/4)(1/0.22) ∼3.
Acknowledgments
We thank Dr. D. W. Fahey and Dr. D. M. Murphy [NOAA-Earth System Research Laboratory (ESRL)] for helpful discussions. The CESM project is supported by the NSF and the Office of Science (Biological and Environmental Research) of the US Department of Energy. This work was also supported by the NOAA-ESRL (P.Y., K.H.R., and R.-S.G.). The field campaign is funded by NSF of China Grants 91337214 and 41675040.
Footnotes
The authors declare no conflict of interest.
This article is a PNAS Direct Submission.
This article contains supporting information online at www.pnas.org/lookup/suppl/doi:10.1073/pnas.1701170114/-/DCSupplemental.
References
- 1.Solomon S, et al. The persistently variable “background” stratospheric aerosol layer and global climate change. Science. 2011;333:866–870. doi: 10.1126/science.1206027. [DOI] [PubMed] [Google Scholar]
- 2.Neely RR, et al. Recent anthropogenic increases in SO2 from Asia have minimal impact on stratospheric aerosol. Geophys Res Lett. 2013;40:999–1004. [Google Scholar]
- 3.Yu P, et al. Radiative forcing from anthropogenic sulfur and organic emissions reaching the stratosphere. Geophys Res Lett. 2016;43:9361–9367. [Google Scholar]
- 4.Brock CA, Hamill P, Wilson JC, Jonsson HH, Chan KR. Particle formation in the upper tropical troposphere: A source for the stratospheric aerosol. Science. 1995;270:1650–1653. [Google Scholar]
- 5.Pan LL, et al. Transport of chemical tracers from the boundary layer to stratosphere associated with the dynamics of the Asian summer monsoon. J Geophys Res Atmos. 2016;121:14159–14174. [Google Scholar]
- 6.Randel WJ, Park M. Deep convective influence on the Asian summer monsoon anticyclone and associated tracer variability observed with Atmospheric Infrared Sounder (AIRS) J Geophys Res. 2006;111:D12314. [Google Scholar]
- 7.Park M, Randel WJ, Gettelman A, Massie ST, Jiang JH. Transport above the Asian summer monsoon anticyclone inferred from Aura Microwave Limb Sounder tracers. J Geophys Res. 2007;112:D16309. [Google Scholar]
- 8.Park M, Randel WJ, Emmons LK, Livesey NJ. Transport pathways of carbon monoxide in the Asian summer monsoon diagnosed from model of ozone and related tracers (MOZART) J Geophys Res. 2009;114:D08303. [Google Scholar]
- 9.Randel WJ, et al. Asian monsoon transport of pollution to the stratosphere. Science. 2010;328:611–613. doi: 10.1126/science.1182274. [DOI] [PubMed] [Google Scholar]
- 10.Bergman JW, Fierli F, Jensen EJ, Honomichl S, Pan LL. Boundary layer sources for the Asian anticyclone: Regional contributions to a vertical conduit. J Geophys Res Atmos. 2013;118:2560–2575. [Google Scholar]
- 11.Garny H, Randel WJ. Transport pathways from the Asian monsoon anticyclone to the stratosphere. Atmos Chem Phys. 2016;16:2703–2718. [Google Scholar]
- 12.Vogel B, et al. Long-range transport pathways of tropospheric source gases originating in Asia into the northern lower stratosphere during the Asian monsoon season 2012. Atmos Chem Phys. 2016;16:15301–15325. [Google Scholar]
- 13.Vogel B, et al. Fast transport from Southeast Asia boundary layer sources to northern Europe: Rapid uplift in typhoons and eastward eddy shedding of the Asian monsoon anticyclone. Atmos Chem Phys. 2014;14:12745–12762. [Google Scholar]
- 14.Vernier J-P, Thomason LW, Kar J. CALIPSO detection of an Asian tropopause aerosol layer. Geophys Res Lett. 2011;38:L07804. [Google Scholar]
- 15.Thomason LW, Vernier J-P. Improved SAGE II cloud/aerosol categorization and observations of the Asian tropopause aerosol layer: 1989–2005. Atmos Chem Phys. 2013;13:4605–4616. [Google Scholar]
- 16.Yu P, Toon OB, Neely RR, Martinsson BG, Brenninkmeijer CA. Composition and physical properties of the Asian tropopause aerosol layer and the North American tropospheric aerosol layer. Geophys Res Lett. 2015;42:2540–2546. doi: 10.1002/2015GL063181. [DOI] [PMC free article] [PubMed] [Google Scholar]
- 17.Tobo Y, Zhang D, Iwasaka Y, Shi G. On the mixture of aerosols and ice clouds over the Tibetan Plateau: Results of a balloon flight in the summer of 1999. Geophys Res Lett. 2007;34:L23801. [Google Scholar]
- 18.Vernier J-P, et al. Increase in upper tropospheric and lower stratospheric aerosol levels and its potential connection with Asian pollution. J Geophys Res Atmos. 2015;120:1608–1619. doi: 10.1002/2014JD022372. [DOI] [PMC free article] [PubMed] [Google Scholar]
- 19.Gao RS, et al. A light-weight, high-sensitivity particle spectrometer for PM2.5 aerosol measurements. Aerosol Sci Technol. 2016;50:88–99. [Google Scholar]
- 20.Komhyr WD. Electrochemical concentration cells for gas analysis. Ann Geophys. 1969;25:203–210. [Google Scholar]
- 21.Vömel H, David DE, Smith K. Accuracy of tropospheric and stratospheric water vapor measurements by the cryogenic frost point hygrometer: Instrumental details and observations. J Geophys Res. 2007;112:D08305. [Google Scholar]
- 22.Brabec M, et al. Particle backscatter and relative humidity measured across cirrus clouds and comparison with microphysical cirrus modelling. Atmos Chem Phys. 2012;12:9135–9148. [Google Scholar]
- 23.Borrmann S, et al. Aerosols in the tropical and subtropical UT/LS: In-situ measurements of submicron particle abundance and volatility. Atmos Chem Phys. 2010;10:5573–5592. [Google Scholar]
- 24.Yu P, et al. Evaluations of tropospheric aerosol properties simulated by the community earth system model with a sectional aerosol microphysics scheme. J Adv Model Earth Syst. 2015;7:865–914. doi: 10.1002/2014MS000421. [DOI] [PMC free article] [PubMed] [Google Scholar]
- 25.Zhang GJ, Mu M. Simulation of the Madden–Julian oscillation in the NCAR CCM3 using a revised Zhang–McFarlane convection parameterization scheme. J Clim. 2005;18:4046–4064. [Google Scholar]
- 26.Yang B, et al. Uncertainty quantification and parameter tuning in the CAM5 Zhang-McFarlane convection scheme and impact of improved convection on the global circulation and climate. J Geophys Res Atmos. 2013;118:395–415. [Google Scholar]
- 27.Gettelman A, et al. Radiation balance of the tropical tropopause layer. J Geophys Res. 2004;109:D07103. [Google Scholar]
- 28.Yang Q, Fu Q, Hu Y. Radiative impacts of clouds in the tropical tropopause layer. J Geophys Res. 2010;115:D00H12. [Google Scholar]
- 29.English JM, Toon OB, Mills MJ. Microphysical simulations of large volcanic eruptions: Pinatubo and Toba. J Geophys Res Atmos. 2013;118:1880–1895. [Google Scholar]
- 30.Andersson SM, et al. Significant radiative impact of volcanic aerosol in the lowermost stratosphere. Nat Commun. 2015;6:7692. doi: 10.1038/ncomms8692. [DOI] [PMC free article] [PubMed] [Google Scholar]
- 31.Mills MJ, et al. Global volcanic aerosol properties derived from emissions, 1990–2014, using CESM1(WACCM) J Geophys Res Atmos. 2016;121:2332–2348. [Google Scholar]
- 32.Bourassa AE, et al. Large volcanic aerosol load in the stratosphere linked to Asian monsoon transport. Science. 2012;337:78–81. doi: 10.1126/science.1219371. [DOI] [PubMed] [Google Scholar]
- 33.Yan R, Bian J. Tracing the boundary layer sources of carbon monoxide in the Asian summer monsoon anticyclone using WRF-Chem. Adv Atmos Sci. 2015;32:943–951. [Google Scholar]
- 34.Krotkov NA, et al. Aura OMI observations of regional SO2 and NO2 pollution changes from 2005 to 2015. Atmos Chem Phys. 2016;16:4605–4629. [Google Scholar]
- 35.Kilmont Z, Smith SJ, Cofala J. The last decade of global anthropogenic sulfur dioxide: 2000–2011 emissions. Environ Res Lett. 2013;8:014003. [Google Scholar]
- 36.Toon OB, Turco RP, Westphal D, Malone R, Liu M. A multidimensional model for aerosols: Description of computational analogs. J Atmos Sci. 1988;45:2123–2144. [Google Scholar]
- 37.Pye HOT, Chan AWH, Barkley MP, Seinfeld JH. Global modeling of organic aerosol: The importance of reactive nitrogen (NOx and NO3) Atmos Chem Phys. 2010;10:11261–11276. [Google Scholar]
- 38.Emmons LK, et al. Description and evaluation of the model for ozone and related chemical tracers, version 4 (MOZART-4) Geosci Model Dev. 2010;3:43–67. [Google Scholar]


