Significance
Current desalination technologies provide solutions to the increasing water demands of the planet but require substantial electric energy, limiting their sustainable use where conventional power infrastructure may be unavailable. Here, we report a direct solar method for desalination that utilizes nanoparticle-assisted solar vaporization in a membrane distillation geometry. This scalable process is capable of providing sufficient clean water for family use in a compact footprint, potentially for off-grid desalination at remote locations.
Keywords: solar, photothermal, desalination, carbon black, nanophotonics
Abstract
With more than a billion people lacking accessible drinking water, there is a critical need to convert nonpotable sources such as seawater to water suitable for human use. However, energy requirements of desalination plants account for half their operating costs, so alternative, lower energy approaches are equally critical. Membrane distillation (MD) has shown potential due to its low operating temperature and pressure requirements, but the requirement of heating the input water makes it energy intensive. Here, we demonstrate nanophotonics-enabled solar membrane distillation (NESMD), where highly localized photothermal heating induced by solar illumination alone drives the distillation process, entirely eliminating the requirement of heating the input water. Unlike MD, NESMD can be scaled to larger systems and shows increased efficiencies with decreased input flow velocities. Along with its increased efficiency at higher ambient temperatures, these properties all point to NESMD as a promising solution for household- or community-scale desalination.
Four billion people around the world face at least 1 month of water scarcity every year (1, 2). To meet increasing water demand, it has become necessary to exploit saline water, abundant in the ocean and in brackish aquifers, and convert it to potable water (3, 4). Presently, there are more than 18,000 water desalination plants operating in 150 countries, producing 86.8 × 10⁶ m3 of water per day, enough for 300 million people (5, 6). The annual energy consumed by these plants is nominally 75 TWh, accounting for 50% of their operating costs (7–9) and 0.4% of the world electric power consumption (10). The possibility of directly using renewable energy would reduce this highly demanding cost of operation and make affordable clean water more accessible around the world.
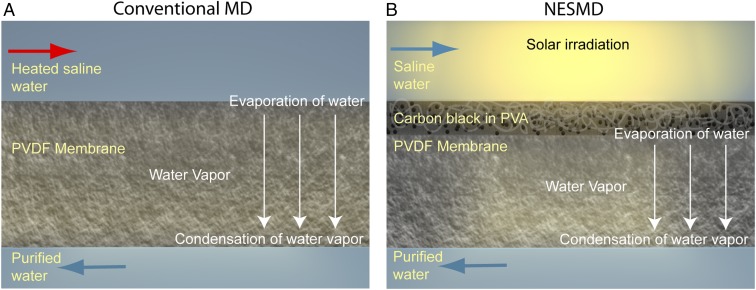
Many of the current desalination techniques involve phase change, and thus are inherently energy intensive. Among these, membrane distillation (MD) has gained recent attention because it can distill water at lower temperatures than conventional distillation (i.e., boiling) and lower pressures than reverse osmosis (RO) (11–16). In the conventional direct-contact MD process, hot saline water (feed) and cold purified water (distillate) flow on opposite sides of a hydrophobic membrane (Fig. 1A). The temperature difference between the two flows produces a vapor pressure difference across the membrane, leading to (salt-free) water vapor transporting through the membrane from the warmer feed to the colder distillate, where it condenses. However, MD suffers from several inherent limitations. Heat transfer reduces the cross-membrane temperature difference, resulting in lower vapor flux across the membrane and thus lower efficiency. This temperature difference is further decreased along the length of the membrane module, resulting in a maximal usable length of a single module.
Fig. 1.
Comparison of conventional membrane distillation (MD) and nanophotonics-enabled solar membrane distillation (NESMD). (A) In MD, heated saline (input) water and ambient temperature distillate water flow on each side of a PVDF membrane. The temperature difference generates a vapor pressure difference across the membrane, resulting in evaporation from the feed–membrane interface to condensation at the distillate–membrane interface. Nonvolatile contaminants do not evaporate and are therefore not present in the distillate. (B) In NESMD, light-absorbing (CB) NPs are embedded in an electrospun PVA layer deposited on a PVDF membrane. Upon solar illumination, the CB-laden membrane layer generates an elevated vapor pressure with no additional heat source. Water vapor condenses at the distillate–membrane interface.
When no recirculation or heat recovery is used, energy is also lost when hot feed water exits the membrane module. Heating the volume of feed water by conventional solar methods before its flow through the module suffers these same inherent limitations (17–21). Localized heating in the feed channel can be achieved by integrating MD into industrial processes (22) or by using a solar absorber plate above the feed channel (23) to provide supplementary heating along the module length, but such a system is still limited by an inherent reduction in cross-membrane temperature difference due to heat transfer, for example, temperature polarization. Localized heating at the surface of the feed membrane interface (24–26) can provide an effective solution to overcome these challenges. In this work, we demonstrate nanophotonics-enabled solar membrane distillation (NESMD), where membrane distillation is based on direct, localized solar heating of a nanoparticle (NP)-infused membrane. We address the challenges of module scalability with experimental and theoretical analysis for a wide range of NESMD working conditions.
Here, we demonstrate direct solar distillation driven by NP-mediated photothermal heating in a MD geometry (Fig. 1B). This process is based on the highly efficient, highly localized photothermal heating (27–30) induced by solar illumination of broadband light-absorbing NPs, here embedded within the surface layer of the distillation membrane. The localized heating induces vaporization of the feed water, which subsequently condenses on the distillate side of the membrane. The localized solar photothermal heating process replaces the need to heat the entire volume of feed water by external means, eliminating the inherent efficiency limitations and substantial power requirements of the conventional MD process. Using a small-scale experimental NESMD module, we obtained a flux of over 5.38 kg/(m2⋅h) with a solar efficiency of over 20% and greater than 99.5% salt rejection under focused solar illumination. Comparing NESMD to conventional MD reveals dramatic differences between the two processes, where unlike MD, NESMD appears readily scalable to larger geometries with increased efficiencies under higher ambient temperature conditions (40 °C). These characteristics point to NESMD as a highly promising potential off-grid desalination technology.
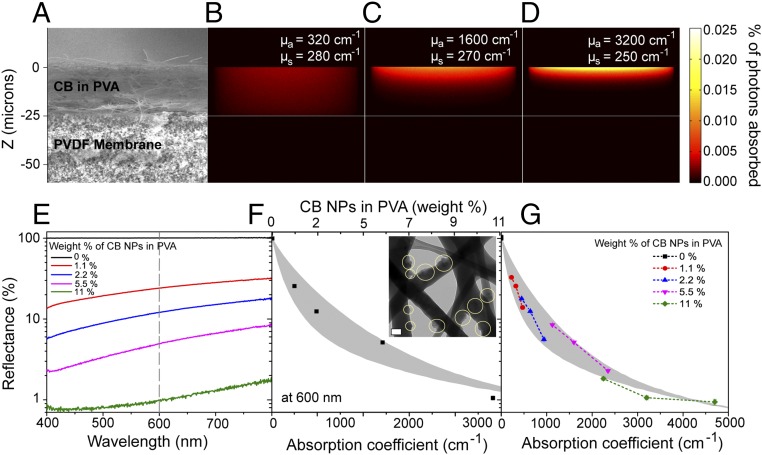
The photothermal membrane central to NESMD is a bilayer structure consisting of a relatively thin (25 μm), optically absorbing, porous, hydrophilic [polyvinyl alcohol (PVA)] coating deposited onto a commercial polyvinylidene fluoride (PVDF) membrane (0.2-µm nominal pore size; Pall Corporation) (Fig. 2A). Carbon black (CB) NPs (Cabot Corporation) with a broadband absorption over the entire solar spectrum (Fig. 2E and Fig. S1B) were dispersed into the PVA solution. Following a pretreatment by polydopamine to ensure adhesion, the PVA solution was electrospun onto the PVDF membrane, forming a network of CB-laden PVA nanofibers (Fig. 2 A and F, Inset).
Fig. 2.
Optical characterization of the photothermal membrane. (A) SEM image of the cross-section of the bilayer membrane. (B–D) Spatial photon absorption distributions in bilayer membrane as a function of CB concentration (wt%), corresponding to the dimensions shown in A. (B) 1.1 wt%; (C) 5.5 wt%; (D) 11 wt%. (E) Experimentally measured diffuse reflectance spectra for a photothermal membrane with varying CB concentrations. (F) Experimental (black squares) and theoretical (gray area) reflectance at 600 nm as a function of CB concentration. (Inset) Transmission electron micrograph (TEM) of CB-laden PVA coating of the bilayer membrane. (G) Reflectance versus absorption coefficient for varying CB concentrations in PVA at the wavelengths 800, 600, and 400 nm (Left to Right).
Fig. S1.
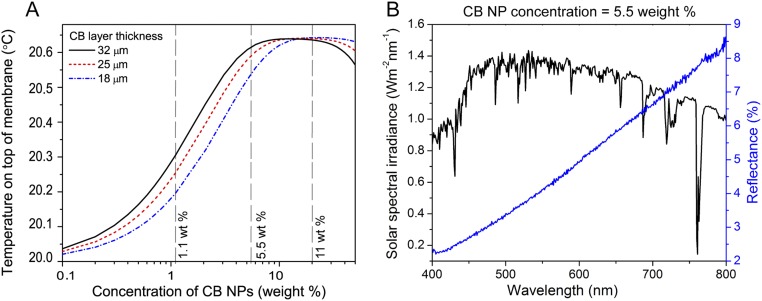
Absorption and resulting average temperature at the PVDF membrane surface due to CB NPs. (A) Temperature at the PVDF membrane surface with varying CB NP concentration in the top PVA layer (log scale) with different thicknesses of photothermal coatings: 32 μm (black), 25 μm (red), and 18 μm (blue). The gray dotted lines corresponds to 1.1, 5.5, and 11 wt% of CB NP concentration in PVA, for which photon absorption maps are shown in Fig. 3 B–D, respectively. (B) Variation of reflectance of photothermal membrane containing 5.5 wt% CB NP concentration in PVA (blue) with solar spectral irradiance (black) in the range of 400–800 nm. The average reflectance value gives the average absorption coefficient of 182 cm−1/wt%.
The optical properties of the CB-laden bilayer photothermal membrane were characterized to determine an optimal concentration range of CB absorbers to serve as a heat source for NESMD (Fig. 2). The absorption efficiency and spatial distribution of absorbed energy together determine the heat source density, which dictates the solar photothermal temperature increase and thus the water vapor flux through the membrane. Because the CB-laden membrane is a medium that is both strongly optically scattering and absorbing, theoretical calculations using a Monte Carlo photon transport method were necessary to accurately describe the membrane’s utility as a photodriven heat source (27). The calculated distribution of absorbed photons (Fig. 2 B–D) were compared with diffuse reflectance spectral measurements (Fig. 2E) of the bilayer membrane for a range of CB concentrations. Increased CB concentrations in the photothermal layer induce larger absorption coefficients in this region, resulting in more localized light absorption within this layer. The diffuse reflectance at 600 nm for membranes within a range of CB concentrations (Fig. 2F) shows a decreasing reflectance for increasing CB concentrations (top axis). Light transport simulations using the corresponding values of μa were performed for photothermal coatings of varying thicknesses of 25 ± 7 μm (SD) (Fig. 2F, shaded gray region). Agreement between the experimental diffuse reflectance measurements and the simulations provides an accurate relationship between the absorption coefficient, μa, and the concentration of CB NPs in the absorbing membrane layer at 600 nm. This combination of experimental measurements and theoretical simulations was extended across the visible spectrum (Fig. 2G), where data were obtained at 800, 600, and 400 nm and compared with theoretical simulations. The light absorption measurements and absorption coefficients obtained here were used to select an optimum CB concentration for the bilayer membrane (5.5 wt%). These values were used as input to a finite-element method (FEM)-based 3D model (COMSOL 5.2) developed to describe the coupled heat, fluid, and mass transfer processes in the NESMD system and in its comparison with MD (31, 32). Design flexibility and freedom in the choice of operational parameters allow analysis of NESMD and MD at different scales. This theoretical model is predictive and does not require calibration. Values of all of the physical parameters used in the simulations are obtained either from literature (14, 33) or experimental conditions (Supporting Information).
The NESMD system (Fig. 3A and Figs. S2 and S3) was tested outdoors in Houston, Texas (United States) (29.7604°N), where the measured average solar intensity was nominally 0.7 kW/m2 (Supporting Information). The active area of illumination was a 3.3 × 6.8-cm window exposing the feed side of the membrane. Both the feed and distillate reservoirs were immersed in an ice bath and the system was covered with reflective insulation; however, a 3–5 °C temperature difference remained between the feed and distillate inlets due to sunlight irradiation on the system and heat loss to the ambient environment. The NESMD system stabilized at slightly different feed and distillate temperatures (in the range of 14–20 °C), remaining constant to within ±1 °C throughout the measurements. Accounting for all photothermal and thermal factors, the distillate flux from the NESMD system has three contributions:
| [1] |
Here, is the total measured flux from the photothermal membrane with NPs upon illumination; is the flux due to localized heating by CB NPs; is the flux due to experimental temperature difference between the bulk feed and distillate streams; is the flux due to residual heating in the system upon illumination. To distinguish these different contributions we have performed specific measurements, as explained below.
Fig. 3.
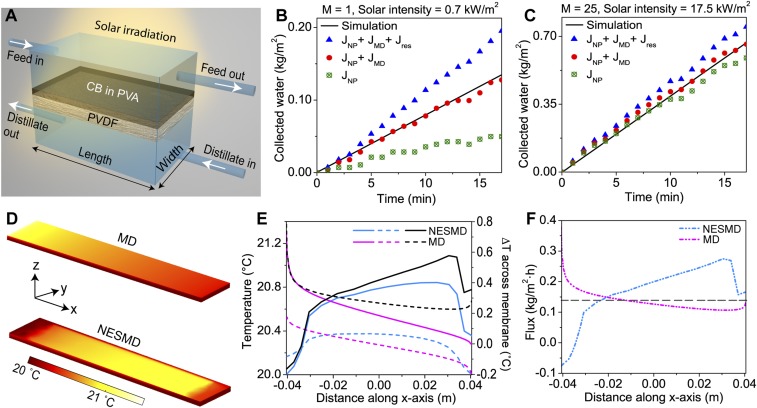
Comparison of outside solar experiments and for NESMD and MD. (A) Schematic of the NESMD module. (B) Purified water flux under unfocused illumination. (C) Flux obtained under 25× focused solar illumination. Blue triangles: experimental distillate flux JTotal. Black line: theory. Red circles: experimental flux minus measured the experimental flux from illuminated membrane without CB NPs (residual heating effects; JTotal − Jres). Green circles: experimental flux due only to localized photothermal heating; JNP = JTotal − Jres − JMD. (D) Calculated temperature distributions at the membrane surface for MD (Top) and NESMD (Bottom). The feed inlet temperature is 20 °C in NESMD and 21.3 °C in MD, corresponding to same input energy in NESMD (solar) and MD, with a distillate temperature of 20 °C for both processes. (E) Theoretical temperature profile at the feed (solid) and distillate (dotted) sides of the membrane for NESMD (blue) and MD (magenta) for same conditions as in D. Theoretical temperature drop (right axis) across the membrane (black) for NESMD (solid) and MD (dotted). (F) Calculated flux profile for NESMD at 0.7 kW/m2 solar illumination (dot-dashed blue) and MD (dot-dashed magenta) for temperatures specified in C. Dashed gray line: average flux.
Fig. S2.
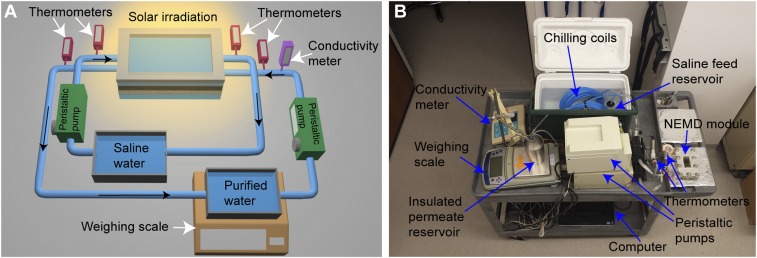
NESMD setup. (A) Schematic of the NESMD system. (B) Actual NESMD setup with different components of the system marked with arrows.
Fig. S3.
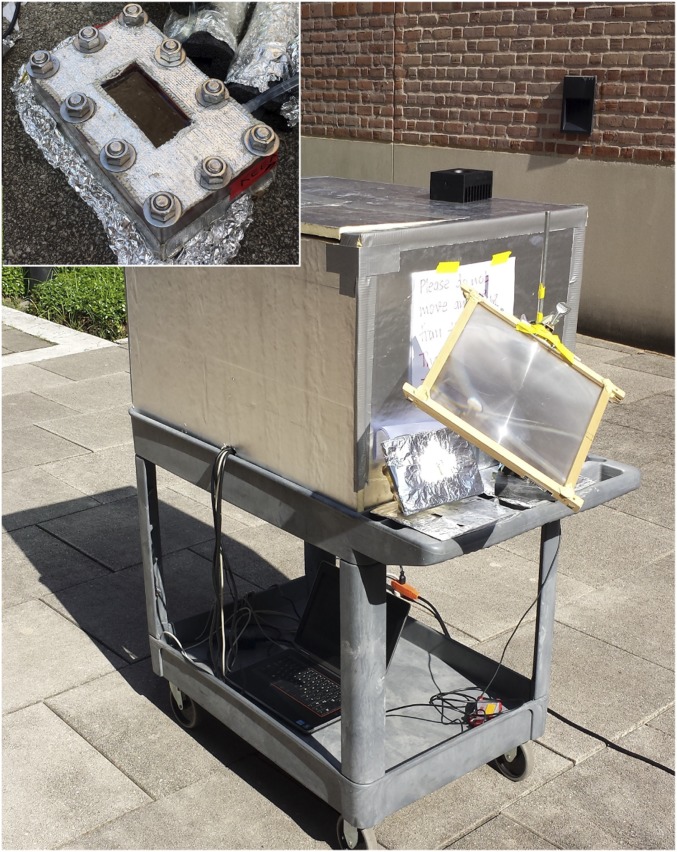
NESMD system physical setup on a cart with all components except NESMD module (Inset), Fresnel lens, power meter, and computer enclosed inside an insulating foam box. Inset shows NESMD module with CB NP-coated membrane (black region in the Middle) mounted inside.
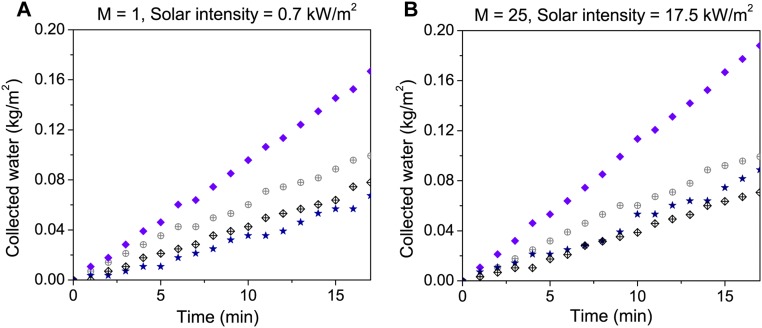
We obtain by measuring the distillate flux through the NESMD system upon illumination. It is shown with blue triangles in Fig. 3 B and C for no magnification, and for 25× magnification, respectively. The flux through the NESMD module without illumination gives us , as designated with hollow black diamonds in Fig. S4. To measure , we first performed measurements in exactly the same experimental setup using a control membrane containing no CB NPs. The flux from this membrane upon illumination comes from (shown with violet diamonds in Fig. S4). Second, we measure the flux through the same membrane without illumination to obtain only (shown with hollow gray circles in Fig. S4). The difference between these two fluxes gives (shown with navy-blue stars in Fig. S4 A and B for no magnification and 25× magnification, respectively). Subtracting alternatively and from gives us (solid red circles) and (hollow green circles), respectively. Both nonmagnified and 25× magnified cases are shown in Fig. 3 B and C, respectively. Although in the experiment the illumination area does not cover the whole device surface, all of the flux calculations here use the total module area to evaluate the contribution from each flux component. Upon quantification of each flux, the values of normalized to the illumination window areas compared with other fluxes are shown in Fig. S5.
Fig. S4.
Outside solar experiments to find the residual heating in the NESMD system. Solar experiments with membrane without CB NPs by covering the membrane (hollow gray circles) and by exposing it to sunlight (violet diamonds) at (A) unfocused and (B) 25× focused sunlight. By taking the difference between the two curves, we get the contribution to the flux through the membrane from residual heating effects (navy-blue stars) at (A) solar intensity of 0.7 kW/m2 and (B) at 25× magnification with resulting solar intensity of 17.5 kW/m2. Black hollow diamonds in A and B show flux for CB-coated membrane in the dark due to experimental temperature difference.
Fig. S5.
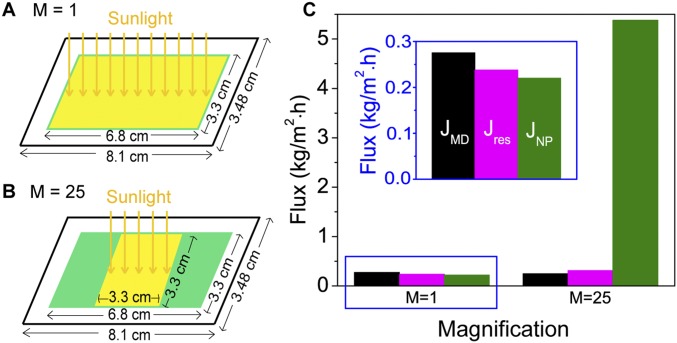
Normalized flux from the experimental NESMD module. (A) The area of illumination is equal to the window area at no solar magnification. (B) The area of illumination is smaller than the window area at 25× solar magnification. (C) The resulting normalized flux contribution from compared with , and with and without solar intensity magnification.
The purified water flux from saline feed water (with a salt rejection rate of >99.5%; Supporting Information) is shown for unfocused (Fig. 3B) and focused (Fig. 3C) illumination conditions and compared with our theoretical model for NESMD. For unfocused solar illumination (Fig. 3B), the experimental distillate flux exceeds theoretical predictions; however, there is good agreement between theoretical and experimental distillate flux once the contribution made by residual solar heating (Jres), not included in the model, is accounted for. In this low-intensity case, even the residual heating inherent in the system (JMD) (Fig. S4) contributes significantly to the experimental distillate flux; when this is also removed, we obtain the distillate flux due to localized CB NP heating alone (JNP). In contrast, for the case of 25× focused illumination (Fig. 3C), localized photothermal heating provides the dominant contribution to the distillate flux in this system.
The energy efficiency of NESMD is determined by evaluating the energy requirement of producing the distillate flux by localized photothermal heating (JNP) relative to the incident solar power. For the unfocused case, the photothermal distillate flux is 0.22 kg/(m2⋅h) (Fig. S5C). Given the water evaporation enthalpy of 2,454 kJ/kg (34), the minimum power needed to sustain this evaporation rate is 0.337 W. The total absorbed power through the illuminated area of the window (3.3 cm × 6.8 cm) is 1.571 W, corresponding to an efficiency of 21.45%. For 25× focusing (Fig. 3C), the solar distillation process is 21.0% efficient (assuming an illumination spot of 3.3 × 3.3 cm on the membrane, in agreement with experimental focusing geometry).
The accuracy of the theoretical model for NESMD allows us to examine the geometry and size-dependent aspects of this process, and to compare it to conventional MD. These studies reveal stark differences between the two processes. For example, the temperature along the length of the membrane is examined for both processes (Fig. 3 D and E). Here, we compare NESMD under unfocused illumination conditions with MD. In the MD case, a temperature difference of 1.33 °C between the feed and the distillate corresponds to the same power input as the illumination intensity for NESMD (1.57 W). The two processes have entirely different temperature profiles: for MD, where the feed is heated externally, the feed temperature is highest at the feed inlet, which is also the point of largest temperature difference between feed and distillate (Fig. 3E). In contrast, for NESMD, where the temperature difference between feed and distillate is generated by solar illumination, the feed temperature increases along the feed flow channel. In this case, the largest temperature difference is generated close to the feed outlet. The distillate flux generated along the flow channel follows this temperature dependence in both cases (Fig. 3F). From these results, we project that increasing the size of an NESMD unit should increase its distillate flux, in contrast to MD, where scale-up beyond a certain point would not correspond to an increased purified water output.
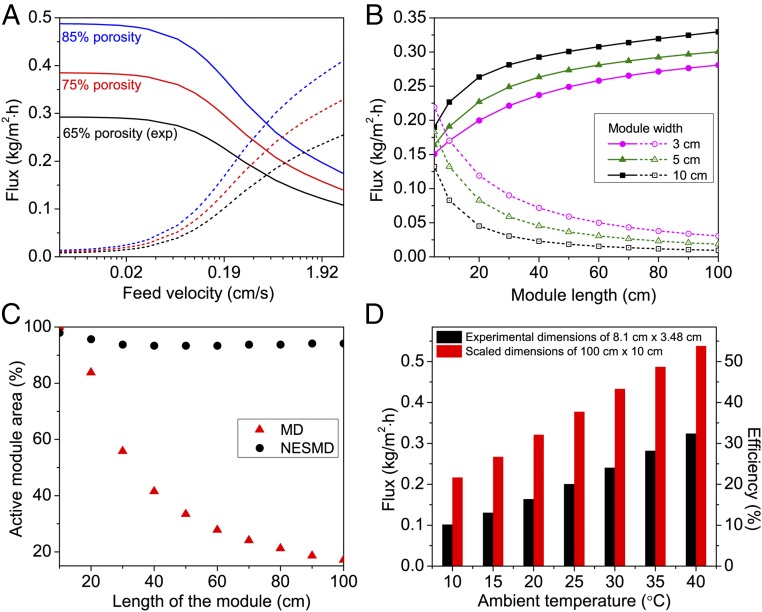
Further comparisons of NESMD and MD reveal additional opposing trends between the two processes. Another key parameter of purification systems is feed velocity. The calculated distillate fluxes for feed velocities ranging between 0.0032 cm/s (0.1 mL/min) and 3.2 cm/s (100 mL/min) in a bench-scale device (8.1 × 3.5 cm) for both unfocused NESMD and MD are shown in Fig. 4A. For simplicity, the illuminated area is now considered to be equal to the total area of the device. For NESMD, temperatures of the feed and distillate at the inlet are equal at 20 °C, and the velocity of the distillate is set to 136 mL/min (the experimental value). For MD, the distillate inlet temperature was the same, and the feed temperature was chosen to match the power input for NESMD. The dependence of distillate flux on feed flow velocity is opposite for NESMD and MD, although both methods provide more flux with lower membrane thermal conductivity and higher diffusion coefficient (corresponding to larger membrane porosity) (Fig. S6). NESMD is most efficient at lower feed flow rates, whereas MD flux is maximized only at higher flow rates. Both trends can be understood considering the temperature gradient across the membrane. For NESMD, slower feed velocities allow time for a larger temperature gradient to form between the feed and distillate sides of the membrane, resulting in a larger distillate flux. For MD, where the feed is heated before entry into the module, higher feed velocities reduce heat loss for the feed flow along the membrane. The efficient operation of the NESMD for modest flow velocities would be a significant advantage over MD in off-grid locations because solar-driven water pumps could be used. In addition, significantly less energy would be required for brine recirculation, which can be an important factor in the overall energy use of conventional MD (35).
Fig. 4.
Analysis of performance and scalability of NESMD. (A) Flux dependence on the feed velocity (log scale) for NESMD (solid lines) and MD (dashed lines) for different PVDF membrane porosities of 65% (black, equal to experimental value), 75% (red), and 85% (blue). Distillate flow is 136 mL/min (equal to the experimental value). All parameters are the same as in Fig. 3 except the illumination area, which is assumed here to be equal to the area of the device. (B) Flux dependence on cell length for NESMD (solid lines) and MD (dashed lines) for different cell widths: 3 cm (magenta), 5 cm (green), and 10 cm (black). (C) Active membrane area (area with positive temperature gradient across membrane) for lengths from 10 to 100 cm and a 10-cm width for NESMD (black circles) and MD (red triangles). (D) Flux dependence on ambient temperature (same temperature on feed and distillate side) for NESMD for two different cell sizes: 3.5 × 8.1 cm (black, same as experimental unit) and 10 × 100 cm (red). The feed flow is 17 mL/min, and the thermal conductivity of the membrane is taken from Fig. S6 for experimental porosity of 65%.
Fig. S6.
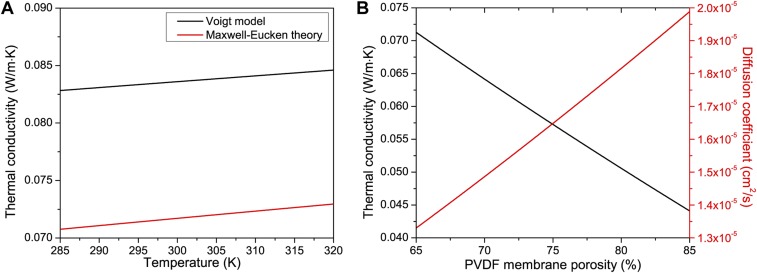
Variation of thermal conductivity with temperature and porosity. (A) Thermal conductivity change with temperature using the Voigt model (black) and Maxwell–Eucken theory (red) for the modeling of the layered system of photothermal PVDF membrane. (B) Effect of membrane porosity on its thermal conductivity and diffusion coefficient from Maxwell–Eucken theory.
We also observe striking differences between the average distillate flux for NESMD and MD as a function of module length and width (Fig. 4B), due to the differences in heat transfer between these two processes. The flux produced at larger lengths and widths increases in the NESMD case while decreasing to nearly zero for the largest membranes for MD at a fixed feed inlet temperature (21.67 °C, corresponding to the input power for the NESMD system under unfocused conditions). For the case of constant feed flow (17 mL/min, the experimental value), increasing the width of NESMD and MD corresponds to a reduction in flow velocity; thus, increasing the width of the system results in increased distillate flux for NESMD but decreased flux for MD (Fig. 4B). In MD, the increase in length increases the heat loss from feed to distillate side, resulting in a progressively reduced temperature difference across the membrane and thus lower fluxes. When the temperature difference between the feed and distillate sides of the membrane becomes negligible, the vapor transport vanishes and the effective fraction of active area of the device is reduced. In NESMD, however, the membrane remains active for longer module lengths (Fig. 4C and Fig. S7). A direct efficiency comparison of MD and NESMD shows that NESMD has consistently higher efficiencies than MD (Figs. S8 and S9) for the module lengths considered here (Supporting Information).
Fig. S7.
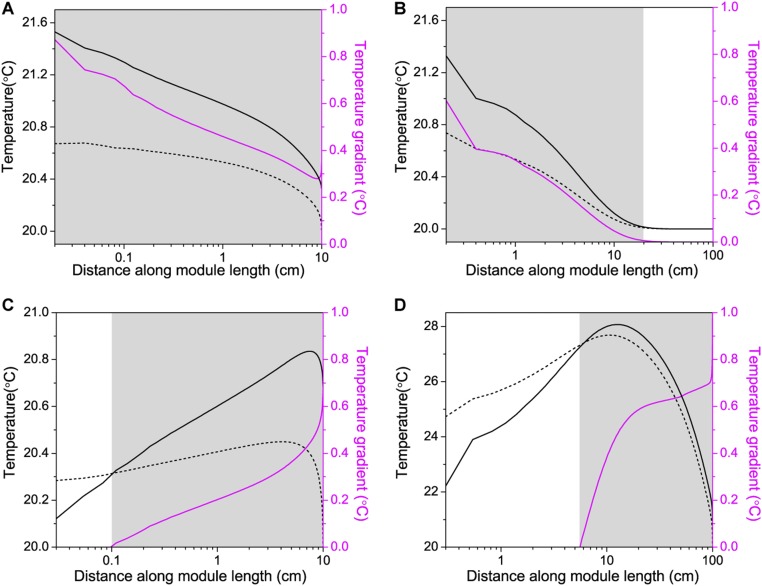
Analysis of active module area with NESMD and MD scale-up. The temperatures on Top (solid black line) and Bottom (dashed black line) of the PVDF membrane and the corresponding temperature gradient across the PVDF membrane with the module length (log scale) in MD module with dimensions of (A) 3 × 10 cm and (B) 10 × 100 cm and NEMD module with dimensions of (C) 3 × 10 cm and (D) 10 × 100 cm. The feed inlet temperature is 20 °C and distillate inlet temperature is 21.667 °C in both the MD modules, whereas the feed and distillate inlet temperature is 20 °C in both the NESMD modules. Active module area, where the temperature gradient across the membrane is positive, is shown with the shaded area in A–D.
Fig. S8.
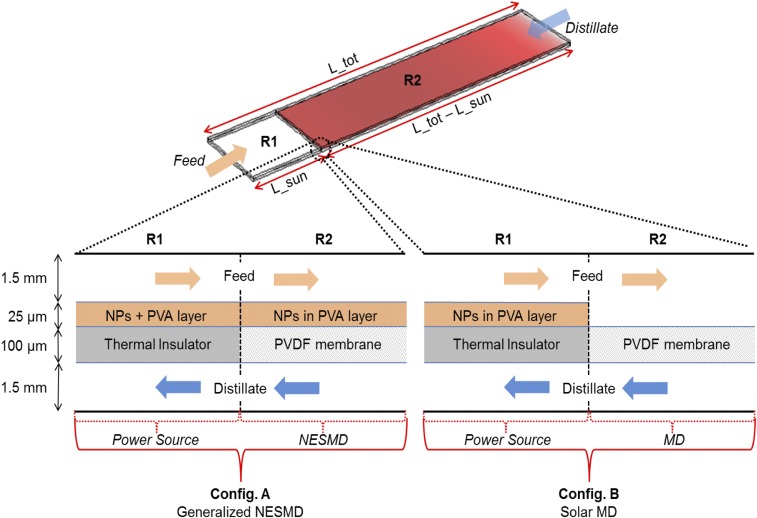
A generalized module that features two regions: R1 and R2. R1: Water molecules transport and heat conduction are not allowed. Heat to the feed is provided by the nanoparticles (NPs)-embedded PVA layer through light-to-heat conversion. This region is the same for configuration A and configuration B. R2: Evaporation and water molecules are allowed through the PVDF membrane. In configuration A, the PVA layer is also present to reproduce the NESMD working principle. In configuration B, there is no PVA layer to mimic a solar MD device where the input water must be preheated (in R1) before the evaporation–condensation process begins. In both configurations, ambient temperature is 20 °C, feed input is 17 mL/min, and distillate input is 136 mL/min as in the performed experiments.
Fig. S9.
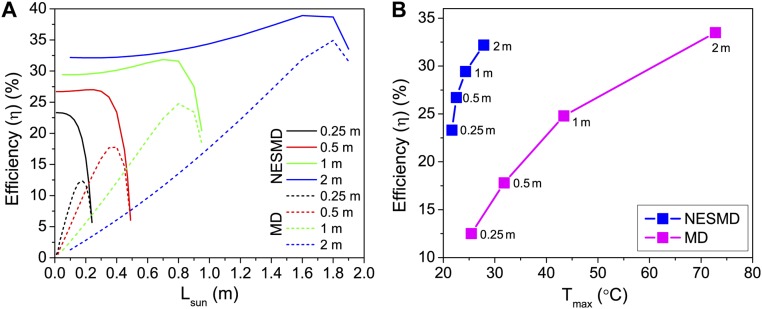
Efficiency variation with module length and maximum temperature for NESMD and MD. (A) Efficiency (η) dependence comparison between NESMD (solid lines) and MD (dashed lines) with power source extension (Lsun) for different module total lengths (Ltotal): 0.25, 0.5, 1, and 2 m. (B) Efficiency (η) dependence on the maximum temperature of water in the device for NESMD (with Lsun = 0 for all Ltotal, 0.25–2 m, from Left to Right) and MD (Lsun = 17.5, 35, 80, and 180 cm, for Ltotal = 0.25, 0.5, 1, and 2 m, respectively, from Left to Right).
Another important factor that influences NESMD performance is the ambient operating temperature (Fig. 4D and Fig. S10). Here, the flux dependence on ambient temperature is determined for both a bench-scale (black, 8.1 × 3.48 cm) and pilot-scale (red, 100 × 10 cm) device under unfocused conditions. The temperature difference between the feed and the distillate without illumination is zero in all cases. In both cases, the performance significantly improves (more than two times) when the ambient temperature is increased from 10 to 40 °C. Higher ambient temperatures also favor the larger-dimensioned system. At the highest temperature, the flux for the pilot-scale device is 0.55 kg/(m2⋅h), which corresponds to a solar energy efficiency of 53.8%. With peak temperatures of ∼35 °C, a water purification rate of ∼0.5 kg/(m2⋅h), and an active area of ∼1 × 1 m, an NESMD system without any form of heat recovery would produce ∼4 L/day under less than 1 sun (700 W/m2) illumination, with 8 h of sunlight in the summer. This production rate meets the basic drinking water requirements for two persons (36).
Fig. S10.
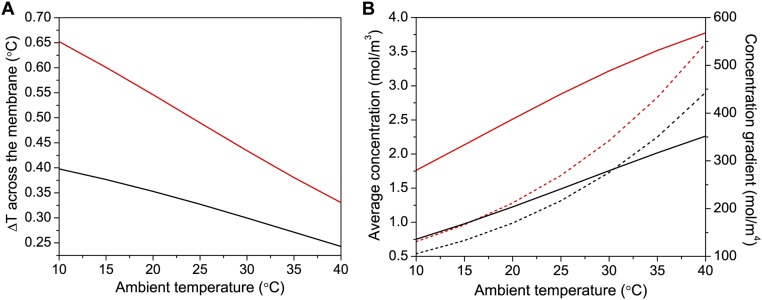
Analysis of temperature and concentration across the membrane with ambient temperature. (A) Temperature difference between the averages of the temperature of the membrane at the feed side and at the distillate side for experimental (black) and scaled (red) size of the module for varying input ambient temperatures. (B) Average concentration (dashed line) and concentration gradient (solid line) of water vapor in the Middle of the membrane for experimental (black) and scaled (red) size.
The performance of NESMD system can be further increased by incorporating heat recovery by recirculating feed output back to feed input. This recirculation not only will allow use of the heat lost in the form of the heated feed output of NESMD but also will increase the overall water recovery of the system by minimizing brine production from the system. This would increase the water flux and improve overall energy efficiency because the net energy consumption per unit volume of purified water produced will be reduced. Heat recovery mechanisms proposed for MD systems to use distillate heat generated from condensation and conductive heat transfer through the membrane via heat exchange to preheat the feed (37) should work equally well for NESMD. It should also be possible to use vacuum MD or air-gap MD geometry to minimize heating on the distillate side. In terms of thermodynamic performance limits, thermal processes such as NESMD operate further from the theoretical second law reversible limit than RO (38). However, the ability of NESMD to directly harness solar energy for desalination is favorable compared with the need to produce high-grade electrical energy for RO, which is limited by low-efficiency photovoltaic conversion when solar panels are used.
This discovery, the integration of photothermal heating capabilities within a water purification membrane for direct, solar-driven desalination, opens opportunities in water purification technologies. Unlike MD, NESMD benefits from increases in scale and in ambient operating temperatures, and requires only modest flow requirements for optimal distillate conversion. Further opportunities in developing light-harvesting capabilities, higher performance photothermal membranes, and flow geometries are likely to enhance performance even further. However, the NESMD system described here, which can be realized as a “solar desalination panel,” has direct, practical applications for scalable, solar-driven, and cost-effective desalination.
Materials and Methods
Fabrication of the Photothermal Membrane.
Before applying the photothermal coating, one side of the PVDF membrane was contacted with a 2 mg/mL dopamine hydrochloride (Sigma) solution in 0.1 M Tris⋅HCl (pH 8.5) for 15 min. The polydopamine layer formed aids in adhesion of the hydrophilic photothermal coating to the hydrophobic PVDF membrane. To prepare the electrospinning solution, functionalized CB NPs (Cabot Corporation) were first suspended in deionized water using probe sonication (Sonics Vibra-Cell; 35 W) for 10 min. Poly(vinyl alcohol), N-methyl-4(4′-formylstyryl)pyridinium methosulfate acetal (PVA-SbQ) (Polysciences) was then added to the suspension to yield a final PVA-SbQ concentration of 8.87%. The suspension was vortexed to evenly distribute the polymer and the CB. The CB concentration was varied from 0.1 to 1.0 wt% in the electrospinning solution, corresponding to 1.1–11 wt% in the PVA-SbQ polymer.
The electrospinning solution was loaded in a 3-mL syringe placed 10 cm away from the aluminum sheet metal collector plate, where the polydopamine-coated PVDF membrane was mounted. The syringe was advanced using a syringe pump (New Era Pump Systems; NE-1000) at the rate of 0.5 mL/min, and a 10-kV voltage was applied (Gamma High Voltage Research; ES50P-5W) between the syringe tip and the collector plate (39). After electrospinning for 3 h, the membrane was placed in a photoreactor (Luzchem; LZC-4V) equipped with 8 UV-A bulbs (Hitachi; FL8BL-B; peak emission at 352 nm) for 30 min to cross-link the styrylpyridinium groups (40). A beaker of water was placed inside the chamber to maintain the humidity level and prevent dehydration of the PVA.
Experimental Setup.
NESMD experiments were carried out using a custom-built membrane distillation module (Fig. S3) in direct-contact mode. A schematic of the system and the actual setup is shown in Fig. S2. The membrane module consists of a 1-mm-thick quartz window with dimensions of 3.3 × 6.8 cm on the feed side to allow sunlight illumination. Flow channel dimensions were 3.48 × 8.10 × 0.15 cm on both the feed and distillate sides. A 1-mm-thick polypropylene mesh spacer (McMaster; catalog no. 9265T49) was used on the distillate side, and a modified spacer with perpendicular mesh segments removed was used on the feed side to support the membrane while maintaining laminar flow. The cross-flow velocities in the feed and distillate channels were 0.54 cm/s (flow rate, 17 mL/min) and 4.34 cm/s (flow rate, 136 mL/min), respectively. The feed stream (saline stream) on the top of the membrane was a 1% NaCl (J. T. Baker) solution stored in a 500-mL Erlenmeyer flask, and deionized water (produced by a Barnstead E-Pure system and Milli-Q Integral; Millipore) was used for the distillate stream at the bottom of the membrane. We chose 1% salinity to mimic average salinity of brackish water, which is a main saline water supply used inland. To maintain stable temperatures on both sides of the membrane, the feed and distillate were cooled by 15-m-long chilling coils submerged in a shaded ice bath before entering the NESMD module. The feed and distillate were continuously circulated through the membrane module using peristaltic pumps (Masterflex L/S) in a countercurrent flow mode, where feed and distillate streams flow in opposite directions.
The insulated distillate reservoir was kept on a weighing balance (Denver Instruments; P402) connected to a computer equipped with data acquisition software (TAL Tech WinWedge). The increase in distillate mass was measured with the balance at 1-min intervals. A sketch of a vertical cross-section of the module is shown in Fig. 1B. An inline conductivity meter (Oakton pH/CON 510 series) was installed at the exit of the distillate channel to monitor the salinity of the distillate. Inlet and outlet temperatures for both the feed and distillate streams were measured using in-line thermometers (Traceable; no. 4351). For NEMD experiments with solar concentration, a 25.4 × 25.4 cm Fresnel lens was used to concentrate sunlight on the membrane surface by a factor of 25. The unconcentrated and concentrated solar intensities at the NESMD module surface were 0.7 and 17.5 kW·m−2, respectively (Thorlabs; S350C; Thermal Surface Absorber). We understand that the Fresnel lens used for solar concentration has optical losses; however, we use the incident power at the NESMD module surface as the input power for the efficiency calculations, as we are interested in the NESMD unit performance. All system components, except the membrane module, Fresnel lens, computer, and power meter were enclosed in an insulated box made of radiation barrier foam to prevent excessive solar heating of the system components (Fig. S3).
Salt Rejection Through the Membrane
Salt rejection is defined as the percent reduction in salinity between the distillate and the feed, calculated using the following:
where is the conductivity of the distillate, and is the conductivity of the feed. The conductivity of the distillate () was calculated using a mass balance on salt in the entire distillate loop:
where is the total mass distilled through the membrane, is the conductivity of the distillate, is the final mass of water in the distillate loop, is the corresponding final conductivity, is the initial mass of water in the distillate loop, and is the corresponding initial conductivity. Based on this mass balance, the distillate conductivity was 60 ± 30 μS/cm for these experiments. The initial conductivity of the 1% NaCl feed was 17,310 μS/cm, so the salt rejection was 99.7 ± 0.17%. As a result, the salt content of the distillate is around 50 ppm.
Finite-Element Method 3D Modeling
A finite-element method (FEM)-based 3D model was developed using a commercial software (COMSOL 5.2) to describe the coupled heat, fluid, and mass transfer processes in the NEMD system. The geometry and dimensions of the model system were kept the same as in the experimental setup. The model system is composed of four regions (domains): the feed channel (where salty or polluted water flows), the photothermal coating (containing light-absorbing NPs), the PVDF membrane, and the distillate channel (where water vapor condenses to form pure water). The porous photothermal coating is a gel with high water content; moreover, its thickness (25 µm) is much thinner than the overall channel (1.5 mm); therefore, only water properties are used for the channels (feed and distillate) and the PVA layer. Specific heat at constant pressure, , and density, , of the PVDF membrane, were calculated using an effective medium theory as a function of the membrane porosity (ε) and temperature (41):
| [S1] |
| [S2] |
where , (42), and (33), , and are the properties of PVDF and air, respectively.
Thermal conductivity, one of the key parameters of the system, was described using the Maxwell–Eucken approach (43):
| [S3] |
where (14).
The effective diffusion coefficient, , of water vapor was estimated by the Bruggeman correlation (44) for tortuosity () and porosity (, ):
| [S4] |
where temperature dependence of the diffusion coefficient of water in air, , can be found in ref. 45 (45). Such correlation holds for relatively large pore sizes (100–400 nm), and is applicable to the PVDF membrane (200-nm nominal pore size). Smaller pore dimensions (<2 nm) would require more specific approaches (46).
Three sets of equations are iteratively solved numerically to obtain the water vapor flux and temperature profile in the membrane module. Navier–Stokes and the continuity equations are solved in all of the regions except the PVDF membrane. The equations assume a single-phase fluid flow and, in their complete form, read as follows (47, 48):
| [S5] |
| [S6] |
| [S7] |
where and are the temperature-dependent density (in kilograms per cubic meter) and specific heat at constant pressure [joules/(kilogram⋅kelvin)] (49) of water respectively, u is the velocity vector (in meters per second), p is the pressure (in pascals), is the viscous stress (in pascals), F is the volume force vector (in newtons per cubic meter), T is the absolute temperature (in kelvin), q is the heat flux vector (in watts per square meter), Q represents the heat that will be later introduced (in watts per cubic meter), and S is the strain-rate tensor given by the following:
| [S8] |
The operation “:” denotes the contraction between tensors defined as follows:
| [S9] |
The constitutive relation to close the equation system (Eqs. S5–S8) is given, for a Newtonian fluid, by a linear relationship between stress and strain obtained by Stokes (50):
| [S10] |
Here, represents the dynamic viscosity (in pascals), which, for a Newtonian fluid, depends on the thermodynamic state only and not on the velocity field.
Within the PVDF membrane domain, the mass conservation equation is solved instead (47, 48):
| [S11] |
where c is the concentration of water vapor and is the modified diffusion coefficient defined above. Although in the current model convective mechanisms in the membrane are neglected (), we notice that further physical phenomena may be integrated by coupling Eq. S11 with Navier–Stokes equations through the velocity field .
Thermal transport equations are solved in all domains and read as follows:
| [S12] |
where is the heat flux by conduction, with being the thermal conductivity [watts/(meter⋅kelvin)] defined by for the membrane domain or water conductivity for the channels and the PVA layer (51, 52). Notice how Navier–Stokes equations are coupled to thermal transport equations through the velocity field , which is different from zero within the feed, the distillate, and the PVA domains.
The model also features a subdomain within the PVA layer, which accounts for the finite size of the transparent window through which the sun impinges on the NPs. Fig. 3A shows the schematic of the setup used for the modeling.
The heat generated by the CB NPs is represented, in the model, by an exponentially decreasing power dissipation density across the thickness of the active region of the PVA layer:
| [S13] |
where = 182 cm−1 is the experimentally determined absorption coefficient per weight percentage point () of CB NPs embedded in the PVA layer (Fig. S1B), M is the magnification factor related to the focusing lens (M = 1 when no lens is used), is the incident solar power intensity (0.7 kW/m2), which depends on weather conditions and was measured during each experiment, and represents the z coordinate of the photothermal coating surface. In the following section, a brief description of the calculation process and its underlying physics are described.
Initially, all domains are fixed at ambient temperature. Feed and distillate inlet surfaces, however, are set at the temperature used in the experiment, and Similarly, feed and distillate input velocities parallel to the device length and normal to the inlet surfaces are set to and , the cross-flow velocities used in the experiment. Depending on the experimental setup, feed and distillate flows can both be set in the same (cocurrent) or in opposite (countercurrent) directions. To replicate the low-feed and distillate velocities at the PVDF membrane surfaces, no-slip boundary conditions have been set. Therefore, at the membrane surfaces, the velocity of the fluid is zero (u = 0), and thus the fluid is not moving. This is a typical boundary condition for laminar flow, which is justified by the relatively low velocities of the fluxes used here. In fact, we can consider the Reynolds number for a flow in a pipe, , where (53) with being the height and , the width of the channel. Because , then . A back of the envelope calculation assuming , , and gives Re ∼ 30. Actual data extracted from the model depending on the case, confirm this approximation with lower values in the feed Re ∼ 10–50 than in the distillate Re ∼ 80–140 due to the larger fluid velocities used in the latter. Relatively low Reynolds numbers, especially in the feed where heat sources are present, are consistent with a laminar flow approximation and no-slip boundary conditions. Larger velocities or rougher surfaces would, however, require the turbulent regime to be fully taken into account.
The PVDF membrane domain is governed by diffusion equations. At the membrane surfaces (parallel to the channels), an initial concentration of is set. Here, is the chosen initial relative humidity, is the maximum amount of water for 100% humidity at 20 °C, and is the molar mass of water.
When the calculation starts, the heat generated in the PVA layer increases the temperature of the nearby domains. In particular, the feed flow increases its temperature close to the PVDF membrane and increases its water vapor concentration at the feed channel–PVDF membrane interface given by the following:
| [S14] |
where is the temperature-dependent saturation pressure of water. The now-increased vapor pressure at the feed side induces a concentration gradient across the membrane, and diffusion equations (within the COMSOL Transport of Diluted Species module framework) are then solved using the diffusion coefficient introduced before, . Latent heat transfer due to water vapor transport through the membrane is accounted for by placing two opposite boundary heat sources on the PVDF membrane surfaces:
| [S15] |
where is water enthalpy of evaporation and is the computed molar flux with units of moles per square meter⋅second.
Simulations can be performed both in stationary or time-dependent regimes. In the latter case, the mass of fresh water produced over time, Wtime (in kilograms) (which can be directly compared with experimental results) can be calculated as follows:
| [S16] |
where the first integral takes into account the increase of fresh water over time and the second double integral accounts for the total water produced over the whole device PVDF membrane area (). In stationary regime, the rate of water production Wrate (in kilograms per second) can be evaluated instead as follows:
| [S17] |
Another useful parameter that can be calculated is the fresh water rate normalized by the area, that is, the effective flux J (in kilograms per square meter⋅second), which is simply given by the following:
| [S18] |
Finally, to estimate the overall device efficiency , it is possible to relate the solar input energy and the effective generated vapor flux as follows:
| [S19] |
where is the active area of the PVDF membrane surface, meaning the portion of the membrane corresponding to the transparent window illuminated by solar radiation. If the window represents 100% of the device-exposed surface, then , where is the total area of the membrane.
This parameter is important because it establishes what fraction of the available energy is actually converted into vapor. Because current experiments (and thus models) do not feature heat recovery, assuming a very good insulation of the device (in the model the external surfaces of the device are thermally insulated), is due to two mechanisms. First, a portion of input energy is lost within the flowing feed itself: the flow increases its temperature, but the heat does not contribute to evaporation and simply leaves the device as thermal energy of the feed outflow. Second, the nonzero thermal conductivity of the PVDF membrane allows for heat to be conductively lost through the membrane, and thus the available energy for evaporation is reduced.
Regarding the practical design of the device, symmetry with respect to the XZ plane is adopted to compute only one-half of the total mesh elements of the model.
It is worth mentioning that all of the computed variables within the models are space dependent. The present calculation approach allows for flexibility both from a physical and from a geometrical point of view. That is, further equations may be introduced to account for additional relevant effects, which can be added in future experimental conditions, and the shape and dimensions of the model may be tailored to meet the designer’s objectives.
Selection of CB NP Concentration for NESMD Application
Using the absorption coefficients, μa, obtained from optical characterization of photothermal membranes in the COMSOL modeling of the NESMD system, we obtain the average temperature at the surface of the PVDF membrane with varying CB NP concentrations in the PVA for feed and distillate inlet temperature of 20 °C as shown in Fig. S1A. The concentration corresponding to photon absorption maps simulated with Monte Carlo simulation in Fig. 2B (1.1 wt%), Fig. 2C (5.5 wt%), and Fig. 2D (11 wt%) are marked with dashed lines in Fig. S1A. As it can be seen from Fig. 2G, the absorption coefficient of the photothermal membrane varies with the wavelength. To obtain a value of absorption coefficient for 5.5 wt% CB NP concentration used in the experiments, we take the average of experimental reflectance values over the solar spectral irradiance (54) in the range from 400 to 800 nm. We then use Fig. 2G to adopt the absorption coefficient corresponding to the average reflectance value. For 5.5 wt% CB NP concentration, we get an absorption coefficient of 1,000 cm−1, which corresponds to ∼182 cm−1/wt%.
Lower concentrations of CB in PVA absorb less sunlight and thus produce less heat. At very high (>20 wt%) CB NP concentrations, most of the sunlight is absorbed in the light-absorbing layer; however, the absorption occurs on top of the PVA layer, away from the PVDF membrane surface (as it can be seen in photon absorption map in Fig. 2D). At optimal concentration, most of the sunlight gets absorbed in the PVA layer and it produces a temperature increase near the surface of the PVDF membrane, which is desired to get a higher temperature gradient across the membrane. At concentrations higher than 5.5 wt%, we observed that the electrospun fibers contained NP beading, leading to nonuniform electrospinning. Thus, we decided to work with 5.5 wt% CB NP concentration in photothermal membrane.
Portable NESMD System
As it can be seen in Fig. S2, all of the components of the NESMD system—NESMD module (Fig. S3, Inset), feed and distillate reservoirs, digital thermometers, conductivity meter, peristaltic pumps, computer, chilling coils, power meter, etc.—were placed on a cart. We brought this cart outside (Fig. S3) to perform the solar experiments shown in Fig. 3.
To measure the residual heating in the membrane, we performed measurements with PVDF membrane electrospun with PVA without any CB NPs as shown in Fig. S4. The flux obtained by covering this membrane gives the contribution from the experimental temperature difference across the membrane, . When this membrane is exposed to sunlight, we find the flux due to system temperature difference and the residual heating in the system, . The temperature difference at the feed and distillate inputs, monitored with digital thermometers, do not change more than ±1 °C during the course of this experiment. The difference of the flux between uncovered and covered membrane gives us the flux due to residual heating, . We use the value obtained at M = 1 in Fig. S4A in Fig. 3B and that obtained at M = 25 in Fig. S4B in Fig. 3C. The flux obtained by covering CB-laden photothermal membrane gives the contribution from the experimental temperature difference across the membrane, . This is used to take out the contribution of from total flux from Fig. S4A in Fig. 3B and at M = 25 from Fig. S4B in Fig. 3C.
Effect of Membrane Porosity on Thermal Conductivity and Diffusion
Modeling results demonstrate how increasing membrane porosity reduces the thermal conductivity of the membrane and increases the diffusion coefficient of the membrane. This reduction in thermal conductivity increases the temperature gradient across the membrane and increases the diffusion coefficient, resulting in increases in flux through the membrane. Thus, increasing porosity of the membrane (Fig. S6) will improve the performance of both NESMD and MD system as seen in Fig. 4A.
Linear Increase in NESMD Flux and Efficiency with Ambient Temperature
The increase of flux (and efficiency) with (shown in Fig. 4D) can be expected if we consider how the concentration () of water vapor depends on temperature. We have that , where is the saturation pressure of water, and it is known to depend exponentially on temperature (55). R is the ideal gas constant. Fig. S10B shows concentrations c for the experimental (black) and scaled device (red) with their dependence on (dashed lines). As expected, the trend is exponential. As concentration increases exponentially, one would expect flux and efficiency to follow the same behavior. However, from Fig. 4D, we observe a fairly linear trend in both cases. This apparent mismatch can be explained by calculating the actual temperature gradient across the membrane, as reported in Fig. S10A. Here, it is shown that for higher , the temperature drop across the membrane is lower. Therefore, although it is true that c grows exponentially with temperature, the temperature difference across the membrane, which drives molecular diffusion, drops linearly with (Fig. S10A). The net result is a linearly increasing flux across the membrane. This result is shown in Fig. S10B, where concentration gradients in the z direction for the two device dimensions, experimental (black) and scaled device (red), are plotted with respect to (solid lines), showing a linear trend. Thus, although the concentration increases exponentially (on both sides of the membrane), the concentration gradient has a linear dependence on ambient temperature due to a decreasing temperature difference across the membrane. Therefore, operating NESMD module at elevated ambient temperatures will increase the device performance with both the feed and distillate inlet temperatures being at .
Performance of NESMD and MD with Increasing Module Size
We analyzed the performance of the NESMD and MD with increasing module size using theoretical FEM modeling. If we plot the temperature at the top and bottom of the PVDF membrane in the NESMD (Fig. S7C) and MD (Fig. S7A) modules for the same size of 3 × 10 cm, we observe that the temperature gradient across the PVDF membrane decreases with length across the module in MD (Fig. S7A), whereas it increases with length in NESMD (Fig. S7C). A Similar trend is observed for larger dimensions of 10 × 100 cm for MD (Fig. S7B) and NESMD (Fig. S7D). When the temperature gradient across the membrane is positive, that is, when the feed temperature is higher than the distillate temperature, we get positive flux across the membrane with water evaporating from the feed and condensing in the distillate. Thus, we can consider the active area of the membrane as the region where the temperature gradient is positive (shown as gray area in Fig. S7). Calculating the percentage of active area for a module with fixed width of 10 cm and length varying from 10 to 100 cm in steps of 10 cm, we get more than 94% active area for NESMD at each length (black circles in Fig. 4C), and exponentially dropping active area for MD at longer lengths (red triangles in Fig. 4C).
Flux Through the NESMD Module
Total area of the NESMD module is 8.1 × 3.48 cm. However, the area of illumination is 6.8 × 3.3 cm in the case of no solar magnification, and 3.3 × 3.3 cm with 25× solar magnification. When we analyzed the fluxes from different components , , and in the main text, the total module area of 8.1 × 3.48 cm was considered. However, to accurately evaluate the effect of the CB NPs, only the area of illumination should be considered because mainly that area is giving the resulting distillate flux. Thus, is normalized by the illumination area and compared with JMD and Jres in Fig. S5. Here, we can clearly see that the contribution of to the total flux significantly increases with magnification.
NESMD and MD Efficiency Comparison
A direct comparison between NESMD and MD systems is difficult for two main reasons. First, MD did not find wide-scale commercial applications yet and standardized performance data are still missing. Second, even if several MD configurations have been proposed, the values of the corresponding efficiency parameters [e.g., gain output ratio (GOR), energy consumption (EC), or water production cost (WPC)] can vary substantially and even span more than three orders of magnitude (for EC and WPC in particular) depending on assumptions and the considered system (56). Briefly, GOR measures the overall energy efficiency of a system, and it can be defined as follows:
| [S20] |
where is the enthalpy of vaporization, is the distillate production rate, and is the power input of the system. This definition of efficiency is quite general and it has been used in the rest of the work (reported as ) to establish NESMD energy efficiency. EC is the specific energy consumption and relates the energy input to the production of 1 m3 of distillate. Depending on the particular desalination system, recirculation and heat recovery techniques, EC values can range from 1 to 9,000 kWh/m3 (56). WPC is expressed in dollars per cubic meter and expresses the total costs associated to the production of a given quantity of fresh water. Depending on the chosen technology, considered energy source, components, and cost reporting methods, values range from 0.3 to 130 $/m3 (56). Additional parameters have been recently proposed to evaluate MD efficiency. For example, it has been shown how GOR can be further decomposed in thermal efficiency () and effectiveness () as (57):
| [S21] |
where compares the distillate enthalpy change to its maximum possible value and is defined as follows (57):
| [S22] |
Although these additional parameters can be useful to evaluate conventional MD performance, especially when heat recovery is considered, they are not suitable for our system. In fact, alone would diverge in NESMD which works at ambient temperature and has .
As consequence, we decided to compare NESMD and MD configurations by considering the amount of water that can be produced from each module for the same footprint, that is, a given available surface.
Having available surface and input energy intensity (sun irradiation at 0.7 kW/m2) as the only external parameters, allows us to fairly compare the two systems at their core working-principle level and without the need to consider any accessory technology or equipment (e.g., pumps, light collectors, heat exchangers, etc.). This comparison approach is also consistent with the proposed employment of NESMD in rural areas, remote zones, or poor regions where the transport and construction of bulky and costly devices could be difficult to achieve.
In Fig. S8, we report the scheme of the device used to compare NESMD and MD processes. Feed and distillate are in countercurrent configuration and enter a module with length Ltotal and fixed width of 5 cm. The feed enters the device in the first region (R1), which extends for a length Lsun and allows water heating but not evaporation. In fact, a nonporous thermal insulator is considered between the NPs+PVA layer and the distillate channel. Afterward, the feed proceeds to the second region (R2), which depends on the chosen configuration. In configuration A, R2 reproduces exactly an NESMD module: heating and evaporation happen in parallel while the feed flows along the system. In configuration B, R2 allows for evaporation but not water heating (the NPs+PVA layer is not present), thus emulating the process of a MD module. In this sense, R2 regions, in both configurations, are the operative sections of either NESMD or MD technologies, that is, they represent the regions where the water purification process (evaporation plus condensation) takes place. On the other hand, R1 regions can be considered as pure power source regions where available energy (sun irradiation) is converted into heat by means of an efficient, cheap, and optics-free method (light-to-heat conversion in the NPs+PVA layer). We emphasize that the choice of this light-to-heat conversion method does not lead to any loss of generality because it places MD and NESMD on the same level where a continuous flux of water can be provided to the system without the need of salty/polluted water reservoirs and solar collectors. We can therefore consider configuration A as a generalized version of NESMD where the power source region (R1) is added to the conventional NEMSD module (R2) so that a direct comparison can be carried out with a solar powered MD system, configuration B, that, unlike NESMD, requires a dedicated power source area (R1) before water purification can begin (R2).
We will now vary the extension of R1 in both configurations to identify the role played by the power source zone in the generalized NESMD and solar MD.
In Fig. S9A, we plot the efficiency (η), calculated as in Eq. S20 with (, ), depending on the size of the power source region R1 for configuration A and configuration B at four different total lengths (Ltotal = 0.25, 0.5, 1, and 2 m). Even if NESMD does not strictly require a power source only region (light can be converted to heat in R2 as well), the purpose is to compare NESMD and MD in the same conditions.
Interestingly, we find that both processes can be optimized to yield a maximum efficiency at specific Lsun values, which approach the total device length for increasing Ltotal. However, there is a major difference between NESMD and MD. In NESMD, as mentioned, the whole device area is dedicated to both heat generation and water evaporation: even for shorter Lsun values, the purification process is sustained and the efficiency saturates at constant values at Lsun = 0. In MD, a vanishing Lsun translates into an absence of power input, and thus the efficiency diminishes and goes to zero for Lsun = 0. For both NESMD and MD, the efficiency reaches zero in the case Lsun ∼ Ltotal because no room for evaporation would be left. From Fig. S9A, it is evident how, for the same footprint, NESMD efficiency is always higher than MD efficiency. Also, in Fig. S9A, a trend can be observed: for longer modules (increasing Ltotal), the MD efficiency moves close to the NESMD efficiency if Lsun is optimized. Intuitively, we can understand this trend as follows: while in R1, the feed flux absorbs heat and its temperature keeps increasing; because a higher temperature at the beginning of R2 favors the evaporation process (distillate inlet is at ambient temperature), an efficiency maximum exists when the temperature gain in R1 balances a shorter evaporation region in R2. One may think to extend this concept to much longer modules, but in that limit very high temperatures would be reached and the water boiling point would constitute a limit, especially in simple devices that run at ambient pressure.
In Fig. S9B, we compare the efficiencies between “pure” NESMD (Lsun = 0 for every Ltotal) and an optimized MD system (specific Lsun for each Ltotal), depending on the maximum temperature reached, for modules of total length from 0.25 to 2 m. Remarkably, NESMD features efficiencies up to 30% while keeping the module at a maximum temperature below 30 °C. Similar efficiencies are achieved by MD systems only at much higher temperatures: for the 2-m case, an efficiency of about ∼32% is reached when the temperature at the end of the R1 region is ∼73 °C.
In these calculations, we considered the modules to be thermally insulated from the ambient. Nonideal insulators would decrease the actual device efficiency, especially in the case of warmer fluids. This fact, in addition to the practical convenience of maintaining near-ambient temperature water, points to NESMD as a viable technology that can be implemented straightforwardly in a low-tech environment.
To conclude, we compared NESMD and MD by considering, for both cases, the same footprint, that is, available surface and input power source (solar irradiation). We found that NESMD has a higher efficiency than MD for modules with lengths up to 2 m. Even if it is true that the total input power of NESMD is constant, whereas, in the MD case, it would depend on the dimension of R1, it is found that, for similar efficiencies, MD requires much higher temperatures. In particular for longer modules, MD can be optimized only at increasing Lsun/Ltotal ratios. This means that for larger-scale systems, the total input power for NESMD and MD also becomes similar, whereas NESMD can achieve the same efficiency at much lower temperatures.
Acknowledgments
This work was funded by the Nanoscale Science and Engineering Initiative of the NSF under NSF Award EEC-1449500, Air Force Office of Scientific Research Grant FA9550-15-1-0022, Robert A. Welch Foundation Grants C-1220 and C-1222, and J. Evans Attwell–Welch Fellowship L-C-0004.
Footnotes
Conflict of interest statement: A patent was filed on the NESMD process. This patent is pending.
This article contains supporting information online at www.pnas.org/lookup/suppl/doi:10.1073/pnas.1701835114/-/DCSupplemental.
References
- 1.Mekonnen MM, Hoekstra AY. Four billion people facing severe water scarcity. Sci Adv. 2016;2:e1500323. doi: 10.1126/sciadv.1500323. [DOI] [PMC free article] [PubMed] [Google Scholar]
- 2.Service RF. Desalination freshens up. Science. 2006;313:1088–1090. doi: 10.1126/science.313.5790.1088. [DOI] [PubMed] [Google Scholar]
- 3.Elimelech M, Phillip WA. The future of seawater desalination: Energy, technology, and the environment. Science. 2011;333:712–717. doi: 10.1126/science.1200488. [DOI] [PubMed] [Google Scholar]
- 4.Werber JR, Osuji CO, Elimelech M. Materials for next-generation desalination and water purification membranes. Nat Rev Mater. 2016;1:16018. [Google Scholar]
- 5.Bennett A. 50th Anniversary: Desalination: 50 years of progress. Filtr Sep. 2013;50:32–39. [Google Scholar]
- 6.Anonymous IDA World Congress: Desalination market grows to meet global water needs. Filtr Separat. 2011;48:28–30. [Google Scholar]
- 7.Ghaffour N, Missimer TM, Amy GL. Technical review and evaluation of the economics of water desalination: Current and future challenges for better water supply sustainability. Desalination. 2013;309:197–207. [Google Scholar]
- 8.Lapuente E. Full cost in desalination. A case study of the Segura River Basin. Desalination. 2012;300:40–45. [Google Scholar]
- 9.Miller JE. 2003. Review of Water Resources and Desalination Technologies (Sandia National Laboratory, Albuquerque, NM), Report SAND2003-0800, pp 3–54.
- 10.Renewable I, Agency E. Water Desalination Using Renewable Energy. International Renewable Energy Agency, Masdar City; Abu Dhabi, United Arab Emirates: 2012. [Google Scholar]
- 11.Lawson KW, Lloyd DR. Membrane distillation. J Membr Sci. 1997;124:1–25. [Google Scholar]
- 12.Cath TY, Adams VD, Childress AE. Experimental study of desalination using direct contact membrane distillation: A new approach to flux enhancement. J Membr Sci. 2004;228:5–16. [Google Scholar]
- 13.Alkhudhiri A, Darwish N, Hilal N. Membrane distillation: A comprehensive review. Desalination. 2012;287:2–18. [Google Scholar]
- 14.Gryta M. Effectiveness of water desalination by membrane distillation process. Membranes (Basel) 2012;2:415–429. doi: 10.3390/membranes2030415. [DOI] [PMC free article] [PubMed] [Google Scholar]
- 15.Camacho LM, et al. Advances in membrane distillation for water desalination and purification applications. Water. 2013;5:94–196. [Google Scholar]
- 16.Goh PS, Matsuura T, Ismail AF, Hilal N. Recent trends in membranes and membrane processes for desalination. Desalination. 2016;391:43–60. [Google Scholar]
- 17.Koschikowski J, Wieghaus M, Rommel M. Solar thermal driven desalination plants based on membrane distillation. Water Sci Technol Water Supply. 2003;3:49–55. [Google Scholar]
- 18.Ding Z, Liu L, El-Bourawi MS, Ma R. Analysis of a solar-powered membrane distillation system. Desalination. 2005;172:27–40. [Google Scholar]
- 19.Mathioulakis E, Belessiotis V, Delyannis E. Desalination by using alternative energy: Review and state-of-the-art. Desalination. 2007;203:346–365. [Google Scholar]
- 20.Chang H, Wang GB, Chen YH, Li CC, Chang CL. Modeling and optimization of a solar driven membrane distillation desalination system. Renew Energy. 2010;35:2714–2722. [Google Scholar]
- 21.Qtaishat MR, Banat F. Desalination by solar powered membrane distillation systems. Desalination. 2013;308:186–197. [Google Scholar]
- 22.Hausmann A, Sanciolo P, Vasiljevic T, Weeks M, Duke M. Integration of membrane distillation into heat paths of industrial processes. Chem Eng J. 2012;211–212:378–387. [Google Scholar]
- 23.Chen TC, Ho CD. Immediate assisted solar direct contact membrane distillation in saline water desalination. J Membr Sci. 2010;358:122–130. [Google Scholar]
- 24.Politano A, et al. Photothermal membrane distillation for seawater desalination. Adv Mater. 2017;29:1603504. doi: 10.1002/adma.201603504. [DOI] [PubMed] [Google Scholar]
- 25.Summers EK, Lienhard V JH. A novel solar-driven air gap membrane distillation system. Desalination Water Treat. 2013;51:1344–1351. [Google Scholar]
- 26.Summers EK, Lienhard V JH. Experimental study of thermal performance in air gap membrane distillation systems, including the direct solar heating of membranes. Desalination. 2013;330:100–111. [Google Scholar]
- 27.Hogan NJ, et al. Nanoparticles heat through light localization. Nano Lett. 2014;14:4640–4645. doi: 10.1021/nl5016975. [DOI] [PubMed] [Google Scholar]
- 28.Neumann O, et al. Solar vapor generation enabled by nanoparticles. ACS Nano. 2013;7:42–49. doi: 10.1021/nn304948h. [DOI] [PubMed] [Google Scholar]
- 29.Ghasemi H, et al. Solar steam generation by heat localization. Nat Commun. 2014;5:4449. doi: 10.1038/ncomms5449. [DOI] [PubMed] [Google Scholar]
- 30.Zhou L, et al. 3D self-assembly of aluminium nanoparticles for plasmon-enhanced solar desalination. Nat Photonics. 2016;10:393–398. [Google Scholar]
- 31.Tahvildari K, et al. Modeling and simulation of membrane separation process using computational fluid dynamics. Arab J Chem. 2016;9:72–78. [Google Scholar]
- 32.Shirazi MMA, Kargari A, Ismail AF, Matsuura T. Computational fluid dynamic (CFD) opportunities applied to the membrane distillation process: State-of-the-art and perspectives. Desalination. 2016;377:73–90. [Google Scholar]
- 33.Stephan K, Laesecke A. The thermal conductivity of fluid air. J Phys Chem Ref Data. 1985;14:227–234. [Google Scholar]
- 34.Woodward FI, Sheely JE. Principles and Measurements in Environmental Biology. Butterworth-Heinemann Ltd; London: 1983. [Google Scholar]
- 35.Zou S, Yuan H, Childress A, He Z. Energy consumption by recirculation: A missing parameter when evaluating forward osmosis. Environ Sci Technol. 2016;50:6827–6829. doi: 10.1021/acs.est.6b02849. [DOI] [PubMed] [Google Scholar]
- 36.Gleick P. Basic water requirements for human activities: Meeting basic needs. Water Int. 1996;21:83–92. [Google Scholar]
- 37.Lin S, Yip NY, Elimelech M. Direct contact membrane distillation with heat recovery: Thermodynamic insights from module scale modeling. J Membr Sci. 2014;453:498–515. [Google Scholar]
- 38.Mistry KH, et al. Entropy generation analysis of desalination technologies. Entropy. 2011;13:1829–1864. [Google Scholar]
- 39.Liu Y, Bolger B, Cahill PA, McGuinness GB. Water resistance of photocrosslinked polyvinyl alcohol based fibers. Mater Lett. 2009;63:419–421. [Google Scholar]
- 40.Ichimura K. Photocrosslinking behavior of poly (vinyl alcohol)s with pendent styrylpyridinium or styrylquinolinium groups. Makromol Chem. 1987;188:2973–2982. [Google Scholar]
- 41.Wang XQ, Mujumdar AS. A review on nanofluids—Part I: Theoretical and numerical investigations. Braz J Chem Eng. 2008;25:613–630. [Google Scholar]
- 42.Buonomenna MG, et al. New PVDF membranes: The effect of plasma surface modification on retention in nanofiltration of aqueous solution containing organic compounds. Water Res. 2007;41:4309–4316. doi: 10.1016/j.watres.2007.06.033. [DOI] [PubMed] [Google Scholar]
- 43.Wang M, Pan N. Predictions of effective physical properties of complex multiphase materials. Mater Sci Eng Rep. 2008;63:1–30. [Google Scholar]
- 44.Tjaden B, Cooper SJ, Brett DJ, Kramer D, Shearing PR. On the origin and application of the Bruggeman correlation for analysing transport phenomena in electrochemical systems. Curr Opin Chem Eng. 2016;12:44–51. [Google Scholar]
- 45.Marrero TR, Mason EA. Gaseous diffusion coefficients. J Phys Chem Ref Data. 1972;1:3–118. [Google Scholar]
- 46.Fasano M, et al. Interplay between hydrophilicity and surface barriers on water transport in zeolite membranes. Nat Commun. 2016;7:12762. doi: 10.1038/ncomms12762. [DOI] [PMC free article] [PubMed] [Google Scholar]
- 47.Comsol . Heat Transfer Module. COMSOL AB, Stockholm; Sweden: 2015. pp. 1–222. [Google Scholar]
- 48.Comsol . CFD Module User’s Guide. COMSOL AB, Stockholm; Sweden: 2015. [Google Scholar]
- 49.Griffiths E. International critical tables of numerical data physics, chemistry and technology. Nature. 1927;119:735–738. [Google Scholar]
- 50.Stokes GG. On the theories of the internal friction of fluids in motion, and of the equilibrium and motion of elastic solids. Trans Cambridge Philos Soc. 1845;8:287–319. [Google Scholar]
- 51.Ross RG, Andersson P, Backstrom G. Thermal conductivity of nine solid phases of water. High Temp High Press. 1977;9:87–96. [Google Scholar]
- 52.Childs GE, Ericks LJ, Powell RL. Thermal conductivity of solids at room temperature and below: A review and compilation of the literature. 1973 Available at digital.library.unt.edu/ark:/67531/metadc13173. Accessed May 31, 2017.
- 53.Fox RW, McDonald AT, Pritchard PJ. Introduction to Fluid Mechanics. 6th Ed Wiley; New York: 2004. [Google Scholar]
- 54.ASTM International . ASTM G173-03 - Standard Tables for Reference Solar Spectral Irradiances: Direct Normal and Hemispherical on 37° Tilted Surface. ASTM International; West Conshohocken, PA: 2012. [Google Scholar]
- 55.Deacon EL. Principles of environmental physics. Agric Meteorol. 1974;13:429–430. [Google Scholar]
- 56.Khayet M. Solar desalination by membrane distillation: Dispersion in energy consumption analysis and water production costs (a review) Desalination. 2013;308:89–101. [Google Scholar]
- 57.Swaminathan J, Chung HW, Warsinger DM, Lienhard V JH. Membrane distillation model based on heat exchanger theory and configuration comparison. Appl Energy. 2016;184:491–505. [Google Scholar]


