Significance
Phosphatidylinositol 3-kinase (PI3K) pathway hyperactivation is a common event in cancer, and understanding alterations in this pathway is critical. Recently, the p85 regulatory subunit of PI3K has come into focus as a novel pathway component targeted in cancers. We find that decreased p85α contributes to transformation of in vitro and in vivo models of breast cancer. We provide evidence that partial loss of p85α increases the binding of p110α–p85 signaling complexes to activated receptors, thereby augmenting PI3K pathway output. Our findings indicate that p85α loss may be transforming in any context where PI3K is activated. Additionally, they implicate a role for monomeric free p85 as a negative regulator of PI3K signaling.
Keywords: PI3K, p85, breast cancer, targeted therapy
Abstract
Mutation or loss of the p85 regulatory subunit of phosphatidylinositol 3-kinase (PI3K) is emerging as a transforming factor in cancer, but the mechanism of transformation has been controversial. Here we find that hemizygous deletion of the PIK3R1 gene encoding p85α is a frequent event in breast cancer, with PIK3R1 expression significantly reduced in breast tumors. PIK3R1 knockdown transforms human mammary epithelial cells, and genetic ablation of Pik3r1 accelerates a mouse model of HER2/neu-driven breast cancer. We demonstrate that partial loss of p85α increases the amount of p110α–p85 heterodimers bound to active receptors, augmenting PI3K signaling and oncogenic transformation. Pan-PI3K and p110α-selective pharmacological inhibition effectively blocks transformation driven by partial p85α loss both in vitro and in vivo. Together, our data suggest that p85α plays a tumor-suppressive role in transformation, and suggest that p110α-selective therapeutics may be effective in the treatment of breast cancer patients with PIK3R1 loss.
Phosphatidylinositol 3-kinases (PI3Ks) are critical coordinators of the cellular response to extracellular signals. Of these, class IA PI3Ks are heterodimeric enzymes containing a p110 catalytic and a p85 regulatory subunit (1). The genes PIK3CA, PIK3CB, and PIK3CD, respectively, encode p110α, p110β, and p110δ, and PIK3R1, PIK3R2, and PIK3R3, respectively, encode the regulatory isoforms p85α, p85β, and p55γ. In the absence of activating signals, the interaction between p85 and p110 stabilizes and inhibits p110 catalytic activity (2). In the presence of growth factors or other signals, ligand binding to receptor tyrosine kinases (RTKs) promotes receptor activation. The p85 subunit binds to activated RTKs, recruiting p110 to the plasma membrane, where a conformational change induced by binding relieves inhibition of p110 catalytic activity.
PI3K pathway hyperactivation is one of the most frequent events in human cancers, commonly resulting from activating PIK3CA mutations, RTK mutation or amplification, or loss of the PI3K antagonist PTEN (3). The contribution of the regulatory isoforms to tumorigenesis has only recently been considered. Somatic mutations in PIK3R1 have been reported in glioblastoma and endometrial cancer, most of which are substitutions or indels in the iSH2 domain of p85α that contacts p110 (4). These mutants typically bind and stabilize p110, but cannot inhibit p110 catalytic activity (5).
Accumulating evidence also suggests that changes in p85α levels can modulate PI3K activation. In mice, partial loss of p85 isoforms improves insulin sensitivity (6). In some tissues, p85 is present in excess of p110, and monomeric free p85 may act as a negative regulator of PI3K signaling (7). Overexpression of p85α in myotubes reduced insulin-stimulated PI3K/AKT activation (8), and p85α overexpression in mice decreased skeletal muscle insulin signaling (9). Loss of p85α has also been proposed to play a role in cancer. PIK3R1 underexpression was detected in human breast cancer and, in mice, liver-specific Pik3r1 deletion led to the development of PI3K pathway-activated hepatocellular carcinoma (10, 11).
Here we demonstrate that p85α functions as a tumor suppressor. PIK3R1 is lost at the genomic and mRNA expression levels in breast cancer. We demonstrate that p85α depletion increases PI3K/AKT signaling and transformation in vitro, and accelerates tumor development in a mouse model of HER2-driven breast cancer. We provide evidence that partial p85α loss increases the ratio of signaling p85–p110 heterodimers bound to activated HER family receptors. Last, we show that p110α-selective inhibition blocks transformation driven by p85α loss. Our results indicate that p85α is a clinically relevant tumor suppressor and suggest that isoform-selective PI3K inhibitors may be effective in the treatment of cancers characterized by p85α expression loss.
Results
PIK3R1 Expression Is Reduced in Breast Cancers.
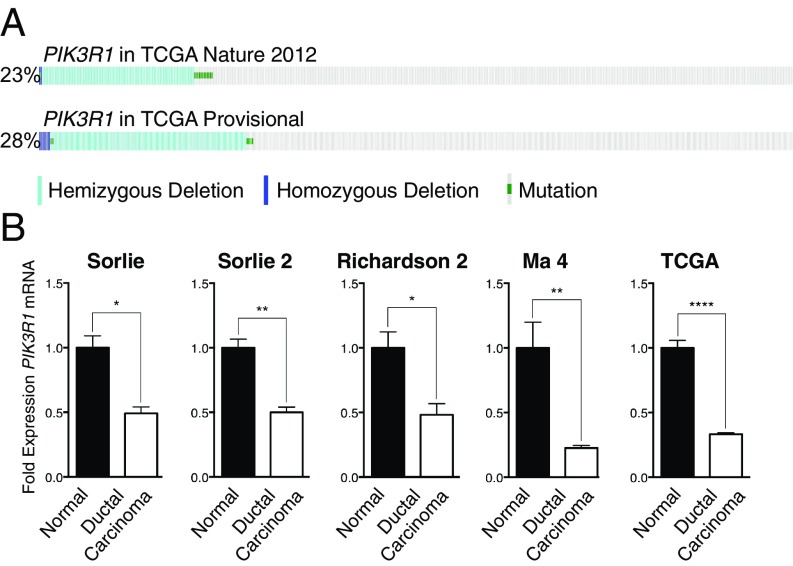
To determine whether p85α may play a tumor-suppressive role in breast cancer, we evaluated copy-number loss or mutation of PIK3R1 in publicly available datasets (12, 13). Such alterations in PIK3R1 occurred in 23 and 28% of breast cancers, respectively, with the majority of these being hemizygous PIK3R1 loss (Fig. 1A). PIK3R1 mRNA expression was also significantly reduced by 50 to 77% in breast cancer samples (Fig. 1B and Table S1) (14–17). Together, these results indicate that PIK3R1 is decreased in human breast cancer.
Fig. 1.
PIK3R1 is down-regulated at both the genomic and mRNA expression level in breast cancer. (A) The incidence of PIK3R1 copy-number loss or mutation in TCGA breast cancer cohorts. (B) PIK3R1 expression in breast cancer compared with normal breast (Oncomine). Means ± SEM are shown. *P < 0.05, **P < 0.01, ****P < 0.0001; unpaired t test.
Table S1.
Compilation of sources and data used for Oncomine analysis of PIK3R1 expression levels via microarray in breast cancer datasets
| Study | Source | Control tissue | Control, n | Cancer tissue | Cancer, n | % Reduction in PIK3R1 | P value |
| Sørlie et al. Breast | (14) | Normal breast | 4 | Ductal breast carcinoma | 65 | 50.80 | 0.0160 |
| Sørlie et al. Breast 2 | (15) | Normal breast | 4 | Ductal breast carcinoma | 81 | 50.06 | 0.0079 |
| Richardson et al. Breast 2 | (16) | Normal breast | 7 | Ductal breast carcinoma | 40 | 51.77 | 0.0186 |
| Ma et al. Breast 4 | (17) | Normal breast | 28 | Invasive ductal breast carcinoma | 18 | 77.34 | 0.0034 |
| TCGA Breast | TCGA 2001; no associated publication | Normal breast | 61 | Invasive ductal breast carcinoma | 389 | 66.71 | <0.0001 |
PIK3R1 Knockdown Transforms Human Mammary Epithelial Cells.
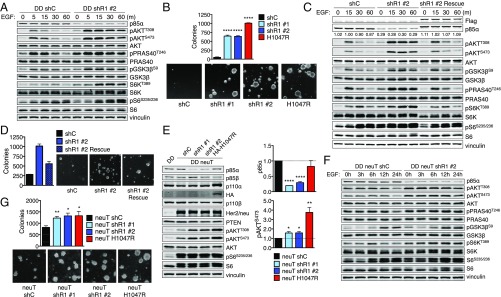
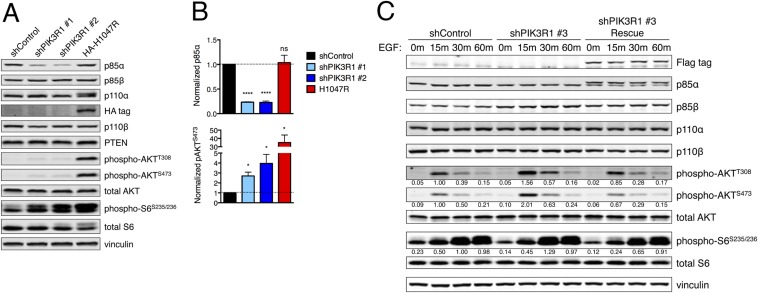
To study whether partial p85α loss transforms in vitro, we used hTERT immortalized human mammary epithelial cells (HMECs) that express a dominant-negative p53 mutant (DDp53). These HMECS are not transformed, as they are unable to form colonies in soft agar. Expression of cancer-associated mutant PIK3CA alleles transforms these cells (18). To address whether decreased PIK3R1 expression transforms mammary cells, we generated DDp53-HMEC lines with stable PIK3R1 knockdown. PIK3R1-targeted shRNAs reduced p85α expression (Fig. 2A and Fig. S1 A and B). Starvation followed by EGF stimulation increased and sustained PI3K/AKT signaling in shPIK3R1 cells, as indicated by increased AKT, PRAS40, GSK3β, S6K, and S6 effector phosphorylation (Fig. 2A). To assess the functional effect of augmented PI3K/AKT activation in shPIK3R1 cells, we determined the ability of these cells to undergo anchorage-independent growth. Both shPIK3R1 lines grow in soft agar (Fig. 2B). Expression of PIK3R1 rescue constructs restores p85α protein levels, attenuates PI3K/AKT pathway activation as indicated by reduced effector phosphorylation (Fig. 2C and Fig. S1 A and B), and partially rescues HMEC transformation mediated by PIK3R1 knockdown (Fig. 2D). Thus, reduction of PIK3R1 expression activates PI3K/AKT signaling and transforms breast cancer cell lines.
Fig. 2.
PIK3R1 knockdown increases RTK-mediated PI3K/AKT signaling in and transformation of HMECs. (A) Control and shPIK3R1 HMECs were starved and then stimulated with EGF before immunoblotting. (B) Cell suspensions of control and shPIK3R1 HMECs were grown in agar. (C) Control, shPIK3R1, and rescue HMECs were treated as in A before immunoblotting. (D) Cell suspensions of control, shPIK3R1, and PIK3R1 rescue HMECs were grown in agar. (E) Control, shPIK3R1, or p110α-H1047R HMECs expressing activated HER2/neu were starved overnight before immunoblotting. (F) Control and shPIK3R1 HER2/neu HMECs were treated as in A before immunoblotting. (G) Cell suspensions of control and shPIK3R1 HER2/neu HMECs were grown in agar. Means ± SEM are shown; n = 3. *P < 0.05, **P < 0.01, ****P < 0.0001; unpaired t test.
Fig. S1.
(A) HMECs of the indicated genotypes were starved for 4 h; protein lysates were collected and subjected to immunoblotting. (B) Bands from immunoblots as in A were quantified by densitometry. Means ± SEM are shown; n = 3 for each. Statistical significance was determined by unpaired t test. (C) Control, PIK3R1 knockdown, or PIK3R1 rescue HMECs were starved and then stimulated with EGF (20 ng/mL). Protein lysates were collected and subjected to immunoblotting. *P < 0.05, ****P < 0.0001; unpaired t test; ns, not significant.
Because the increased signaling in shPIK3R1 DDp53-HMECs was largely dependent on growth factor stimulation, we investigated whether reduced p85α cooperates with PI3K-activating oncogenes to promote signaling and transformation. We next generated shPIK3R1 DDp53-HMECs stably expressing neuT, an activated form of HER2/neu. Expression of neuT increases PI3K/AKT activation; concomitant PIK3R1 knockdown further enhances pathway activation and enhances colony formation, by increasing colony number and size (Fig. 2 E–G).
Transformation Driven by PIK3R1 Knockdown Is Mediated by Signaling Through p110α.
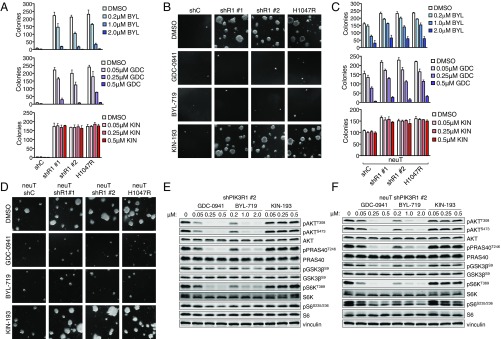
The PI3K catalytic isoforms play divergent roles in oncogenic signaling, which can inform clinical use of isoform-selective PI3K inhibitors. Accordingly, we used the pan-PI3K inhibitor GDC-0941, the p110α-selective inhibitor BYL-719, and the p110β-selective inhibitor KIN-193 to determine the contribution of p110 isoforms to the transformation of shPIK3R1 DDp53-HMECs (3). Treatment with either GDC-0941 or BYL-719, but not KIN-193, effectively blocks colony formation and PI3K/AKT effector signaling in shPIK3R1 HMECs (Fig. 3 A, B, and E). Thus, transformation with p85α depletion is largely mediated through p110α and not p110β.
Fig. 3.
Transformation of shPIK3R1 HMECs is blocked by p110α-selective inhibition. (A) Cell suspensions of the indicated HMEC lines were grown in agar. (B) Images of colonies from the maximum concentration of each condition in A. (C) Cell suspensions of the indicated HMEC lines were grown in agar. Means ± SD are shown; n = 3. (D) Images of colonies from the maximum concentration of each treatment condition shown in C. (E) shPIK3R1 HMECs were starved, treated for 1 h with the indicated inhibitors, and then stimulated with EGF in the presence of inhibitors before immunoblotting. (F) shPIK3R1 HER2/neu HMECs were treated and processed as in E.
Although it has been demonstrated that HER2/neu-driven transformation relies on p110α (19), coexisting genetic events can shift PI3K isoform dependency (20). Therefore, we determined which PI3K catalytic isoform mediates HER2/neu-driven transformation in the context of partial p85α loss. Anchorage-independent growth assays suggest that pan-PI3K or p110α-selective inhibitors block colony formation and attenuate PI3K/AKT effector signaling, whereas p110β-selective inhibition does not (Fig. 3 C, D, and F). Thus, augmented PI3K/AKT signaling in and transformation of shPIK3R1 HMECs with or without HER2/neu activation are primarily mediated by p110α.
Pik3r1 Ablation Increases Tumor Formation in Genetically Engineered Mouse Models.
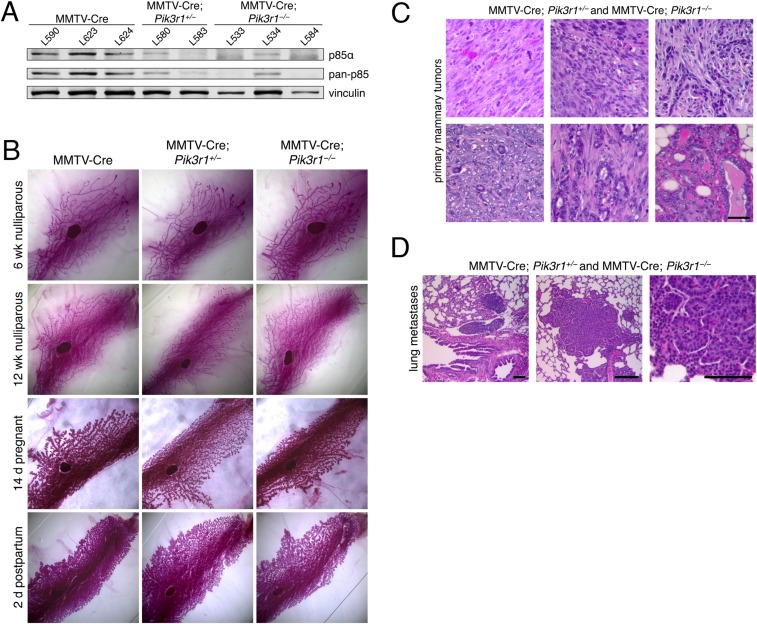
We next used genetically engineered mouse (GEM) models to examine whether loss of p85α contributes to mammary epithelial cell transformation in vivo. Mice bearing a floxed Pik3r1 allele (21) were crossed with mammary-specific MMTV-Cre mice (22). The resulting MMTV-Cre; Pik3r1+/loxP and MMTV-Cre; Pik3r1loxP/loxP mice have mosaic ablation of one or both Pik3r1 alleles in luminal mammary epithelial cells, and will hereafter be referred to as MMTV-Cre; Pik3r1+/− and MMTV-Cre; Pik3r1−/−, respectively (Fig. S2A). Pik3r1 ablation did not alter mammary gland development throughout pubertal development or lobuloalveolar development during pregnancy (Fig. S2B). However, nulliparous MMTV-Cre; Pik3r1+/− and MMTV-Cre; Pik3r1+/− females developed spontaneous mammary tumors with diverse pathology with an average latency of 14.1 mo, average survival of 14.4 mo, and penetrance of 90% (9/10) (Fig. S2C and Table S2). Metastasis of the primary tumor to the lung was observed in 11% (1/9) of the mice with spontaneous mammary tumors (Fig. S2D). Together, these observations suggest that p85α depletion alone is sufficient for mammary tumor development and metastasis in mice.
Fig. S2.
(A) Mouse mammary epithelial cells were derived from the mammary glands of individual nulliparous females of the indicated genotypes and collected and subjected to immunoblotting. (B) Whole mounts were prepared from the fourth inguinal mammary glands of MMTV-Cre, MMTV-Cre; Pik3r1+/−, and MMTV-Cre; Pik3r1−/− female mice during puberty (6 and 12 wk nulliparous), pregnancy (14 d pregnant), and lactation (2 d postpartum). Mammary glands were stained with carmine red to visualize ducts. Representative images from each genotype and stage are shown. (C) Hematoxylin and eosin (H&E) staining of primary spontaneous mammary tumors from the indicated genotypes. (Scale bar, 50 μm.) (D) H&E staining of lung metastases of primary mammary tumors from mice with the indicated genotypes. (Scale bars, 100 μm.)
Table S2.
Mouse tumor outcomes from the indicated genotypes
| Genotype | Mouse ID | Tumor latency, mo | Survival, mo | Primary tumor pathology | Lung metastasis? | Comments (n) |
| MMTV-Cre; Pik3r1+/− | A659 | 10.7 | 11.6 | Undifferentiated adenocarcinoma, sarcoma | No | Focal mammary tumor (1) |
| MMTV-Cre; Pik3r1+/− | A609 | 12.7 | 15.9 | Undifferentiated adenocarcinoma, sarcoma | No | Multifocal mammary tumors (3) |
| MMTV-Cre; Pik3r1+/− | A603 | 13.5 | 14.9 | Undifferentiated adenocarcinoma, sarcoma | No | Multifocal mammary tumors (2) |
| MMTV-Cre; Pik3r1+/− | A605 | 17.1 | 17.8 | ND | No | Multifocal mammary tumors (2) |
| MMTV-Cre; Pik3r1+/− | A607 | 17.9 | ND | ND | No | |
| MMTV-Cre; Pik3r1−/− | A660 | ND | 10.7 | Undifferentiated adenocarcinoma, sarcoma | Yes | Focal mammary tumor (1) |
| MMTV-Cre; Pik3r1−/− | A606 | 12.2 | 14.1 | Undifferentiated adenocarcinoma, sarcoma | No | Multifocal mammary tumors (3) |
| MMTV-Cre; Pik3r1−/− | A602 | 13.9 | 15.2 | Mammary adenocarcinoma, mammary hyperplasia | No | Focal mammary tumor (1) |
| MMTV-Cre; Pik3r1−/− | A597 | 14.7 | 14.9 | Undifferentiated adenocarcinoma, sarcoma | No | Multifocal mammary tumors (2) |
| MMVC-Cre; Pik3r1−/− | A618 | NA | NA | NA | NA | Killed mouse at 22 mo due to severe contact dermatitis; did not have tumors |
The table includes tumor latency, overall animal survival, presence of metastatic events, and pathology of primary tumor(s). NA, not available; ND, not determined.
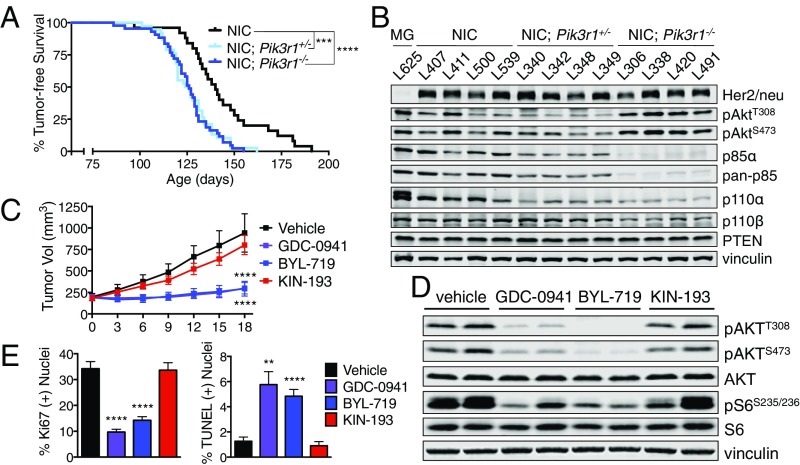
To further study the contribution of p85α loss to in vivo mammary tumorigenesis, we combined a GEM model of HER2/neu-driven breast cancer with the conditional Pik3r1 knockout mice. We bred Pik3r1 floxed mice with MMTV-NIC mice, which express a bicistronic transgene consisting of an activated HER2/neu allele and Cre recombinase under control of the MMTV LTR promoter (23). The resulting MMTV-NIC; Pik3r1+/− and MMTV-NIC; Pik3r1−/− mice have ablation of one or both Pik3r1 alleles in the same luminal mammary epithelial cells that express oncogenic HER2/neu. These strains will hereafter be referred to as NIC, NIC; Pik3r1+/−, and NIC; Pik3r1−/−. NIC, NIC; Pik3r1+/−, and NIC; Pik3r1−/− genotypes developed multifocal tumors with 100% penetrance. NIC mice developed palpable tumors with a mean latency of 140 d. Ablation of Pik3r1 significantly reduced the time to tumor onset: NIC; Pik3r1+/− and NIC; Pik3r1−/− mice developed tumors with mean latencies of 125 and 126 d, respectively (Fig. 4 A and B). These data indicate that p85α depletion significantly reduces the latency of HER2/neu-driven mammary tumorigenesis in mice.
Fig. 4.
Tumors characterized by activated Her2/Neu and p85α loss are sensitive to pan-PI3K and p110α-selective inhibition. (A) Tumor-free survival of the indicated mouse genotypes. Median tumor-free survival: NIC, 140 d (n = 25); NIC; Pik3r1+/−, 125 d (n = 38); NIC; Pik3r1−/−, 126 d (n = 43); log-rank (Mantel–Cox) test. (B) Mammary tumor lysates of the indicated genotypes were subjected to immunoblotting. MG, mammary gland from MMTV-Cre mouse genotype. (C) Tumor volume of orthotopically transplanted NIC; Pik3r1+/− mammary tumors following once-daily treatment with GDC-0941, BYL-719, or KIN-193. End-point tumor volumes: vehicle, 942.6 ± 222.9 mm3; GDC-0941, 199.5 ± 66.8 mm3; BYL-719, 293.2 ± 85.0 mm3; KIN-193, 801.6 ± 111.1 mm3. Means ± SEM are shown; all treatment groups n ≥ 10; two-way ANOVA with Tukey’s multiple-comparisons test. (D) Transplanted NIC; Pik3r1+/− mammary tumors were treated as in C. One hour after treatment on day 4, recipients were killed and tumor tissue was subjected to immunoblotting. (E) The percentage of Ki67- or TUNEL-positive nuclei in Fig. S3G. Means ± SEM are shown; all groups n = 8. **P < 0.01, ***P < 0.001, ****P < 0.0001; unpaired t test.
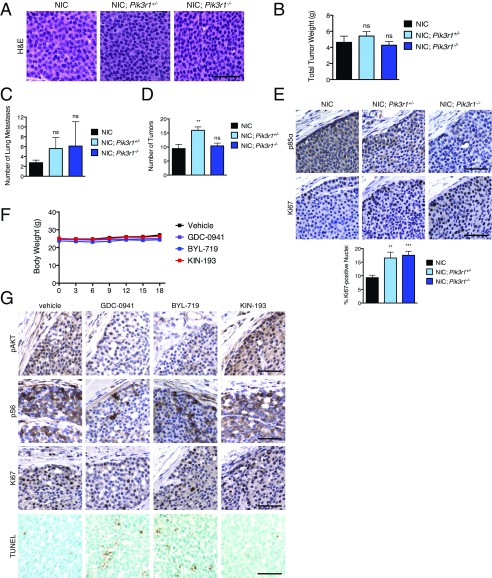
We examined whether partial p85α loss affected HER2/neu-driven mouse mammary tumors. Tumors from mice of all three genotypes had solid nodular carcinoma histology and tumors of similar weight (Fig. S3 A and B). A trend toward higher incidence of lung metastasis in mice with Pik3r1 deletion and an increase in tumor number was observed exclusively in heterozygous NIC; Pik3r1+/− mice (Fig. S3 C and D). However, NIC; Pik3r1+/− and NIC; Pik3r1−/− tumors had nearly double the proliferation indices (Fig. S3E). Together, these results demonstrate that reduced p85α expression increases the proliferative capacity of HER2/neu tumor cells, correlating with the reduced time to mammary tumor onset.
Fig. S3.
(A) Mammary tumor tissue from NIC, NIC; Pik3r1+/−, and NIC; Pik3r1−/− female mice was fixed in formalin and stained with H&E. (Scale bar, 50 μm.) (B) The total wet weight of mammary tumors plus associated mammary gland tissue per mouse from NIC (n = 16), NIC; Pik3r1+/− (n = 20), and NIC; Pik3r1−/− (n = 20) females was determined 5 wk after initial tumor palpation. Means ± SEM are shown. Statistical significance was determined by unpaired t test. Significance for NIC; Pik3r1+/− and NIC; Pik3r1−/− in comparison with the NIC control is shown. (C) Number of lung metastases per mouse 5 wk after initial tumor palpation. n = 8 for each genotype. (D) Number of total tumors per mouse 5 wk after initial tumor palpation. n = 8 for each genotype. (E, Top) Immunohistochemical (IHC) analysis of formalin-fixed mammary tumor tissue from mice of the indicated genotypes. (Scale bar, 50 μm.) (E, Bottom) The percentage of Ki67-positive nuclei from IHC analysis. n = 12. (Scale bar, 50 μm.) (F) Body weight of NCrNu female mice with orthotopic transplant of NIC; Pik3r1+/− mammary tumors treated daily with GDC-0941 (125 mg/kg), BYL-719 (45 mg/kg), KIN-193 (20 mg/kg), or vehicle control as in Fig. 4C. Means ± SEM are shown; n ≥ 10 for each treatment group. (G) IHC analysis of mammary tumor tissue from transplanted NIC; Pik3r1+/− mammary tumors treated as in Fig. 4D. (Scale bars, 50 μm.) **P < 0.01, ****P < 0.0001; unpaired t test.
Growth of Mammary Tumors with Pik3r1 Ablation Is Blocked by p110α-Selective Inhibitors.
Because pan-PI3K or p110α-selective inhibitors blocked HMEC transformation driven by partial p85α loss, we determined whether these agents could inhibit growth of HER2/neu-driven mammary tumors with p85α depletion. Primary tumors were excised from a NIC; Pik3r1+/− donor female and orthotopically transplanted into NCrNu female recipients. Recipient mice were treated daily with vehicle, GDC-0941, BYL-719, or KIN-193, all without affecting animal body weight (Fig. S3F). Treatment with GDC-0941 or BYL-719 significantly reduced tumor growth, whereas KIN-193 had no effect (Fig. 4C). Tumors treated with either GDC-0941 or BYL-719 exhibit reduced AKT and S6 phosphorylation, a lower proliferative index, and the presence of TUNEL-positive apoptotic nuclei (Fig. 4 D and E and Fig. S3G). These results indicate that p110α-selective and pan-PI3K inhibitors attenuate PI3K/AKT signaling and block in vivo tumor growth in the context of reduced p85α expression.
PIK3R1 Knockdown Increases p85–p110α Bound to Activated RTKs.
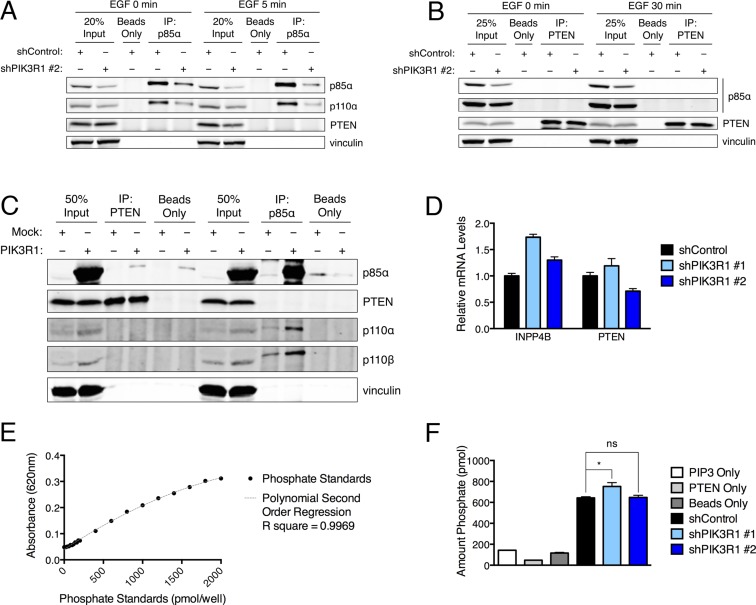
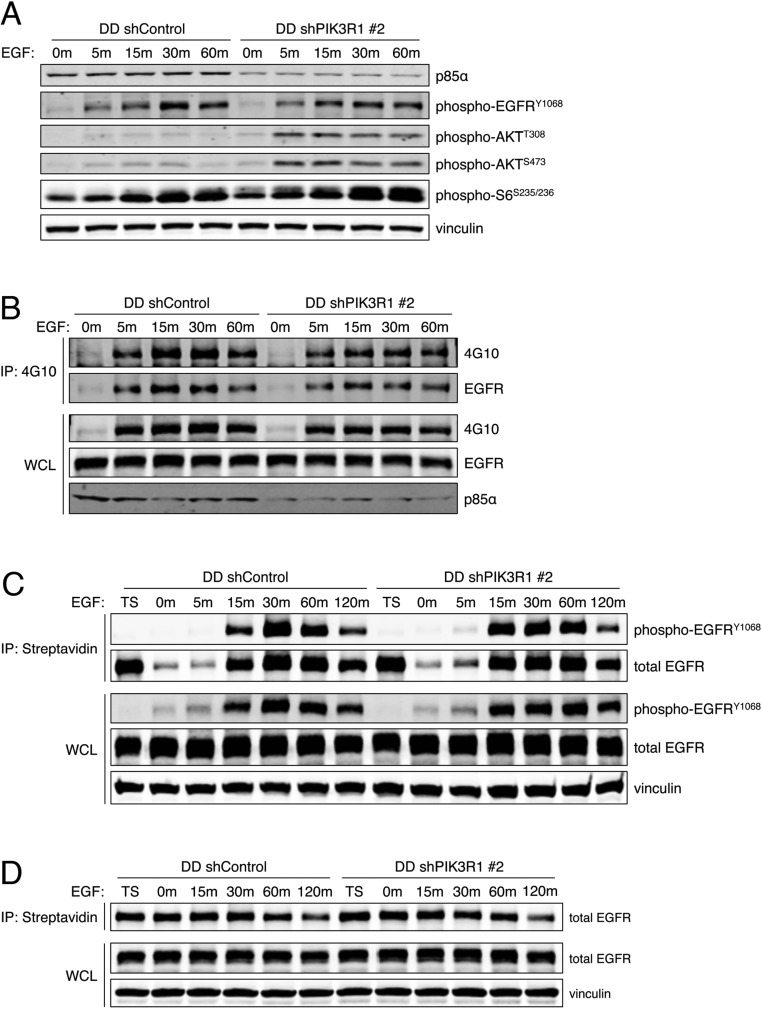
We next examined the mechanism by which reduced p85α levels could increase PI3K/AKT signaling output and mediate transformation. Despite publications suggesting that p85α may increase PTEN phosphatase activity (24, 25) or PTEN stability (11), we were unable to confirm p85–PTEN association (Fig. S4 A–C), p85α-mediated reduction in PTEN protein or mRNA levels (Fig. 2E and Figs. S1A and S4D), or p85α-mediated effect on the lipid phosphatase activity of PTEN (Fig. S4 E and F). PIK3R1 knockdown also did not affect EGFR phosphorylation, internalization, or degradation (Fig. S5).
Fig. S4.
(A) Control and shPIK3R1 HMECs were starved and then stimulated with EGF (20 mg/mL) for 5 min. Protein lysates were collected and subjected to immunoprecipitation (IP) for endogenous p85α; immunoprecipitates were subjected to immunoblotting. (B) Control and shPIK3R1 HMECs were starved and then stimulated with EGF (20 mg/mL) for 30 min. Protein lysates were collected and subjected to immunoprecipitation for endogenous PTEN; immunoprecipitates were subjected to immunoblotting. (C) 293T cells were transfected with wild-type PIK3R1. Protein lysates were collected and subjected to immunoprecipitation for PTEN or p85α; immunoprecipitates were subjected to immunoblotting. (D) mRNA levels of INPP4B and PTEN mRNA in control and shPIK3R1 HMECs. Means ± SD are shown for one experiment performed in triplicate. Levels were normalized to the corresponding mean for shControl. (E and F) In vitro lipid phosphatase assays for PTEN immunoprecipitated from control and shPIK3R1 HMECs. A malachite green reagent was used to detect phosphate in prepared standards (E) or released upon incubation of PtdIns(3,4,5)P3 substrate with PTEN immunoprecipitates (F). Three negative controls were used: PIP3 only, assay performed using substrate but no source of PTEN; PTEN only, assay performed using PTEN immunoprecipitated from shControl cells but with no substrate added; and beads only, assay performed using precipitates from shControl cells in which no PTEN antibody was used. The amount of phosphate released in in vitro assays was interpolated from comparison with the phosphate standards. (E) Means ± SD are shown for standards in triplicate. (F) Means ± SEM are shown for assays performed using three independent immunoprecipitation reactions per cell line. Statistical analysis was performed using unpaired t test compared with shControl. *P < 0.05; ns, not significant.
Fig. S5.
(A) Control and shPIK3R1 HMECs were starved and then stimulated with EGF (20 ng/mL). Protein lysates were collected and subjected to immunoblotting. (B) Control and shPIK3R1 HMECs were starved and then stimulated with EGF (20 ng/mL). Protein lysates were collected and subjected to immunoprecipitation with beads conjugated to 4G10. Immunoprecipitates and whole-cell lysates (WCLs) were subjected to immunoblotting for phospho-tyrosines at the expected molecular mass of EGFR. (C) Control and shPIK3R1 HMECs were starved; surface proteins were labeled with biotin, cells were stimulated with EGF (20 ng/mL) to initiate receptor internalization, and the remaining surface biotin was cleaved. Protein lysates were collected and subjected to streptavidin immunoprecipitation to capture internalized biotinylated proteins. Immunoprecipitates and WCLs were subjected to immunoblotting for tyrosine-phosphorylated EGFR. TS, total surface protein before stimulation. (D) Control and shPIK3R1 HMECs were starved; surface proteins were labeled with biotin and cells were stimulated with EGF (20 ng/mL) to initiate receptor internalization and degradation. Protein lysates were collected and subjected to streptavidin immunoprecipitation to capture all remaining biotinylated proteins. Immunoprecipitates and WCLs were subjected to immunoblotting for total EGFR.
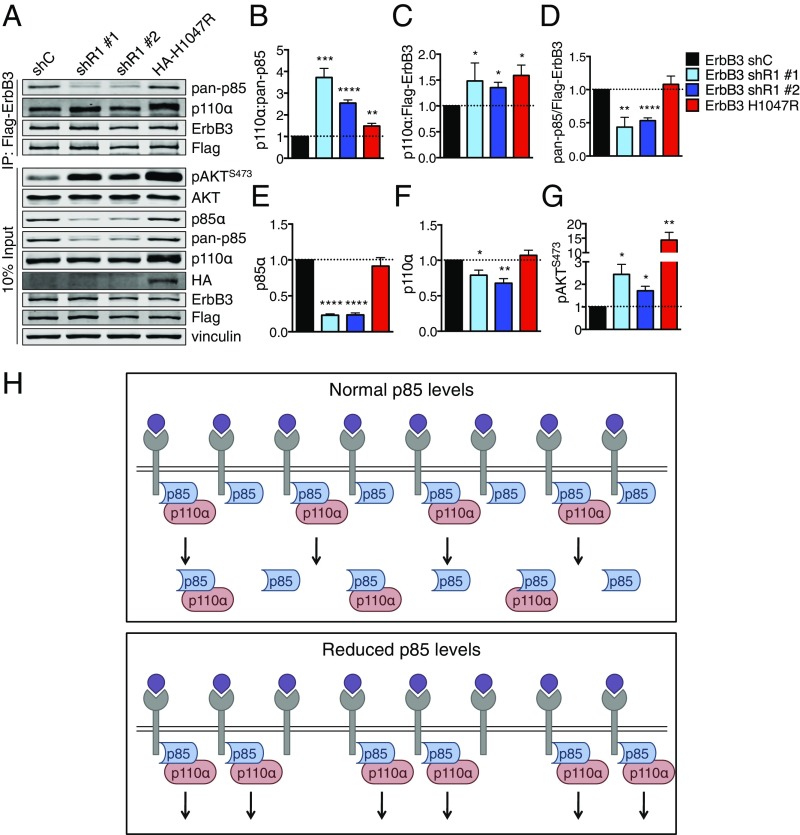
However, monomeric, free p85 has been shown to function as a potent p110 inhibitor (7). Activation of RTKs recruits p85–p110 heterodimers to the plasma membrane, which initiates a conformational change to p110α that results in its activation. We therefore considered the possibility that partial p85α loss enhances the specific pool of p85–p110 heterodimers that bind to and potentiate RTK-mediated signal transduction. PIK3R1 knockdown increases the ratio of p85–p110α heterodimers associated with the RTK ErbB3 (Fig. 5 A and B). PIK3R1 knockdown also increases p110α–ErbB3 association, despite a 50% reduction in p85 association with ErbB3 (Fig. 5 C and D). Increased p85–p110 association with ErbB3 activates AKT (Fig. 5 E–G). These results demonstrate that partial PIK3R1 knockdown increases the association of remaining p85 with p110 and ErbB3, promoting oncogenic activation of PI3K/AKT effector signaling.
Fig. 5.
PIK3R1 knockdown increases the amount of RTK-bound p110α–p85 in HMECs. (A) Control and shPIK3R1 Flag-ErbB3 HMECs were starved and then lysed. ErbB3 was immunoprecipitated using anti-Flag beads and subjected to immunoblotting. IP, immunoprecipitation. (B–G) Bands from immunoblots as in A were quantified. (B–D) Quantification of protein levels in ErbB3 IPs. (B) Protein levels of p110α were normalized to pan-p85 in IPs, then to the mean for shControl. (C and D) Protein levels were normalized to ErbB3 in the IPs, then to the mean for shControl. (E–G) Quantification of protein in inputs. (E and F) Protein was normalized to vinculin, then to the mean for shControl. (G) Protein was normalized to AKT, then to the mean for shControl. Means ± SEM are shown; n = 4. *P < 0.05, **P < 0.01, ***P < 0.001, ****P < 0.0001; unpaired t test. (H) Model in which free p85 competes with p85–p110 to negatively regulate RTK-mediated PI3K/AKT signaling in mammary epithelial cells. (H, Top) In cells with normal p85α levels, p85 is present in excess of p110. Both free p85 and p85–p110 can compete for binding to activated RTKs, but only p85–p110 can signal. (H, Bottom) In cells with reduced p85α, the pool of free p85 is selectively depleted. More binding sites on activated RTKs are available for p85–p110, allowing for up-regulated PI3K/AKT signaling.
Discussion
Studies from mouse models with knockout of p85 regulatory subunits have had surprising results. Mice with Pik3r1 ablation (deleting p85α, p55α, and p50α) (26), just p85α (27), p55α and p50α (28), or Pik3r2 (deleting p85β) (29) all exhibit hypoglycemia, increased sensitivity to insulin, and augmented insulin-mediated Akt activation. Here we present evidence that PIK3R1 knockdown transforms HMECs, increasing their proliferation and activation of the PI3K pathway in response to EGF stimulation. We show that in a mouse model of Her2/neu-driven breast cancer, mammary-specific Pik3r1 ablation reduces the latency of mammary tumor development, increases tumor burden, and up-regulates PI3K pathway activation.
Because p85 stabilizes the p110 subunit and recruits it to the cell membrane (2), it seems paradoxical that a reduction in p85 might lead to increased PI3K output. Our data support a model where PIK3R1 knockdown selectively reduces a pool of free p85α, allowing for increased binding of p85–p110 signaling-capable heterodimers to activated RTKs and increased PI3K output (Fig. 5H). Accumulating evidence indicates an imbalance between the regulatory and catalytic PI3K subunits: Immunodepletion suggests that the ratio of p85–p110 dimers to free p85 monomers is 2:1 (6). Quantitative mass spectrometry has shown that endogenous p85 and p110 are present in equal amounts in mouse muscle, liver, fat, and spleen, whereas p85 is present in a twofold excess over p110 in the brain (30). Our data suggest that mammary epithelial cells have p85 in excess of p110, and that this free p85 monomer plays a role in the regulation of PI3K activity. Free p85 can homodimerize, with all four SH2 domains in a flexible conformation. This flexible p85 SH2 conformation (31) is likely to enhance avidity for the nine pYXXM motifs in IRS1 in comparison with the p85–p110 heterodimer, where only the C-terminal p85 SH2 domain has high affinity for the IRS1 motifs (the N-terminal SH2 domain interacts with p110 in a manner that impairs but does not eliminate binding to pYXXM motifs). The clustering and sequestration of IRS1 by the p85 homodimer (32) likely contribute to the ability of free p85 to suppress insulin signaling.
Reports have linked p85α to the control of the activity or stability of PTEN. Mice with liver-specific Pik3r1 knockout have reduced total PI3K activity but an increase in Akt activation and sustained PIP3 production; the lipid phosphatase activity of PTEN was found to be reduced (24). Addition of increasing amounts of p85α has also been shown to augment PTEN lipid phosphatase activity in vitro (25). Furthermore, p85α and PTEN have been reported to directly interact (33). We did not find an effect of PIK3R1 knockdown on the lipid phosphatase activity of PTEN immunoprecipitates in vitro, nor did we detect a reduction in PTEN protein or mRNA in shPIK3R1 HMECs or in tumors from NIC; Pik3r1−/− mice. It may be that PTEN loss is a secondary event, rather than driving transformation mediated by p85α loss.
A number of recent reports have described genomic alterations in PIK3R1. Point mutations in the nSH2 and iSH2 p85α domains activate PI3K signaling and promote tumorigenesis in models of glioblastoma (34). Deletion of PIK3R1 exon 13 was detected in human ovarian and colon cancer cell lines and primary tumors (35). Somatic PIK3R1 mutations have been found in a variety of cancers with a frequency of 2 to 24% (4, 10). A subset of cancer-associated PIK3R1 mutations codes for premature truncation of the p85α protein (5), but the transforming mechanism of p85α truncation is unknown. Truncation mutants lose the C-terminal SH2 domain, and thus p85 homodimers with these truncations may not be as effective at binding IRS1. The remaining full-length p85α allele, in cases with hemizygous p85α loss, likely binds more readily to p110α and promotes recruitment to IRS1. Thus, we speculate that truncation mutants that lack the C-terminal SH2 domain might have a similar effect on PI3K signaling as reduction in p85α, and may transform cells by freeing binding spaces on activated RTKs for signaling-proficient p110–p85α heterodimers.
Our data demonstrate that transformation mediated by p85α loss occurs primarily by signaling through p110α. In mice, treatment with pan- and p110α-specific inhibitors slows the growth of transplanted NIC tumors with Pik3r1 ablation. The data presented here indicate that in cancers where expression of p85α is reduced or functionally inactivated, treatment with p110α-specific inhibitors such as BYL-719 is as effective as pan-PI3K inhibition. Importantly, this is one case where therapeutic targeting of loss of a tumor suppressor is possible due to identification of activated downstream pathways.
Materials and Methods
For additional information, please refer to SI Materials and Methods.
Publicly Available Clinical Data.
cBio (www.cbioportal.org) was used to query The Cancer Genome Atlas (TCGA) breast invasive carcinoma studies. The Oncomine database (https://www.oncomine.org) was queried for expression of PIK3R1 in breast cancer microarray studies. Data were converted to raw expression levels of PIK3R1 by taking the inverse log2, and then normalized to the mean raw PIK3R1 expression level of normal breast tissue.
Protein Lysate Preparation, Immunoprecipitation, and Immunoblotting.
Cells were lysed in Nonidet P-40 lysis buffer (137 mM NaCl, 20 mM Tris⋅HCl, pH 8.0, 0.2 mM EDTA, 10% glycerol, 1% Nonidet P-40) with protease and phosphatase inhibitors. For preparation of lysates from tissue, tissue was snap-frozen and then homogenized in Nonidet P-40 lysis buffer using 0.5-mm zirconium oxide beads (Next Advance) in an air-cooling Bullet Blender (Next Advance). For immunoprecipitation of Flag-ErbB3 from HMECs, cells were rinsed with PBS and starved for 4 h before lysis. Anti-Flag beads were incubated with 1 mg lysate, washed, and resuspended in SDS/DTT sample buffer. Proteins were separated by SDS/PAGE and transferred onto nitrocellulose membranes. Proteins of interest were visualized and quantified (Odyssey; LI-COR) after primary antibody incubation: vinculin and Flag (Sigma), pan-p85 and p85α (Millipore), p85β (Santa Cruz), Flag (OriGene), ErbB2 (Calbiochem), and p110α, p110β, HA, ErbB3, PTEN, p-AKTT308, p-AKTS473, total AKT, p-PRAS40T246, PRAS40, p-p70S6KT389, p70S6K, p-GSK3βS9, GSK3β, p-S6S235/236, S6, p-EGFRY1068, and EGFR (Cell Signaling Technology; CST).
Histology and Immunohistochemistry.
FFPE tumors were sectioned and mounted. Hematoxylin and eosin staining was performed by the Harvard Medical School Rodent Histopathology Core. Immunohistochemical staining was performed using a sodium citrate antigen retrieval method (Boston BioProducts). Slides were incubated with the following primary antibodies overnight: p85α (EMD Millipore), p-AKTS473 (CST), p-S6S235/236 (CST), and Ki67 (Vector Labs). Antibody signal was detected using biotinylated goat anti-rabbit IgG secondary antibody and DAB-developed (Vector Labs), and slides were counterstained with hematoxylin (Vector Labs). For TUNEL, the ApopTag Plus Peroxidase In Situ Apoptosis Detection Kit was used (EMD Millipore) followed by a counterstain with methyl green (Vector Labs). Slides were imaged (Nikon; Eclipse E600 microscope).
Growth Factor Stimulation Time-Course Assays.
Cells were rinsed with PBS and starved in HMEC starvation medium (DMEM/F12 GlutaMAX with penicillin/streptomycin). Human recombinant EGF was used at 20 ng/mL to stimulate cells.
Anchorage-Independent Growth Assays.
Cells were plated in a solution of 0.3% agar in HMEC growth medium on top of a base layer of 0.6% agar in DMEM. Images of unstained colonies were taken (Nikon; SMZ-U). Plates were then stained with 0.5 mg/mL iodonitrotetrazolium chloride (Sigma); pictures of stained plates were taken (Alpha Innotech; AlphaImager EP transilluminator).
Mice.
MMTV-Cre (22), NIC (23), and Pik3r1 floxed (36) mice were backcrossed to FVB/N. Male MMTV-Cre or NIC Pik3r1+/− mice were crossed with female Pik3r1+/− mice. For orthotopic tumor transplantations, 8-wk-old NCrNu female mice (Harlan) were used. Recipient mice were treated daily with vehicle [0.5% (wt/vol) methylcellulose via oral gavage at 1 mL/kg body weight], BYL-719 (in 0.5% methylcellulose, via oral gavage at 45 mg/kg), GDC-0941 (in 0.5% methylcellulose, via oral gavage at 125 mg/kg), or KIN-193 (in 7.5% 1-methyl-2-pyrrolidinone and 40% PEG400, via i.p. injection at 20 mg/kg). All animals were housed and treated in accordance with protocols approved by the Institutional Animal Care and Use Committees of the Dana-Farber Cancer Institute and Harvard Medical School.
SI Materials and Methods
Graphing Software and Statistical Analysis.
All graphs and statistical analysis were done using GraphPad Prism 6.0 for Mac OS X.
Vectors.
pLKO.1 shRNA vectors were obtained from the RNAi Consortium (Broad Institute): shPIK3R1 #1 TRCN0000039903 and shPIK3R1 #2 TRCN0000033284. A scrambled shControl 5′-TCC TAA GGT TAA GTC GCC CTC G-3′ was used. Retroviral vectors were as follows: pWZL-blasticidin-p53DD, pBabe-neomycin-p53DD, pBabe-blasticidin-neuT, pWZL-neomycin-HA-PIK3CAH1047R, pBabe-puromycin-HA-PIK3CAH1047R, and pWZL-neomycin-Flag-TEL-ErbB3. To generate constructs for rescue of PIK3R1 knockdown, a pCMV6 entry vector containing the cDNA ORF of wild-type human PIK3R1 with C-terminal Myc and Flag tags (OriGene; RC210544) was subcloned into the pWZL-blasticidin retroviral vector. This vector was used for rescue of shPIK3R1 #1. For rescue of shPIK3R1 #2, the QuikChange II XL Site-Directed Mutagenesis Kit (Agilent) was used to make wobble point mutations T1197C and G1203A.
Additional Vectors.
Additional lentiviral pLKO.1-puromycin shRNA vectors (RNAi Consortium, Broad Institute) were validated for PIK3R1 knockdown. The product numbers for these vectors were as follows: shPIK3R1 #3 TRCN0000196285 and shPIK3R1 #4 TRCN0000033286. To generate a construct for rescue of PIK3R1 knockdown by shPIK3R1 #3, wild-type human PIK3R1 with C-terminal Myc and Flag tags (OriGene; RC210544) was subcloned into the pWZL-blasticidin retroviral vector; the QuikChange II XL Site-Directed Mutagenesis Kit (Agilent) was used to make wobble point mutations T1098C and T1104C.
Cell Culture.
hTERT-immortalized HMECs were cultured in HMEC growth medium (DMEM/F12 GlutaMAX supplemented with 0.01 μg/mL EGF, 10 μg/mL insulin, 0.025 μg/mL hydrocortisone, 1 ng/mL cholera toxin, 0.6% FBS, 1% penicillin/streptomycin, and 0.5 μg/mL Amphotericin B). 293T and Phoenix cells used for virus production were cultured in DMEM, 10% FBS. All cells were maintained at 37 °C and 5% CO2.
Generation of Stable Polyclonal Cell Lines.
VSV lentivirus was produced by transfecting 293T cells with the pMD2-VSV-G and pCMV-ΔR8.91 packaging vectors along with a pLKO.1 vector encoding the shRNA of interest. Retrovirus was produced by transfecting Phoenix cells with the retroviral vector encoding the gene of interest and was harvested 2 to 3 d posttransfection. Stable HMEC lines were generated by infecting cells with viral supernatants in the presence of 4 μg/mL Polybrene (Millipore) overnight, followed by selection for several days in HMEC growth medium containing the appropriate antibiotic (250 μg/mL neomycin, 2.5 μg/mL blasticidin, or 1.5 μg/mL puromycin).
Immunoprecipitation Assays.
For immunoprecipitation of phospho-tyrosine–containing proteins, HMECs were rinsed twice with PBS and given HMEC starvation medium for 4 h before being lysed in Nonidet P-40 lysis buffer. For each reaction, 10 μL 4G10 anti–phospho-tyrosine Sepharose bead slurry (Millipore) and 100 μg total protein from the appropriate whole-cell lysate were incubated on a rotator overnight at 4 °C. Beads were washed three times with Nonidet P-40 lysis buffer and then resuspended in SDS/DTT sample buffer.
For immunoprecipitation of p85α or PTEN from HMECs, cells were rinsed twice with PBS and given HMEC starvation medium for 4 h, and then stimulated with human recombinant EGF (Sigma) prepared in HMEC starvation medium to a final concentration of 20 mg/mL for the indicated amounts of time before being lysed in Nonidet P-40 lysis buffer. For immunoprecipitation of p85α or PTEN from transfected 293T cells, asynchronous cells were lysed in Nonidet P-40 lysis buffer 2 d after transfection with pCMV6-PIK3R1-Myc-Flag (OriGene; RC210544). For each reaction, 30 μL protein A/G Sepharose bead slurry (Santa Cruz), 1 mg total protein from the appropriate whole-cell lysate, and either 4 μL anti-PTEN antibody (Cell Signaling Technology; 9559) or 4 μL anti-p85α antibody (Millipore; 05212) was incubated on a rotator for 1 h at 4 °C. Beads were washed three times with Nonidet P-40 lysis buffer and then resuspended in SDS/DTT sample buffer.
PTEN Lipid Phosphatase Activity Assay.
Asynchronous HMECs were lysed in Nonidet P-40 lysis buffer. Endogenous PTEN was immunoprecipitated from cell lysates in triplicate reactions. For “beads-only” reactions, 2 mg total protein from shControl whole-cell lysate was used. For “PTEN-only” reactions, 2 mg total protein from shControl whole-cell lysate was mixed with 8 μL anti-PTEN antibody (Cell Signaling Technology; 9559). For all other reactions, 2 mg total protein from the appropriate whole-cell lysate was mixed with 8 μL anti-PTEN antibody (Cell Signaling Technology; 9559). All reactions were incubated on a rotator overnight at 4 °C before adding 40 μL protein A/G beads (Santa Cruz) and incubating on a rotator for 3 h at 4 °C. The beads were washed three times with Nonidet P-40 lysis buffer and then washed once with PTEN reaction buffer [TBS (25 mM Tris⋅HCl, pH 7.5, 140 mM NaCl, 2.7 mM KCl) with 10 mM DTT added fresh]. The beads were resuspended in 30 μL PTEN reaction buffer and used in in vitro PTEN lipid phosphatase assays (Echelon Biosciences; method adapted from provided documents). Briefly, phosphate standards from 0 to 2,000 pmol were prepared using provided reagents. Then, 2 μL 1 mM diC8PtdIns(3,4,5)P3 was added to each of the standards, a “PIP3 substrate-only” control (consisting of PTEN reaction buffer only), and the immunoprecipitation reactions and accompanying controls, and brought to a final volume of 50 μL with PTEN reaction buffer. After incubation at 37 °C for 30 min, 100 μL malachite green reagent was added to each reaction and incubated for 10 min at room temperature. The optical density at 620 nm, corresponding to phosphate released by PTEN enzymatic activity, was read using a Benchmark Plus microplate spectrophotometer (Bio-Rad) and the accompanying Microplate Manager III software, version 1.133 for Mac OS X.
Receptor Internalization and Degradation Assays.
To track internalization of EGFR, HMECs were rinsed with PBS and starved overnight in HMEC starvation medium. Plates were washed with PBS-CM (PBS with 1 mM MgCl2 and 0.1 mM CaCl2 added), and then incubated on a rocker for 40 min at 4 °C with 5 mL PBS-CM containing 0.5 mg/mL sulfo-NHS-SS-biotin (Pierce) to label surface proteins. Plates were washed with PBS-CM and then incubated on a rocker for 10 min at 4 °C with 10 mL PBS-CM containing 50 mM NH4Cl (Sigma) to inactivate excess unbound sulfo-NHS-SS-biotin. Plates were washed with PBS-CM. One plate per cell line was then lysed with Triton X-100 lysis buffer (200 mM NaCl, 75 mM Tris⋅HCl, pH 7.5, 15 mM NaF, 2.5 mM EDTA, 2.5 mM EGTA, 1.5% Triton X-100, 0.75% Nonidet P-40, 0.1% SDS) for determination of total surface EGFR. The remaining plates were stimulated with 20 mg/mL human recombinant EGF (Sigma) in HMEC starvation medium for the indicated amounts of time to induce receptor internalization. Plates were rinsed with PBS-CM, washed twice with 10 mL glutathione buffer (90 mM NaCl, 1 mM MgCl2, 0.1 mM CaCl2, 50 mM reduced glutathione, 60 mM NaOH) to cleave any sulfo-NHS-SS-biotin remaining on the cell surface, and rinsed with 10 mL PBS-IAA (50 mM iodoacetamide in PBS-CM) on a rocker at 4 °C for 15 min to quench excess glutathione. After rinsing with PBS-CM, cells were lysed with Triton X-100 lysis buffer. A portion of each sample was reserved for whole-cell lysates, and the rest was used in streptavidin immunoprecipitation. First, 1 mg total protein per sample was precleared by incubating with Pansorbin (Calbiochem) on a rotator at 4 °C for 1 h. Pansorbin was removed by centrifugation at 700 × g, and 40 μL streptavidin beads (Pierce) was added for overnight immunoprecipitation reactions. Beads were rinsed four times with Triton X-100 lysis buffer and resuspended in SDS/DTT sample buffer.
To track degradation of EGFR, HMECs were rinsed with PBS and starved overnight in HMEC starvation medium. Plates were washed with PBS-CM, and then incubated on a rocker for 40 min at 4 °C with 5 mL PBS-CM containing 0.5 mg/mL sulfo-NHS-LC-LC-biotin (Pierce) to label surface proteins. Plates were washed with PBS-CM, and then incubated on a rocker for 10 min at 4 °C with 10 mL PBS-CM containing 50 mM NH4Cl (Sigma) to inactivate excess unbound sulfo-NHS-LC-LC-biotin. Plates were washed with PBS-CM. One plate per cell line was then lysed with Triton X-100 lysis buffer for determination of total surface EGFR. The remaining plates were stimulated with 20 mg/mL human recombinant EGF (Sigma) in HMEC starvation medium for the indicated amounts of time to induce receptor internalization. Plates were rinsed with PBS-CM and lysed with Triton X-100 lysis buffer. A portion of each sample was reserved for whole-cell lysates, and the rest was used in streptavidin immunoprecipitation as in the receptor internalization assay.
Genotyping.
Genomic DNA was extracted from 2 to 3 mm of tail tissue by boiling in 150 μL of an alkaline buffer containing 2 mM EDTA and 25 mM NaOH at 100 °C for 60 min, followed by neutralization with 150 μL of a buffer containing 40 mM Tris base. PCR was then performed on the DNA extracts using GoTaq DNA polymerase (Promega) as follows for each gene: Pik3r1, primers 5′-CAC CGA GCA CTG GAG CAC TG-3′ and 5′-CCA GTT ACT TTC AAA TCA GCA CAG-3′, wild-type Pik3r1 allele generates a fragment of 252 bp whereas the floxed Pik3r1 allele generates a 301-bp fragment; NIC transgene, primers 5′-TTC CGG AAC CCA CAT CAG GCC-3′ and 5′-GTT TCC TGC AGC AGC CTA CGC-3′, transgene generates a 630-bp fragment; and MMTV-Cre transgene, primers 5′-CTG ATC TGA GCT CTG AGT G-3′ and 5′-CAT CAC TCG TTG CAT CGA CC-3′, transgene generates a 250-bp fragment. PCR samples were then resolved by electrophoresis through a 2% agarose gel with SYBR Safe (Invitrogen) and visualized under UV light using an AlphaImager EP transilluminator (Alpha Innotech) and the accompanying AlphaView software, version 1.3.0.7.
Mammary Whole-Mount Preparation.
The fourth mammary gland tissue was excised, spread on glass slides, and fixed overnight in Carnoy’s fixative [a 1:3 (vol/vol) solution of glacial acetic acid and 100% ethanol]. Slides were then washed for 30 min in 70% ethanol and 30 min in ddH2O, and then stained overnight in carmine alum [1 g carmine (Sigma) dissolved in 500 mL ddH2O]. Slides were then washed for 30 min in 70% ethanol, 30 min in 95% ethanol, and 30 min in 100% ethanol before being immersed in toluene. Images of fixed mammary tissue were taken with a Nikon SMZ-U dissecting microscope with a SPOT Flex 15.2 64MP Shifting Pixel Camera (Diagnostic Instruments) and the accompanying SPOT advanced software, version 4.5.9.1.
Mouse Mammary Epithelial Cell Isolation.
The third and fourth mammary glands were excised, washed in PBS (Gibco), finely chopped, combined, and digested overnight at 37 °C and 5% CO2 in 5 mL digestion medium [DMEM/F12 GlutaMAX (Gibco) with penicillin/streptomycin (Gibco) and collagenase/hyaluronidase (Stemcell Technologies) added to a final concentration of 1×]. Following digestion, the tissue was pelleted by centrifugation, the supernatant was removed, and the tissue was resuspended in red blood cell lysis buffer [a 1:4 (vol/vol) solution of cold HF solution (Hanks’ balanced salt solution [Stemcell Technologies] with 2% FBS [Gibco] and penicillin/streptomycin [Gibco]) and ammonium chloride (Stemcell Technologies)]. The tissue was pelleted by centrifugation, the supernatant was removed, and the pellet was resuspended in 2 mL prewarmed 0.25% trypsin-EDTA (Gibco) for 1 to 3 min, followed by addition of 3 mL FBS and 10 mL cold HF solution. The tissue was pelleted by centrifugation, the supernatant was removed, and the pellet was resuspended in 1 mL dispase and 100 μL DNaseI (both Stemcell Technologies) for 1 min followed by addition of 5 to 10 mL cold HF solution, and then passed through a 40-μm cell strainer.
Analysis of Mammary Tumors and Lung Metastases.
Cohorts of female mice were examined every 3 d for the onset of tumors, defined by the first palpation. Five weeks after tumor onset, the mice were killed by CO2 in accordance with protocols approved by the Institutional Animal Care and Use Committees of the Dana-Farber Cancer Institute and Harvard Medical School. The total tumor burden per mouse was determined by taking the wet weight of excised mammary tissue and associated tumors. The total number of tumors per mouse was determined by counting the number of distinct excised tumors with a diameter of at least 3 mm. To determine the total number of lung metastases per mouse, lungs were excised and fixed overnight in 10% phosphate-buffered formalin (Fisher). All lung lobes were embedded in paraffin, and three sections 50 μm apart were mounted on slides and stained with hematoxylin and eosin. Metastases were visualized and quantified using a Nikon Eclipse E600 microscope. For each mouse, the total number of lung metastases was taken to be that of the section with the highest count.
Acknowledgments
We thank Drs. A. Toker, J. Blenis, and K. Munger and all members of the J.J.Z. laboratory for critical discussions and technical assistance. This study was supported in part by NIH Grants P50 CA168504 (to T.M.R. and J.J.Z.), CA187918-02 (to T.M.R. and J.J.Z.), R35 CA210057 (to J.J.Z.), CA172461 (to J.J.Z.), GM041890 (to L.C.C.), and R35 CA197588 (to L.C.C.), and Breast Cancer Research Foundation (J.J.Z. and L.C.C.).
Footnotes
The authors declare no conflict of interest.
This article contains supporting information online at www.pnas.org/lookup/suppl/doi:10.1073/pnas.1704706114/-/DCSupplemental.
References
- 1.Vanhaesebroeck B, Vogt PK, Rommel C. PI3K: From the bench to the clinic and back. Curr Top Microbiol Immunol. 2010;347:1–19. doi: 10.1007/82_2010_65. [DOI] [PMC free article] [PubMed] [Google Scholar]
- 2.Yu J, et al. Regulation of the p85/p110 phosphatidylinositol 3′-kinase: Stabilization and inhibition of the p110alpha catalytic subunit by the p85 regulatory subunit. Mol Cell Biol. 1998;18:1379–1387. doi: 10.1128/mcb.18.3.1379. [DOI] [PMC free article] [PubMed] [Google Scholar]
- 3.Thorpe LM, Yuzugullu H, Zhao JJ. PI3K in cancer: Divergent roles of isoforms, modes of activation and therapeutic targeting. Nat Rev Cancer. 2015;15:7–24. doi: 10.1038/nrc3860. [DOI] [PMC free article] [PubMed] [Google Scholar]
- 4.Cheung LW, et al. High frequency of PIK3R1 and PIK3R2 mutations in endometrial cancer elucidates a novel mechanism for regulation of PTEN protein stability. Cancer Discov. 2011;1:170–185. doi: 10.1158/2159-8290.CD-11-0039. [DOI] [PMC free article] [PubMed] [Google Scholar]
- 5.Jaiswal BS, et al. Somatic mutations in p85alpha promote tumorigenesis through class IA PI3K activation. Cancer Cell. 2009;16:463–474. doi: 10.1016/j.ccr.2009.10.016. [DOI] [PMC free article] [PubMed] [Google Scholar]
- 6.Mauvais-Jarvis F, et al. Reduced expression of the murine p85alpha subunit of phosphoinositide 3-kinase improves insulin signaling and ameliorates diabetes. J Clin Invest. 2002;109:141–149. doi: 10.1172/JCI13305. [DOI] [PMC free article] [PubMed] [Google Scholar]
- 7.Luo J, Cantley LC. The negative regulation of phosphoinositide 3-kinase signaling by p85 and its implication in cancer. Cell Cycle. 2005;4:1309–1312. doi: 10.4161/cc.4.10.2062. [DOI] [PubMed] [Google Scholar]
- 8.Ueki K, Algenstaedt P, Mauvais-Jarvis F, Kahn CR. Positive and negative regulation of phosphoinositide 3-kinase-dependent signaling pathways by three different gene products of the p85alpha regulatory subunit. Mol Cell Biol. 2000;20:8035–8046. doi: 10.1128/mcb.20.21.8035-8046.2000. [DOI] [PMC free article] [PubMed] [Google Scholar]
- 9.Barbour LA, et al. Increased P85alpha is a potent negative regulator of skeletal muscle insulin signaling and induces in vivo insulin resistance associated with growth hormone excess. J Biol Chem. 2005;280:37489–37494. doi: 10.1074/jbc.M506967200. [DOI] [PubMed] [Google Scholar]
- 10.Cizkova M, et al. PIK3R1 underexpression is an independent prognostic marker in breast cancer. BMC Cancer. 2013;13:545. doi: 10.1186/1471-2407-13-545. [DOI] [PMC free article] [PubMed] [Google Scholar]
- 11.Taniguchi CM, et al. The phosphoinositide 3-kinase regulatory subunit p85alpha can exert tumor suppressor properties through negative regulation of growth factor signaling. Cancer Res. 2010;70:5305–5315. doi: 10.1158/0008-5472.CAN-09-3399. [DOI] [PMC free article] [PubMed] [Google Scholar]
- 12.Cancer Genome Atlas Network Comprehensive molecular portraits of human breast tumours. Nature. 2012;490:61–70. doi: 10.1038/nature11412. [DOI] [PMC free article] [PubMed] [Google Scholar]
- 13.Cerami E, et al. The cBio Cancer Genomics Portal: An open platform for exploring multidimensional cancer genomics data. Cancer Discov. 2012;2:401–404. doi: 10.1158/2159-8290.CD-12-0095. [DOI] [PMC free article] [PubMed] [Google Scholar]
- 14.Sørlie T, et al. Gene expression patterns of breast carcinomas distinguish tumor subclasses with clinical implications. Proc Natl Acad Sci USA. 2001;98:10869–10874. doi: 10.1073/pnas.191367098. [DOI] [PMC free article] [PubMed] [Google Scholar]
- 15.Sørlie T, et al. Repeated observation of breast tumor subtypes in independent gene expression data sets. Proc Natl Acad Sci USA. 2003;100:8418–8423. doi: 10.1073/pnas.0932692100. [DOI] [PMC free article] [PubMed] [Google Scholar]
- 16.Richardson AL, et al. X chromosomal abnormalities in basal-like human breast cancer. Cancer Cell. 2006;9:121–132. doi: 10.1016/j.ccr.2006.01.013. [DOI] [PubMed] [Google Scholar]
- 17.Ma XJ, Dahiya S, Richardson E, Erlander M, Sgroi DC. Gene expression profiling of the tumor microenvironment during breast cancer progression. Breast Cancer Res. 2009;11:R7. doi: 10.1186/bcr2222. [DOI] [PMC free article] [PubMed] [Google Scholar]
- 18.Zhao JJ, et al. The oncogenic properties of mutant p110alpha and p110beta phosphatidylinositol 3-kinases in human mammary epithelial cells. Proc Natl Acad Sci USA. 2005;102:18443–18448. doi: 10.1073/pnas.0508988102. [DOI] [PMC free article] [PubMed] [Google Scholar]
- 19.Utermark T, et al. The p110α and p110β isoforms of PI3K play divergent roles in mammary gland development and tumorigenesis. Genes Dev. 2012;26:1573–1586. doi: 10.1101/gad.191973.112. [DOI] [PMC free article] [PubMed] [Google Scholar]
- 20.Schmit F, et al. PI3K isoform dependence of PTEN-deficient tumors can be altered by the genetic context. Proc Natl Acad Sci USA. 2014;111:6395–6400. doi: 10.1073/pnas.1323004111. [DOI] [PMC free article] [PubMed] [Google Scholar]
- 21.Miaczynska M. Effects of membrane trafficking on signaling by receptor tyrosine kinases. Cold Spring Harb Perspect Biol. 2013;5:a009035. doi: 10.1101/cshperspect.a009035. [DOI] [PMC free article] [PubMed] [Google Scholar]
- 22.Wagner KU, et al. Cre-mediated gene deletion in the mammary gland. Nucleic Acids Res. 1997;25:4323–4330. doi: 10.1093/nar/25.21.4323. [DOI] [PMC free article] [PubMed] [Google Scholar]
- 23.Ursini-Siegel J, et al. ShcA signalling is essential for tumour progression in mouse models of human breast cancer. EMBO J. 2008;27:910–920. doi: 10.1038/emboj.2008.22. [DOI] [PMC free article] [PubMed] [Google Scholar]
- 24.Taniguchi CM, et al. Phosphoinositide 3-kinase regulatory subunit p85alpha suppresses insulin action via positive regulation of PTEN. Proc Natl Acad Sci USA. 2006;103:12093–12097. doi: 10.1073/pnas.0604628103. [DOI] [PMC free article] [PubMed] [Google Scholar]
- 25.Chagpar RB, et al. Direct positive regulation of PTEN by the p85 subunit of phosphatidylinositol 3-kinase. Proc Natl Acad Sci USA. 2010;107:5471–5476. doi: 10.1073/pnas.0908899107. [DOI] [PMC free article] [PubMed] [Google Scholar]
- 26.Fruman DA, Snapper SB, Yballe CM, Alt FW, Cantley LC. Phosphoinositide 3-kinase knockout mice: Role of p85alpha in B cell development and proliferation. Biochem Soc Trans. 1999;27:624–629. doi: 10.1042/bst0270624. [DOI] [PubMed] [Google Scholar]
- 27.Terauchi Y, et al. Increased insulin sensitivity and hypoglycaemia in mice lacking the p85 alpha subunit of phosphoinositide 3-kinase. Nat Genet. 1999;21:230–235. doi: 10.1038/6023. [DOI] [PubMed] [Google Scholar]
- 28.Chen D, et al. p50alpha/p55alpha phosphoinositide 3-kinase knockout mice exhibit enhanced insulin sensitivity. Mol Cell Biol. 2004;24:320–329. doi: 10.1128/MCB.24.1.320-329.2004. [DOI] [PMC free article] [PubMed] [Google Scholar]
- 29.Ueki K, et al. Increased insulin sensitivity in mice lacking p85beta subunit of phosphoinositide 3-kinase. Proc Natl Acad Sci USA. 2002;99:419–424. doi: 10.1073/pnas.012581799. [DOI] [PMC free article] [PubMed] [Google Scholar]
- 30.Geering B, Cutillas PR, Nock G, Gharbi SI, Vanhaesebroeck B. Class IA phosphoinositide 3-kinases are obligate p85-p110 heterodimers. Proc Natl Acad Sci USA. 2007;104:7809–7814. doi: 10.1073/pnas.0700373104. [DOI] [PMC free article] [PubMed] [Google Scholar]
- 31.LoPiccolo J, et al. Assembly and molecular architecture of the phosphoinositide 3-kinase p85α homodimer. J Biol Chem. 2015;290:30390–30405. doi: 10.1074/jbc.M115.689604. [DOI] [PMC free article] [PubMed] [Google Scholar]
- 32.Luo J, Field SJ, Lee JY, Engelman JA, Cantley LC. The p85 regulatory subunit of phosphoinositide 3-kinase down-regulates IRS-1 signaling via the formation of a sequestration complex. J Cell Biol. 2005;170:455–464. doi: 10.1083/jcb.200503088. [DOI] [PMC free article] [PubMed] [Google Scholar]
- 33.Rabinovsky R, et al. p85 associates with unphosphorylated PTEN and the PTEN-associated complex. Mol Cell Biol. 2009;29:5377–5388. doi: 10.1128/MCB.01649-08. [DOI] [PMC free article] [PubMed] [Google Scholar]
- 34.Quayle SN, et al. Somatic mutations of PIK3R1 promote gliomagenesis. PLoS One. 2012;7:e49466. doi: 10.1371/journal.pone.0049466. [DOI] [PMC free article] [PubMed] [Google Scholar]
- 35.Philp AJ, et al. The phosphatidylinositol 3′-kinase p85alpha gene is an oncogene in human ovarian and colon tumors. Cancer Res. 2001;61:7426–7429. [PubMed] [Google Scholar]
- 36.Luo J, et al. Class IA phosphoinositide 3-kinase regulates heart size and physiological cardiac hypertrophy. Mol Cell Biol. 2005;25:9491–9502. doi: 10.1128/MCB.25.21.9491-9502.2005. [DOI] [PMC free article] [PubMed] [Google Scholar]


