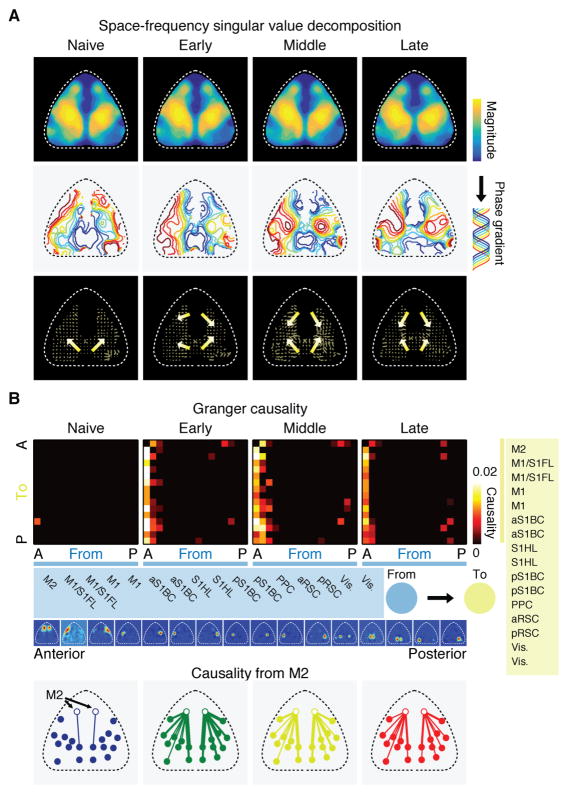
Figure 4. Emergence of a secondary activity flow from anterior cortical areas.
(A) Magnitude (top row) and phase (middle row) of the spatial coherence of activity of the leading mode identified by space-frequency singular value decomposition (SVD) analysis at each learning stage. Phase gradients (from blue to red) indicate the direction of travelling waves. Bottom row, direction of the phase gradients. Arrows and lines indicate the direction and relative speed of activity propagation within each stage, respectively.
(B) Top, matrix of median Granger causality at each learning stage. Direction of causality is indicated by “from” (blue modules) and “to” (yellow modules). Cortical modules were sorted in the antero (A)-posterior (P) direction (names of modules listed in the blue and yellow boxes). Leftmost column in each matrix is causality from M2 to the rest of the cortex. Only causality with p < 0.01 was included after correction for multiple comparisons by false discovery rate. Bottom, spatial map of causality from M2 (open circles) to other brain areas at each learning stage. Line width reflects the magnitude of causality.

