

Abstract
The pentose phosphate pathway (PPP) is thought to be upregulated in trauma (to produce excess NADPH) and in cancer (to provide ribose for nucleotide biosynthesis) but simple methods for detecting changes in flux through this pathway are not available. Magnetic resonance imaging of hyperpolarized 13C-enriched metabolites offers considerable potential as a rapid, non-invasive tool for detecting changes in metabolic fluxes. In this study, hyperpolarized δ-[1-13C]gluconolactone was used as a probe to detect flux through the oxidative portion of the pentose phosphate pathway (PPPox) in isolated perfused mouse livers. The appearance of hyperpolarized H13CO3− within seconds after exposure of livers to HP-δ-[1-13C]gluconolactone demonstrates that this probe rapidly enters hepatocytes, becomes phosphorylated, and enters the PPPox pathway to produce HP-H13CO3− after three enzyme catalyzed steps (6P-gluconolactonase, 6PGDH, and carbonic anhydrase). Livers perfused with octanoate as their sole energy source show no change in production of H13CO3− after exposure to low levels of H2O2, while livers perfused with glucose and insulin showed a 2-fold increase in H13CO3− after exposure to peroxide. This indicates that flux through the PPPox is stimulated by H2O2 in glucose perfused livers but not in livers perfused with octanoate alone. Subsequent perfusion of livers with non-polarized [1,2-13C]glucose followed by 1H NMR analysis of lactate in the perfusate verified that flux through the PPPox is indeed low in healthy livers and modestly higher in peroxide damaged livers. We conclude that hyperpolarized δ-[1-13C]gluconolactone has the potential to serve as a metabolic imaging probe of this important biological pathway.
Keywords: pentose phosphate pathway, isolated mouse liver, 13C NMR, dynamic nuclear polarization, lactone metabolism
Graphical abstract
δ-[1-13C]gluconolactone was polarized using standard DNP methods as used as a probe of the oxidative portion of pentose phosphate pathway (PPPox). The appearance of hyperpolarized H13CO3− within seconds after exposure of livers to the probe demonstrates that it is rapidly transported into hepatocytes and phosphorylated, enters the PPPox and produces H13CO3− after three enzyme catalyzed steps. This new probe has the potential to serve as a metabolic imaging probe of this important biological pathway.

1. Introduction
The pentose phosphate pathway (PPP) is an important pathway in glycolytic tissues. It consists of an oxidative portion (PPPox) that produces NADPH in two oxidative steps during the conversion of glucose-6-phosphate to ribulose-5-phosphate followed by a non-oxidative portion (PPPnon) that yields ribose-5-phosphate plus several other carbohydrates needed as biosynthetic precursors. Flux through the PPPox has been shown to be stimulated in head trauma, in cancer, and in tissues requiring continuous regeneration of glutathione, but simple methods for measuring flux of glucose through this pathway are limited. Relative flux through the PPPox has been measured using radioactive tracer studies,1–11 mass spectral analyses12–21 and NMR analyses.22–27 Net flux through the PPPox has been most often assessed by administration of [1,2-13C2]glucose and detection of singly-labeled lactate.14,15,17,26,27 δ-Gluconolactone, which exists in equilibrium with γ-gluconolactone in aqueous media (Scheme 1), enters mammalian cells via glucose transporters and phosphorylated by gluconokinase (EC 2.7.1.12) to 6-phospho-δ-gluconolactone, an intermediate in the PPPox.28 Based on metabolic data obtained with 14C labeled glucose and ribose in rabbit liver,29 flux through the PPPox appears to be fast enough to allow detection of flux through this pathway within a time frame of 1–2 minutes. This makes δ-[1-13C]gluconolactone an attractive tracer for hyperpolarized 13C studies of the PPPox because the 13C atom in this derivative would be released as 13CO2 in the second oxidative step of this pathway. Each intermediate and 13CO2/HCO3− are predicted to have a reasonably long T1 values and so potentially can be detected by 13C MRS for several minutes after injection of hyperpolarized δ-[1-13C]gluconolactone. This presents a unique opportunity to measure the flux through the PPPox by monitoring production of HP HCO3− by 13C NMR. It is worth noting that the uptake of HP δ-[1-13C]gluconolactone will be in competition with the total glucose uptake but the rate of HP 13CO2 production, as detected by HP H13CO3−, should in principle reflect relative flux through the PPPox (Scheme 2). It has been shown that hydrolysis of CO2 to HCO3− catalyzed by carbonic anhydrase is extremely rapid under physiological conditions30,31 so cannot be rate limiting in the production of HCO3− from [1-13C]gluconolactone. Here, we examined the use of HP-δ-[1-13C]gluconolactone to detect flux through PPPox by detection of HP H13CO3− in control livers and in livers pre-exposed to hydrogen peroxide to stimulate flux through this pathway. Since NMR is a non-invasive technique, translation of this method into a clinical setting may allow detection of tissues with an active PPPox pathway after a single injection of HP δ-[1-13C]gluconolactone.
Scheme 1.

Structures of δ-gluconolactone and γ-gluconolactone which interconvert in aqueous solution.
Scheme 2.

The oxidative branch of the pentose phosphate pathway (PPPox).
2. Materials and Methods
[1-13C]Glucose (99 % enriched) was purchased from Cambridge Isotope Laboratories (Andover, MA) and used without further purification. The trityl radical, tris[8-carboxyl-2,2,6,6-tetra-[2-(1-hydroxyethyl)]-benzo-(1,2-d:4,5-d)-bis-(1,3)-dithiole-4-yl]-methyl sodium salt, was purchased from Oxford Molecular Biotools Ltd. (Abingdon, Oxfordshire, UK) and used without further purification. All other chemicals were obtained from Sigma-Aldrich (St. Louis, MO) at the highest quality available. Female C57BL/6 mice (20–25 g) were obtained from Charles River Laboratories (Wilmington, MA) and fed ad libitum prior to experimentation. The studies were performed under a protocol approved by the Institutional Animal Care and Use Committee at the University of Texas Southwestern Medical Center. Liver enzyme assays, alanine aminotransferase and aspartate aminotransferase, were performed by the Mouse Metabolic Phenotyping Core at the University of Texas Southwestern Medical Center.
δ-[1-13C]Gluconolactone was synthesized following the procedure reported for the unlabeled compound.32 A mixture of [1-13C]glucose (1.0 g) and Shvo’s catalyst (200 mg) in cyclohexanone (25 mL) was stirred at 50 °C (bath temperature) for 24 hours under argon. The orange reaction mixture was cooled to room temperature and the precipitate was filtered on a Schlenk filter under nitrogen. The precipitate was washed with cyclohexanone (5 mL) and acetone (3 × 10 mL) and dried in a stream of nitrogen to give the desired product, δ-[1-13C]gluconolactone, as a white powder (0.70 g, 71 % yield). 13C{1H} NMR (150 MHz, D2O, δ) 173.80 ppm (C1, s), 81.58 ppm (C3, s), 72.74 ppm (C5, s), 70.95 ppm (C4, s), 67.08 ppm (C2, s), 60.06 ppm (C6, s); MS (ESI) mass calculated for 12C513C1H10O6 = 179.1; Found = 178.0 [M–H]–.
The spin-lattice relaxation times (T1) of carbon-1 of γ- and δ-[1-13C]gluconolactone and [1-13C]gluconate were measured at 9.4 T. The T1 of gluconate was determined on a non-polarized sample using a conventional inversion recovery pulse sequence [d-180º-τ-90º-acquisition] with various τ times. The T1 values of γ- and δ-[1-13C]gluconolactone were determined by fitting the decay of each hyperpolarized signal to:33
where S(τ) is the signal intensity, Mp is the Z magnetization at time = 0, θ is the pulse width, τ is time, and TR is the total repetition time. The measured T1’s of hyperpolarized γ- and δ-[1-13C]gluconolactone were 19.9 and 17.8 sec, respectively, while the T1 of non-polarized [1-13C]gluconate was 17.3 sec. All measurements were done at 9.4T. Given that δ-[1-13C]gluconolactone and γ-[1-13C]gluconolactone were exchanging during the decay process, these values can only be considered “apparent” T1 values. An early report on the kinetics of this interconversion demonstrated that this exchange reaches equilibrium in water only after ~25–30 s.49 It is also interesting to note that [1-13C]gluconate does not appear to be an intermediate in this exchange reaction so it is safe to assume that once [1-13C]gluconate is formed in tissue, it does not spontaneously convert to either γ- or δ-[1-13C]gluconolactone.49
δ-[1-13C]Gluconolactone was polarized using an Oxford HyperSense® DNP polarizer. This instrument is a “second generation” device designed for routine operation in a research lab setting.34 It is equipped with a 3.35 Tesla superconducting magnet, a microwave source, a solid state nuclear magnetic resonance (NMR) spectrometer for monitoring polarization build up, and a rapid dissolution system for transporting the sample from the HyperSense to a 400 MHz NMR spectrometer for spectroscopy and imaging. ~9 mg of δ-[1-13C]gluconolactone was dissolved in a (3:1) water:glycerol mixture doped with the trityl radical at 15 mM. The frozen sample was lowered into the magnetic field, cooled to 1.4 K in a pumped helium bath and the microwave irradiation was turned on. After maximal polarization was achieved (1–2 hours), the irradiation was turned off and the sample was rapidly dissolved using 4 mL of hot (> 190 °C) PBS (10 mM, pH ~ 7.4) and transferred into the bore of an 89 mm vertical 9.4 T NMR spectrometer for spectral acquisition. For tissue experiments, the hyperpolarized solution was introduced into the perfusate chamber directly above a perfused liver via a catheter running to the top of the perfusion rig. The average 13C signal enhancement of HP-δ-[1-13C]gluconolactone observed a few seconds after dissolution and placement into a 9.4T magnet was 7200; this corresponds to a polarization level of 5.6%.
Livers isolated from C57BL/6 lab mice were perfused in an all glass perfusion system that fits entirely into the bore of an 89 mm vertical bore 9.4 T NMR spectrometer. Mice were anesthetized by an intramuscular injection (0.1 mL) of ketamine (Fort Dodge Animal Health)/xylazine (Boehringer Ingelheim) in a ratio of 85:15. Once anesthetized, a midline laparotomy was performed to expose the hepatic portal vein which was cannulated and injected with heparin (50 IU) to prevent blood clots. The hepatic vein and inferior vena cava were dissected, and flow of perfusate through portal vein was established using a peristaltic pump at ~ 8 mL/min. The excised liver was suspended in a 20 mm NMR tube attached to the perfusion apparatus maintained at 37 °C and perfused at a rate of 8 mL/min with a standard non-recirculating buffered medium (described below) and bubbled continuously with (19:1) O2/CO2. Efferent and afferent pO2 was measured using a blood gas analyzer (GEM Premier 3000, Instrumentation Laboratory, Lexington, MA, USA) to determine oxygen consumption.35 Hepatic viability was evaluated by oxygen consumption measurements and visual inspection. The perfusion apparatus equipped with twin chambers, water jacketed for temperature control and protected by a polycarbonate outer shell was lowered into the bore of the 9.4T wide-bore magnet. The perfusion pressure was adjusted to maintain an adequate perfusion flow through the portal vein. Hyperpolarized substrates were introduced through polyethylene tubing that terminated near the portal vein catheter. A schematic diagram of the apparatus is shown in supplementary materials.
Livers from either 15 h fasted mice or mice given full access to chow ad libitum were perfused with a modified Krebs-Henseleit (KH) medium containing (in mM): NaHCO3 (25), NaCl (118), KCl (4.7), MgSO4 (1.2), KH2PO4 (1.2), CaCl2 (1.25). The perfusate presented to fasted livers also contained sodium octanoate (0.4 mM) as the only carbon energy source. Sodium octanoate was chosen because this intermediate chain-length fatty acid is avidly utilized by tissues, does not require carnitine for transport into mitochondria, and thereby insures that the livers remain in a highly reduced oxidation state. Our hypothesis was that octanoate would supply excess NADH through β-oxidation and any excess reducing equivalents would be cycled into the pool of NADPH via transhydrogenase enzymes (NADPH:NAD+ oxidoreductase) to replenish NADP+ during exposure of these livers to H2O2. Thus, flux through the PPPox is predicted to be low in livers perfused with octanoate before and after exposure to H2O2. Conversely, in livers from fed mice perfused with 10 mM glucose ± insulin (240 μU/mL) as their only carbon energy source, we hypothesized that flux through the PPPox would, by necessity, be stimulated to replenish NADPH in livers exposed to H2O2.
After positioning each liver in a 20-mm NMR tube, the viability of the organ preparation was first confirmed by flow rate and O2 consumption measurements before the liver was placed in the bore of a Varian VNMRS 9.4 T magnet. During a preparation and stabilization time of approximately 20 min, the NMR probe was tuned and the field homogeneity optimized using the 23Na free induction decay. A 23Na line width of 15 Hz or less was typically obtained. 13C NMR spectra were acquired at ~ 100 MHz in a 25 mm Doty broadband probe using 66° pulses. Livers exposed to H2O2 were initially exposed to a perfusate lacking H2O2 during a preparation and stabilization period required for O2 consumption measurements, probe tuning, and sample shimming. Following shimming, the perfusate was switched to one containing H2O2 for the remainder of the experiment. After 10–13 min of peroxide exposure, 8 mL of 4 mM HP δ-[1-13C]gluconolactone was injected into the perfusion chamber directly above the cannulation site over a period of ~ 30 s. Serial FIDs were acquired immediately after injection of the HP substrate using 16 K complex data points over a ± 32,000 Hz bandwidth without proton decoupling to yield an acquisition time of ~ 1 s and a delay of 4.0 s, giving a repetition time of 5 s for each scan. Typically 20 separate FIDs were collected. These data were zero-filled prior to Fourier transformation and the relative peak areas were measured by integration using the ACDLabs SpecManager version 12.00 (Advanced Chemistry Development, Inc.; Toronto, Canada).
The relative activity of the PPPox pathway was also assessed in fed livers perfused with non-polarized 10 mM [1,2-13C]glucose and insulin (240 μU/mL), with or without exposure to H2O2. These livers were isolated and perfused on the bench using an identical protocol as that described for hyperpolarization experiments. After 30 minutes of perfusion, the livers were freeze-clamped and all water soluble metabolites were extracted into cold perchloric acid. Samples were reconstituted in D2O and high resolution 1H spectra were collected at 14.1 T.
All data are reported as mean ± 1 s.d. Statistical significance was determined by a two-tailed t-test using GraphPad Prism version 5.03 (GraphPad Prism Software, Inc, La Jolla, CA). All results are reported at the 95 % confidence level.
3. Results
Figure 1 shows stacked plots of 13C NMR spectra of a mouse liver immediately after addition of 4 mM HP δ-[1-13C]gluconolactone to an aqueous perfusate feeding the liver. Four resonances were observed and assigned to 6-phospho-[1-13C]gluconate (178.6 ppm), 6-phospho-γ-[1-13C]gluconolactone (177.0 ppm), 6-phospho-δ-[1-13C]gluconolactone (173.8 ppm), and H13CO3− (160.3 ppm) by comparisons with known standards. To evaluate which of these species resulted from metabolism of HP δ-[1-13C]gluconolactone by liver, a 13C spectrum of HP δ-[1-13C]gluconolactone injected into aqueous perfusate (no liver) is compared in Figure 2. In this case, the resonances of δ-[1-13C]gluconolactone and γ-[1-13C]gluconolactone were both observed but those of [1-13C]gluconate and H13CO3− were not observed. This indicates that these two metabolites were generated by metabolism of HP-δ-[1-13C]gluconolactone in liver. Both metabolites are products of the PPPox pathway. Given that the chemical shifts of these intermediates are likely insensitive to the presence of a phosphate group at position C6 and the fact that the resonance at 178.6 ppm is much larger in the liver spectrum, this resonance must reflect the phosphorylated product, 6-phospho-[1-13C]gluconate. Similarly, since 6-phospho-[1-13C]gluconate is a metabolic product of 6-phospho-δ-[1-13C]gluconolactone and H13CO3− is a metabolic product of 6-phospho-[1-13C]gluconate, we conclude that all three carbohydrate intermediates detected by 13C NMR in livers must be 6-phospho derivatives of these sugars.
Figure 1.

A stack plot of 13C NMR spectra collected on an isolated mouse liver after continuous addition of hyperpolarized δ-[1-13C]gluconolactone to the perfusion media flowing into the portal vein of the liver at 8 mL/min. The 13C spectra collected every 5 sec using a 66° pulse. The resonance assignments are described in the text.
Figure 2.
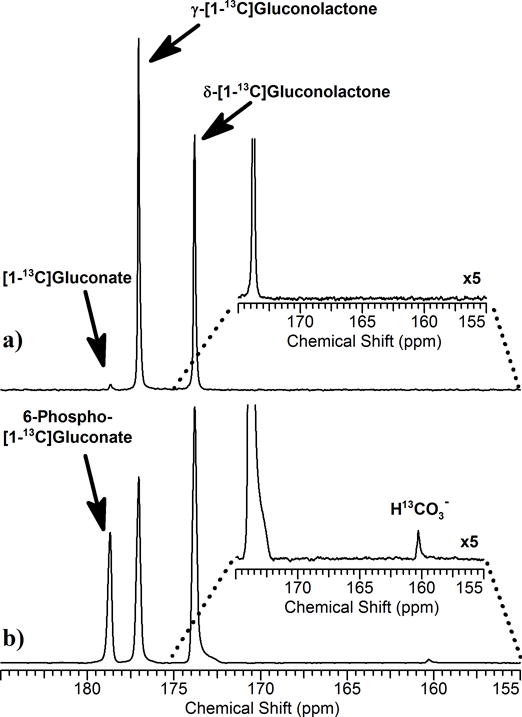
13C NMR spectra of hyperpolarized δ-[1-13C]gluconolactone injected into a) a NMR tube containing perfusion medium or b) an isolated perfused mouse liver as shown in Figure 1. Both spectra reflect summed 10 summed spectra collected over 50 s. The insets show expansion of the bicarbonate region (155 – 175 ppm).
A comparison of the summed total intensity of the HP-H13CO3− resonances in 20 spectra collected over 50 s for four different liver groups is shown in Figure 3a. These data show than production of HP-H13CO3− in livers perfused with octanoate alone was unaltered by addition of 1% H2O2 while in livers perfused with glucose plus insulin alone, HP-H13CO3− production was about 50% lower in the absence of H2O2 but returned to basal levels after addition of H2O2. In comparison, Figure 3b shows that production of 6-phospho-[1-13C]gluconate was constant in all four groups of livers. This indicates that the oxidative reaction that produces NADPH (6PGDH) is rate limiting in this portion of the PPPox pathway, while rate of production of 6PG from δ-[1-13C]gluconolactone is independent of both physiology (octanoate versus glucose perfusions) and any oxidative tissue damage caused by H2O2.
Figure 3.

a) Fraction of the summed areas of the HP-HCO3− signal over 50 s relative to the total area of all HP 13C signals. b) Fraction of the summed area of the HP-6-phosphogluconate signal over 50 s relative to the total area of all HP 13C signals. c) The ratio of HP-HCO3− / HP-6PG signals (AUC) as an index of PPPox. The black column represents livers perfused with octanoate without H2O2; the dark grey column reflects livers perfused with octanoate plus 1% H2O2; the light grey column reflects livers perfused with glucose plus insulin without H2O2; the striped column reflects livers perfused with glucose plus insulin plus 1% H2O2. All data are reported as the mean ± 1 s.d. for four livers in each group. P = 0.02 for * comparisons in Fig. 3a; P = 0.03 for * comparisons in Fig. 3b.
The kinetic rates of production of 6PG and H13CO3− from δ-[1-13C]gluconolactone in liver are compared in Figure 4. While the temporal appearance of HP-6PG did not differ significantly among the four groups (Figure 4b), the signal of HP-HCO3− appeared more rapidly and reached a higher amplitude in the livers perfused with octanoate compared to livers perfused with glucose plus insulin (Figure 4a). This provides further evidence that flux through 6PGDH is rate limited in livers perfused with glucose plus insulin but not rate limited in livers perfused with octanoate.
Figure 4.

Time-dependent changes in a) the HP-HCO3− and b) HP-6PG after presenting HP δ-[1-13C]gluconolactone to isolated, perfused livers. (
 ) perfused with octanoate; (
 ) perfused with octanoate plus H2O2; (
 ) perfused with glucose plus insulin; (
 ) perfused with glucose plus insulin plus H2O2. Each data point reflects the mean ± 1 s.d. at that time point for n=4 livers in each group.
To validate that flux through the PPPox was indeed active in livers perfused with glucose, a separate group of livers from fed mice were perfused on the bench with [1,2-13C2]glucose plus insulin for 30 min followed by freeze-clamping, tissue extraction and 1H NMR. In this series, direct evidence for flux through the PPPox was shown by the ratio of [3-13C]lactate to [2,3-13C2]lactate in the 1H NMR spectrum of tissue extracts. [2,3-13C2]lactate reflects direct conversion of [1,2-13C]glucose to lactate without passage through PPPox while [3-13C]lactate reflects metabolism of [1,2-13C2]glucose through PPPox to produce [1-13C]ribulose-5-phosphate followed by carbon-carbon rearrangements in the PPPnon to produce either [1-13C]- or [3-13C]fructose-6-phosphate and ultimately [1-13C] or [3-13C]lactate. Representative 1H spectra of tissue extracts of control and H2O2 treated livers perfused with [1,2-13C2]glucose indicate that [2,3-13C2]lactate and [3-13C]lactate are present in both groups of livers. The ratio of [3-13C]lactate/[2,3-13C]lactate is relatively small in both spectra consistent with about ~5% of glucose passing through the PPPox. Although the amount of [2,3-13C]lactate appears to be slightly lower in spectra of livers perfused with H2O2 (consistent lower flux through the PPPox as reported by the HP studies), this difference did not reach statistical significance.
4. Discussion
Flux through the oxidative portion of the pentose phosphate pathway (PPPox) has been reported to be as low as 1% of glycolytic flux in glial cells20 to as high as 23% in rat livers.4,5 Absolute PPPox flux has been reported to be between 0.20 – 0.40 μmol/min/g wet weight in the rat liver4,5,36,37 under basal conditions, about 20 % of glycolytic flux.4,5,38 After an oxidative insult, flux through the PPPox typically increases to produce NADPH to replenish the reduced form of glutathione (GSH). For example, Dusick et al infused [1,2-13C]glucose into patients suffering from a traumatic brain injury to determine PPPox flux by collecting blood samples and analyzing the lactate by gas-chromatography/mass spectrometry.17 An increase of 7–20% of total glycolytic flux through the PPPox was observed in patients with brain injury compared to non-injured patients. Traditionally, measurement of the PPPox flux has been determined by measuring 14CO2 production or from the labeling patterns in lactate caused by the co-infusion of [1-14/13C]glucose and [6-14/13C]glucose or infusion of [1,2-13C2]glucose.3–5,7–11,13–15,17–21,26,27,39,40 These studies typically need hours to produce sufficient label through the PPPox to properly assay its flux. Hence, a HP probe that could potentially provide a quick readout of increase flux through the PPPox would be of interest.
In the current study, exposure of HP δ-[1-13C]gluconolactone to livers resulted in generation of HP H13CO3− as detected by 13C NMR. In this case, HP H13CO3− could only have been generated via decarboxylation of HP 6-phospho-[1-13C]gluconate, a reaction catalyzed by 6PGDH in the PPPox pathway (Scheme 2). The bicarbonate fraction of total 13C HP signal in livers perfused with octanoate was identical to that seen in livers perfused with glucose and insulin after exposure to H2O2 (Figure 3) but the temporal dependence of the HP signals differed (Figure 4). The initial rate of appearance of HP HCO3− in livers from fasted animals perfused with octanoate with or without H2O2 was more rapid, reached higher maximum intensity, then dropped off more rapidly compared to all other groups. This can be ascribed to less competition between HP δ-[1-13C]gluconolactone and any endogenous glucose for metabolism in the PPPox. The fact that flux through PPPox in livers perfused with octanoate did not increase with addition of H2O2 suggests that this medium-chain length fatty acid supplies sufficient reducing equivalents to maintain cellular redox levels without stimulating the PPPox. This is reflected by the identical ratio of HP-bicarbonate/HP-6PG measured in livers perfused with octanoate ± H2O2 (Figure 3c). The data show that the kinetics of appearance of 6PG was identical in all four groups indicating that the activity of 6-phosphogluconolactonase is insensitive to perfusion conditions. 6PG is known to be an allosteric activator of PFK41–44 and PK45,46 so in livers perfused with octanoate but no glucose, the amount of available 6PG would be limited to that formed from HP-6-phospho-δ-gluconolactone plus small amounts generated from endogenous stores of glucose. In livers perfused with glucose plus insulin, one can assume that additional 6PG would be produced from non-polarized glucose in addition to that produced from HP-6-phospho-δ-[1-13C]gluconolactone, so higher levels of 6PG would stimulate glycolysis without necessarily stimulating flux through the PPPox pathway. In fact, in those livers, net flux through the PPPox as measured by the ratio of HP-bicarbonate/HP-6PG was lower by ~50% compared to the other groups. This was the only metabolic condition that resulted in an increase in flux through the PPPox after addition of H2O2 as detected by generation of HP-HCO3−. In experiments designed to validate the HP results using non-polarized [1,2-13C]glucose plus insulin (Figure 5), PPPox flux was also found to be low (< 5%) under basal perfusion conditions. Although addition of H2O2 to those livers tended to decrease the amount of [2,3-13C]lactate compared to [3-13C]lactate, this decrease did not reach statistical significance. This suggests that the HP measurement is more sensitive to small changes in PPPox than is the steady-state measurement of flux from [1,2-13C]glucose to lactate. One should note that other mono-labeled glucose derivatives could in principle be formed in these experiments as a result of 13C-enriched intermediates leaving the TCA cycle via pyruvate cycling. This contribution would reduce the estimate of PPPox flux activity even lower than suggested by the 1H NMR measurements.
Figure 5.
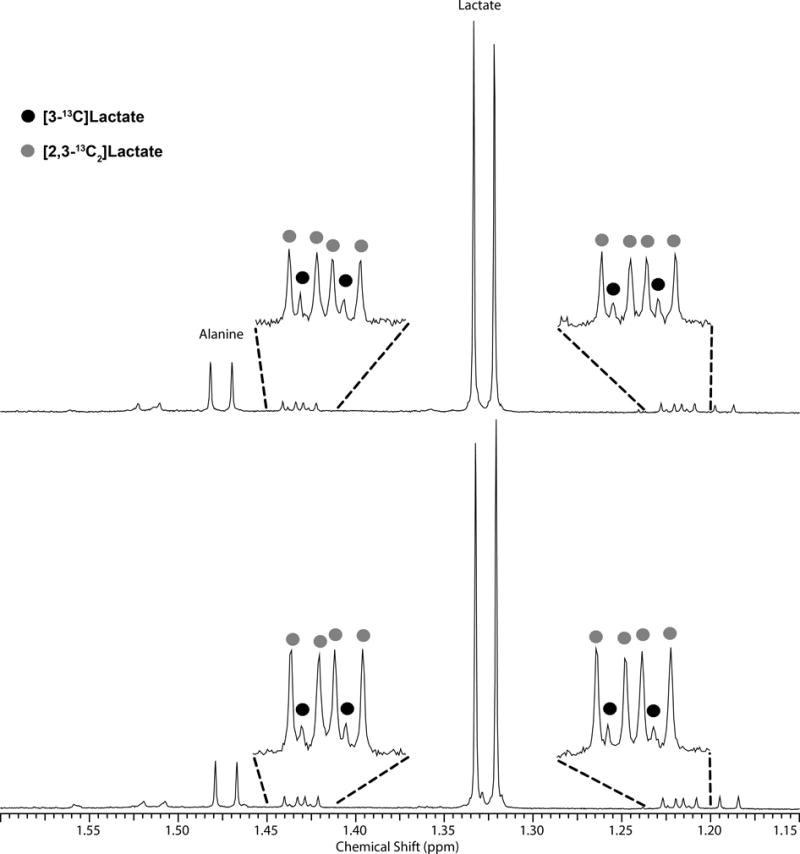
1H spectra of isolated mouse livers perfused with [1,2-13C2]glucose plus insulin. Top spectrum: Liver exposed to 1 mM H2O2. Bottom spectrum: Control liver. The majority of lactate produced during the perfusion period was not enriched in 13C. The small wings around the large unlabeled lactate doublet at 1.33 ppm show that small amounts of [2,3-13C]lactate and [3-13C]lactate are both present.
From a biological perspective, an imaging method for detecting flux through 6-phosphogluconate dehydrogenase (6PGDH) should reflect flux through the entire oxidative portion of the pentose phosphate pathway (PPPox). Although the HP method presented here has been shown to be sensitive to changes in relative flux rates through the PPPox, one cannot obtain absolute flux values in units of μmol/min/gww of tissue nor can it report the percent of total glucose contributing to glycolysis that bifurcates through the PPPox pathway first. We made no attempt to fit the kinetic curves of Figure 4 to a kinetic model largely because the conversion of HP-δ-[1-13C]gluconolactone to HP-bicarbonate involves four enzyme-catalyzed steps, gluconokinase, 6P-gluconolactonase, 6PGDH, and carbonic anhydrase so obtaining quantitative kinetic constants for each of these steps would require may assumptions that we cannot currently justify. Given that other investigators have demonstrated model-free area-under-the-curve (AUC) measurements may work equally well for analysis of kinetic HP data,47 our initial observations here suggest that that the ratio of AUC’s for bicarbonate/6PG appears to be sensitive to changes in flux through the PPPox at least in this limited data set. Further studies will be necessary to test whether HP-δ-[1-13C]gluconolactone is a generally useful probe of the PPPox pathway in other tissues and in vivo.
Supplementary Material
Acknowledgments
This study was supported by grants from the National Institutes of Health (EB015908 and HL034557) and the Robert A. Welch Foundation (AT-584). Angela Milde and Charles Storey provided outstanding technical support. We appreciate expert advice by William Mander from Oxford Instrument Molecular Biotools and Beverley Huet from the Division of Biostatistics at the University of Texas Southwestern Medical Center.
Abbreviations
- PPP
pentose phosphate pathway
- PPPox
oxidative branch of the PPP
- MRS
magnetic resonance spectroscopy
- MRI
magnetic resonance imaging
- DNP
dynamic nuclear polarization
- HP
hyperpolarized/hyperpolarization
- ppm
parts per million
- KH
Krebs-Henseleit
- 6PG
6-phosphogluconate
- 6PGDH
6-phosphogluconate dehydrogenase
- PDH
pyruvate dehydrogenase
- PEPCK
phosphoenolpyruvate carboxykinase
- PFK
phosphofructokinase
- PK
pyruvate kinase
References
- 1.Hostetler KY, Landau BR. Estimation of the pentose cycle contribution to glucose metabolism in tissue in vivo. Biochemistry. 1967;6(10):2961–2964. doi: 10.1021/bi00862a001. [DOI] [PubMed] [Google Scholar]
- 2.Hostetler KY, Landau BR, White RJ, Albin MS, Yashon D. Contribution of the pentose cycle to the metabolism of glucose in the isolated, perfused brain of the monkey. J Neurochem. 1970;17(1):33–39. doi: 10.1111/j.1471-4159.1970.tb00499.x. [DOI] [PubMed] [Google Scholar]
- 3.Lazo PA. Amino acids and glucose utilization by different metabolic pathways in ascites tumor cells. Eur J Biochem. 1981;117(1):19–25. doi: 10.1111/j.1432-1033.1981.tb06297.x. [DOI] [PubMed] [Google Scholar]
- 4.Reinke LA, Tupper JS, Smith PR, Sweeny DJ. Diminished pentose cycle flux in perfused livers of ethanol-fed rats. Mol Pharmacol. 1987;31(6):631–637. [PubMed] [Google Scholar]
- 5.Kuehn A, Scholz R. Rates of flux through the pentose cycle in perfused rat liver. A procedure for the calculation of rates of substrate flux from 14CO2 production from [1-14C]glucose. Eur J Biochem. 1982;124(3):611–617. doi: 10.1111/j.1432-1033.1982.tb06638.x. [DOI] [PubMed] [Google Scholar]
- 6.Gaitonde MK, Evison E, Evans GM. The rate of utilization of glucose via hexose monophosphate shunt in brain. J Neurochem. 1983;41(5):1253–1260. doi: 10.1111/j.1471-4159.1983.tb00819.x. [DOI] [PubMed] [Google Scholar]
- 7.Harkonen MHA, Kauffman FC. Metabolic alteration in the axotomized superior cervical ganglion of the rat. II. Pentose phosphate pathway. Brain Res. 1974;65(1):141–157. doi: 10.1016/0006-8993(74)90341-2. [DOI] [PubMed] [Google Scholar]
- 8.Krass ME, LaBella FS. Oxidation of glucose-1-14C and -6-14C by hormone-synthesizing and hormone-secreting portions of neurohypophysial neurons. Mol Pharmacol. 1965;1(3):306–311. [PubMed] [Google Scholar]
- 9.Krass ME, LaBella FS. Hexosemonophosphate shunt in endocrine tissues. Quantitative estimation of the pathway in bovine pineal body, anterior pituitary, posterior pituitary, and brain. Biochim Biophys Acta, Gen Subj. 1967;148(2):384–391. doi: 10.1016/0304-4165(67)90134-1. [DOI] [PubMed] [Google Scholar]
- 10.Guerra RM, Melgar E, Villavicencio M. Alternative pathways of glucose metabolism in fetal rat brain. Biochim Biophys Acta, Gen Subj. 1967;148(2):356–361. doi: 10.1016/0304-4165(67)90131-6. [DOI] [PubMed] [Google Scholar]
- 11.DiPietro D, Weinhouse S. Glucose oxidation in rat-brain slices and homogenates. Arch Biochem Biophys. 1959;80:268–282. [Google Scholar]
- 12.Metallo CM, Walther JL, Stephanopoulos G. Evaluation of 13C isotopic tracers for metabolic flux analysis in mammalian cells. J Biotechnol. 2009;144(3):167–174. doi: 10.1016/j.jbiotec.2009.07.010. [DOI] [PMC free article] [PubMed] [Google Scholar]
- 13.Lee WN, Boros LG, Puigjaner J, Bassilian S, Lim S, Cascante M. Mass isotopomer study of the nonoxidative pathways of the pentose cycle with [1,2-13C2]glucose. Am J Physiol – Endocrinol Metab. 1998;274(5 Pt 1):E843–851. doi: 10.1152/ajpendo.1998.274.5.E843. [DOI] [PubMed] [Google Scholar]
- 14.Boros LG, Bassilian S, Lim S, Lee WN. Genistein inhibits nonoxidative ribose synthesis in MIA pancreatic adenocarcinoma cells: a new mechanism of controlling tumor growth. Pancreas. 2001;22(1):1–7. doi: 10.1097/00006676-200101000-00001. [DOI] [PubMed] [Google Scholar]
- 15.Boros LG, Lerner MR, Morgan DL, et al. [1,2-13C2]-D-glucose profiles of the serum, liver, pancreas, and DMBA-induced pancreatic tumors of rats. Pancreas (Hagerstown, MD, U S) 2005;31(4):337–343. doi: 10.1097/01.mpa.0000186524.53253.fb. [DOI] [PubMed] [Google Scholar]
- 16.Maier K, Hofmann U, Reuss M, Mauch K. Identification of metabolic fluxes in hepatic cells from transient 13C-labeling experiments: part II. Flux estimation. Biotechnol Bioeng. 2008;100(2):355–370. doi: 10.1002/bit.21746. [DOI] [PubMed] [Google Scholar]
- 17.Dusick JR, Glenn TC, Lee WNP, et al. Increased pentose phosphate pathway flux after clinical traumatic brain injury: a [1,2-13C2]glucose labeling study in humans. J Cereb Blood Flow Metab. 2007;27(9):1593–1602. doi: 10.1038/sj.jcbfm.9600458. [DOI] [PubMed] [Google Scholar]
- 18.Ross BD, Kingsley PB, Ben-Yoseph O. Measurement of pentose phosphate-pathway activity in a single incubation with [1,6-13C2,6,6-2H2]glucose. Biochem J. 1994;302(1):31–38. doi: 10.1042/bj3020031. [DOI] [PMC free article] [PubMed] [Google Scholar]
- 19.Ben-Yoseph O, Camp DM, Robinson TE, Ross BD. Dynamic measurements of cerebral pentose phosphate pathway activity in vivo using [1,6-13C2,6,6-2H2]glucose and microdialysis. J Neurochem. 1995;64(3):1336–1342. doi: 10.1046/j.1471-4159.1995.64031336.x. [DOI] [PubMed] [Google Scholar]
- 20.Ben-Yoseph O, Boxer PA, Ross BD. Noninvasive assessment of the relative roles of cerebral antioxidant enzymes by quantitation of pentose phosphate pathway activity. Neurochem Res. 1996;21(9):1005–1012. doi: 10.1007/BF02532410. [DOI] [PubMed] [Google Scholar]
- 21.Ben-Yoseph O, Boxer PA, Ross BD. Assessment of the role of the glutathione and pentose phosphate pathways in the protection of primary cerebrocortical cultures from oxidative stress. J Neurochem. 1996;66(6):2329–2337. doi: 10.1046/j.1471-4159.1996.66062329.x. [DOI] [PubMed] [Google Scholar]
- 22.Delgado TC, Castro MM, Geraldes CF, Jones JG. Quantitation of erythrocyte pentose pathway flux with [2-13C]glucose and 1H NMR analysis of the lactate methyl signal. Magn Reson Med. 2004;51(6):1283–1286. doi: 10.1002/mrm.20096. [DOI] [PubMed] [Google Scholar]
- 23.Laughlin MR, Thompson D. The regulatory role for magnesium in glycolytic flux of the human erythrocyte. J Biol Chem. 1996;271(46):28977–28983. doi: 10.1074/jbc.271.46.28977. [DOI] [PubMed] [Google Scholar]
- 24.Schrader MC, Simplaceanu V, Ho C. Measurement of fluxes through the pentose phosphate pathway in erythrocytes from individuals with sickle cell anemia by carbon-13 nuclear magnetic resonance spectroscopy. Biochim Biophys Acta, Mol Basis Dis. 1993;1182(2):179–188. doi: 10.1016/0925-4439(93)90139-r. [DOI] [PubMed] [Google Scholar]
- 25.Schrader MC, Eskey CJ, Simplaceanu V, Ho C. A carbon-13 nuclear magnetic resonance investigation of the metabolic fluxes associated with glucose metabolism in human erythrocytes. Biochim Biophys Acta, Mol Basis Dis. 1993;1182(2):162–178. doi: 10.1016/0925-4439(93)90138-q. [DOI] [PubMed] [Google Scholar]
- 26.Bartnik BL, Sutton RL, Fukushima M, Harris NG, Hovda DA, Lee SM. Upregulation of pentose phosphate pathway and preservation of tricarboxylic acid cycle flux after experimental brain injury. J Neurotrauma. 2005;22(10):1052–1065. doi: 10.1089/neu.2005.22.1052. [DOI] [PubMed] [Google Scholar]
- 27.Bartnik BL, Lee SM, Hovda DA, Sutton RL. The fate of glucose during the period of decreased metabolism after fluid percussion injury: a 13C NMR study. J Neurotrauma. 2007;24(7):1079–1092. doi: 10.1089/neu.2006.0210. [DOI] [PubMed] [Google Scholar]
- 28.Leder IG. Hog kidney gluconokinase. J Biol Chem. 1957;225(1):125–136. [PubMed] [Google Scholar]
- 29.Williams JF, Rienits KG, Schofield PJ, Clark MG. The pentose phosphate pathway in rabbit liver. Studies on the metabolic sequence and quantitative role of the pentose phosphate cycle by using a system in situ. Biochem J. 1971;123(5):923–943. doi: 10.1042/bj1230923. [DOI] [PMC free article] [PubMed] [Google Scholar]
- 30.Hoffman DW, Henkens RW. The rates of fast reactions of carbon dioxide and bicarbonate in human erythrocytes measured by carbon-13 NMR. Biochemical and Biophysical Research Communications. 1987;143(1):67–73. doi: 10.1016/0006-291x(87)90630-9. [DOI] [PubMed] [Google Scholar]
- 31.Yang J, Singh S, Shen J. 13C saturation transfer effect of carbon dioxide–bicarbonate exchange catalyzed by carbonic anhydrase in vivo. Magnetic Resonance in Medicine. 2008;59(3):492–498. doi: 10.1002/mrm.21501. [DOI] [PubMed] [Google Scholar]
- 32.Bierenstiel M, Schlaf M. δ-Galactonolactone: synthesis, isolation, and comparative structure and stability analysis of an elusive sugar derivative. Eur J Org Chem. 2004;(7):1474–1481. [Google Scholar]
- 33.Patyal BR, Gao J-H, Williams RF, et al. Longitudinal relaxation and diffusion measurements using magnetic resonance signals from laser-hyperpolarized 129Xe nuclei. J Magn Reson. 1997;126(1):58–65. doi: 10.1006/jmre.1997.1159. [DOI] [PubMed] [Google Scholar]
- 34.Ardenkjaer-Larsen JH, Fridlund B, Gram A, et al. Increase in signal-to-noise ratio of > 10,000 times in liquid-state NMR. Proc Natl Acad Sci U S A. 2003;100(18):10158–10163. doi: 10.1073/pnas.1733835100. [DOI] [PMC free article] [PubMed] [Google Scholar]
- 35.Burgess SC, Hausler N, Merritt M, et al. Impaired Tricarboxylic Acid Cycle Activity in Mouse Livers Lacking Cytosolic Phosphoenolpyruvate Carboxykinase. J Biol Chem. 2004;279(47):48941–48949. doi: 10.1074/jbc.M407120200. [DOI] [PubMed] [Google Scholar]
- 36.Marsolais C, Huot S, David F, Garneau M, Brunengraber H. Compartmentation of carbon-14 dioxide in the perfused rat liver. J Biol Chem. 1987;262(6):2604–2607. [PubMed] [Google Scholar]
- 37.Marsolais C, Lafreniere F, David F, Dodgson SJ, Brunengraber H. Reassessment of carbon-14 dioxide compartmentation and of [14C]formate oxidation in rat liver. J Biol Chem. 1989;264(33):19761–19764. [PubMed] [Google Scholar]
- 38.Berry MN, Gregory RB, Grivell AR, Phillips JW, Schon A. The capacity of reducing-equivalent shuttles limits glycolysis during ethanol oxidation. Eur J Biochem. 1994;225(2):557–564. doi: 10.1111/j.1432-1033.1994.00557.x. [DOI] [PubMed] [Google Scholar]
- 39.Larrabee MG. The pentose cycle (hexose monophosphate shunt). Rigorous evaluation of limits to the flux from glucose using carbon-14 dioxide data, with applications to peripheral ganglia of chicken embryos. J Biol Chem. 1989;264(27):15875–15879. [PubMed] [Google Scholar]
- 40.Boros LG, Lee PWN, Brandes JL, et al. Nonoxidative pentose phosphate pathways and their direct role in ribose synthesis in tumors: is cancer a disease of cellular glucose metabolism? Med Hypotheses. 1998;50(1):55–59. doi: 10.1016/s0306-9877(98)90178-5. [DOI] [PubMed] [Google Scholar]
- 41.Sommercorn J, Freedland RA. Activation of phosphofructokinase from rat liver by 6-phosphogluconate. Biochem Biophys Res Commun. 1981;99(2):563–567. doi: 10.1016/0006-291x(81)91782-4. [DOI] [PubMed] [Google Scholar]
- 42.Sommercorn J, Freedland RA. Regulation of hepatic phosphofructokinase by 6-phosphogluconate. J Biol Chem. 1982;257(16):9424–9428. [PubMed] [Google Scholar]
- 43.Sommercorn J, Steward T, Freedland RA. Activation of phosphofructokinase from rat tissues by 6-phosphogluconate and fructose 2,6-bisphosphate. Arch Biochem Biophys. 1984;232(2):579–584. doi: 10.1016/0003-9861(84)90576-9. [DOI] [PubMed] [Google Scholar]
- 44.Sommercorn J, Freedland RA. Effects of diets on concentrations of 6-phosphogluconate and fructose 2,6-bisphosphate in rat livers and an assay of fructose 2,6-bisphosphate with an improved method. J Nutr. 1984;114(8):1462–1469. doi: 10.1093/jn/114.8.1462. [DOI] [PubMed] [Google Scholar]
- 45.Smith SB, Freedland RA. Activation of pyruvate kinase by 6-phosphogluconate. J Biol Chem. 1979;254(21):10644–10648. [PubMed] [Google Scholar]
- 46.Smith SB, Freedland RA. Regulation of pyruvate kinase by 6-phosphogluconate in isolated hepatocytes. Am J Physiol. 1981;240(3):E279–E285. doi: 10.1152/ajpendo.1981.240.3.E279. [DOI] [PubMed] [Google Scholar]
- 47.Hill D, Orton M, Mariotti E, Boult J, Panek R, Jafar M. Model Free Approach to Kinetic Analysis of Real-Time Hyperpolarized 13C Magnetic Resonance Spectroscopy Data. PLoS ONE. 2013;8(9) doi: 10.1371/journal.pone.0071996. [DOI] [PMC free article] [PubMed] [Google Scholar]
Associated Data
This section collects any data citations, data availability statements, or supplementary materials included in this article.