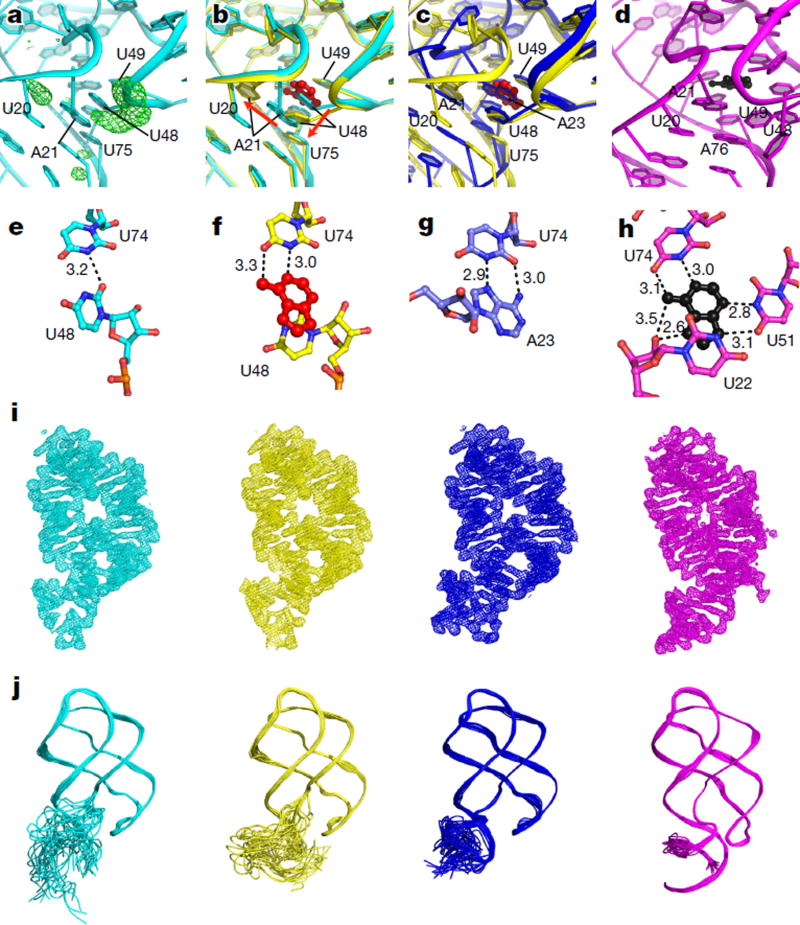
Figure 4. Visualizing the ligand-bound intermediate state.
a, Fo − Fc map (3σ, green) of the binding pocket of apo2 (cyan), calculated after refining the apo-rA71 structure against the 10-s-mix data with adenine in the binding pocket and U48 removed, revealing altered conformations for U48 (large peak) and A21 (smaller peak). b, Superimposition of apo2 (cyan) and IB (yellow) states, showing the different conformations for U48 and A21. Adenine (red) binding to the apo2 state (cyan) results in displacement of U48, and consequently A21, to form the IB state (yellow). c, Superimposition of the apo1 (blue) and IB (yellow) structures, revealing very similar base-stacking interactions, in which A23 of apo1 (blue) takes the place of the IB ligand (red). d, Three-way junction with the adenine ligand (black) of the ligand-bound state (PDB code 4TZX) shown for comparison. e–h, Ball-and-stick models, with hydrogen-bond interactions shown, of key residues in the ligand-binding pockets of apo2 (e), IB (f), apo1 (g) and ligand-bound (h) states. i, 2 Fo − Fc electron density maps contoured at 1σ for apo2 (cyan), IB (yellow), apo1 (blue) and ligand-bound (magenta) states. j, Structure ensembles of apo2 (cyan), IB (yellow), apo1 (blue) and ligand-bound (magenta) structures from time-averaged molecular dynamics ensemble refinement, demonstrating the flexibility/stability of P1 in each of the four conformations.

