

Abstract
Aldehydes are key intermediates in many cellular processes, from endogenous metabolic pathways like glycolysis to undesired exogenously induced processes such as lipid peroxidation and DNA interstrand cross-linking. Alkyl aldehydes are well documented to be cytotoxic, affecting the functions of DNA and protein, and their levels are tightly regulated by the oxidative enzyme ALDH2. Mutations in this enzyme are associated with cardiac damage, diseases such as Fanconi anemia (FA), and cancer. Many attempts have been made to identify and quantify the overall level of these alkyl aldehydes inside cells, yet there are few practical methods available to detect and monitor these volatile aldehydes in real time. Here, we describe a multicolor fluorogenic hydrazone transfer (“DarkZone”) system to label alkyl aldehydes, yielding up to 30-fold light-up response in vitro. A cell-permeant DarkZone dye design was applied to detect small-molecule aldehydes in the cellular environment. The new dye design also enabled the monitoring of cellular acetaldehyde production from ethanol over time by flow cytometry, demonstrating the utility of the DarkZone dyes for measuring and imaging the aldehydic load related to human disease.
Graphical abstract
Humans are widely exposed to aldehydes throughout daily life by contact with polluted air,1 industrial processes,2 smoking,3 and dietary and alcohol consumption.4 Small-molecule aldehydes can diffuse freely in cells, reacting with amines and thiols to form adducts with DNA and proteins, adversely affecting their functions. Numerous environmental aldehydes are classified as mutagens5 and carcinogens6 and are directly involved in cardiovascular7 and lung8 diseases.
In addition to environmental aldehydes, small alkyl aldehydes are generated endogenously in cells through normal and pathogenic metabolism. Aldehydes are synthesized under oxidative stress via lipid peroxidation,9 glycation,10 and oxidation of amino acids.11 Prominent examples of endogenously generated aldehydes include acetaldehyde, malondialdehyde, 4-hydroxynonenal (4-HNE), and glyoxal, which exist in concentrations ranging from nanomolar to several hundred micromolar in cells.12,13 Accumulation of aldehydes from oxidative stress or dysfunctional enzymes can cause and exacerbate diseases such as chronic liver damage14 and Fanconi anemia (FA).15 As a result of their cytotoxicity, most of these alkyl aldehydes are tightly regulated by aldehyde dehydrogenases including ALDH2, for which specific disease-related mutations are known.16 The ALDH2*2 mutation is widely prevalent in East Asia, resulting in severe acetaldehyde-induced reactions in affected individuals after ethanol ingestion, and contributing to cancer risk. The total cellular “aldehydic load,” measuring all alkyl aldehydes together, is considered an important parameter to assess these pathologies.17,18
Cellular aldehydes are traditionally quantified by gas or liquid chromatography;19,20 however, these methods suffer from significant signal loss from evaporation of small volatile aldehydes during prolonged experimental time and manipulation. In contrast, fluorogenic reporters might offer the possibility of directly observing cellular small aldehydes without cell lysis, aldehyde extraction, and chromatographic separation. In this light, recent reports have described reaction-based fluorogenic reporters of formaldehyde21,22 and malondialdehyde.23 Yet, no intracellular reporters exist for many important alkyl aldehydes such as acetaldehyde, glyoxal, methylglyoxal, 4-HNE, glycolaldehyde, or acrolein. In addition, no method is known for imaging and measuring total aldehydic load in live cells. This is important because malfunction of single oxidative enzymes such as ALDH2 regulate the cellular levels of multiple alkyl aldehydes.16
We report here a general fluorogenic hydrazone dye design that successfully addresses these needs for aldehyde labeling and detection. This molecular design involves a novel hydrazone transfer approach to labeling. The new dye architecture (a dark hydrazone or “DarkZone;” Figures 1 and 2)) is capable of both in vitro and in vivo aldehyde labeling and functions with most known cellular alkyl aldehydes. The labeling is attended by a light-up signal of up to 30-fold.
Figure 1.
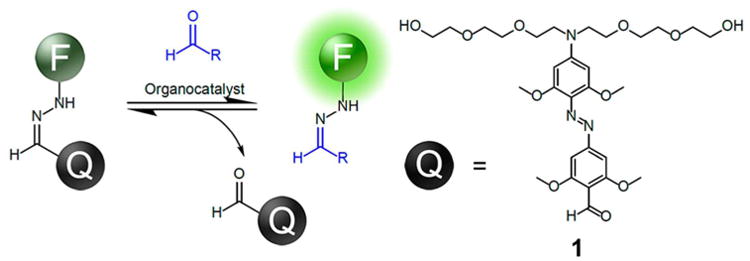
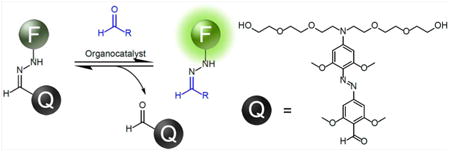
Generalized scheme for light-up labeling of an aldehyde by hydrazone transfer. The DarkZone dye is a quenched hydrazone formed from a fluorescent-tagged hydrazine and a quencher-aldehyde. A fluorescence signal appears when the quencher-aldehyde is exchanged for the target aldehyde.
Figure 2.
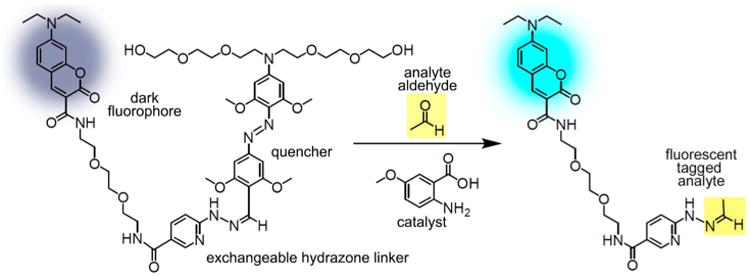
Structures of a DarkZone dye (7-(diethylamino)coumarin or DEAC label shown) and a fluorescent tagged target aldehyde (acetaldehyde shown). See SI file for structures and synthesis of other dye-substituted DarkZone reagents.
Results and Discussion
DarkZone Dye Design and Synthesis
We designed a hydrazine-carrying fluorescent label to be combined with a fluorescence quencher that possesses a donor aldehyde (Figure 1), generating a dark hydrazone reagent. In principle, reaction of such a fluorescence-quenched reagent with a new acceptor aldehyde (the analyte) would result in a light-up signal as the quencher is released. The pro-fluorescent DarkZone reagent might then be used for labeling and imaging aldehydes with an attendant optical signal as labeling proceeds.
The practical requirements of such a donor hydrazone are (1) high stability to hydrolysis under ambient conditions, (2) well-quenched fluorescence for low background signal, (3) a thermodynamically unstable hydrazone linkage relative to the hydrazone formed with alkyl aldehydes of biological interest, thus driving the reaction to completion. We adopted a 2-hydrazinopyridine nucleophile as part of the bisaryl DarkZone system, as it has been shown to be a viable substrate for bioconjugation.24 We then screened a series of hydrazones formed from varied aryl aldehydes by HPLC, looking for a high rate and extent of exchange with 4-nitrobenzaldehyde. We found that hydrazones formed by electron-rich benzaldehydes gave facile exchange, with higher exchange rates observed in cases where electron donating groups were conjugated to the hydrazone nitrogen (see HPLC data in Figure S1). On the basis of this finding, we designed an electronically similar aldehyde-functionalized fluorescence quencher (1, Figure 1) based on a well-known azobenzene quencher (dabcyl).25 Compound 1 was equipped with ethylene glycol chains to increase water solubility of the overall dye structure.
To prepare prototype multicolor DarkZone dyes, we conjugated quencher aldehyde 1 with five fluorophores having varied emission properties (Table 1). The quenched conjugates showed similar excitation and emission wavelengths compared to the unquenched forms, but with quantum yields suppressed significantly as expected. Exchange and optical performance of these compounds were evaluated using 500 nM dye and 2 mM glyoxylic acid as acceptor. To facilitate reactions at pH 7, we used 5 mM 5-methoxyanthranilic acid (3) as catalyst26 (Figure S2 and Table 1) in phosphate buffer. For all dyes, exchange proceeded smoothly without significant side products (Figure S3). Among the dyes tested, the Cy3 DarkZone dye showed the greatest fluorescence enhancement (30-fold) while the BODIPY FL DarkZone dye exhibited the least, albeit still substantial (4-fold). The exchange reactions reached completion within 2–3 h and the exchange rate could be enhanced further at slightly acidic pH (pH 6), reaching completion in ca. 20 min (Figure S4). For in vitro labeling of aldehydes, we conclude that several of the DarkZone dyes are suitable; for cellular labeling, the fluorescein dye provides an advantage due to its anionic structure (see below).
Table 1. Photophysical Properties of Multicolor DarkZone Dyes.
| dyea | λAbs (nm) | λEm (nm) | Φfl | eλmax | Fluorescence enhancement (fold) |
|---|---|---|---|---|---|
| BODIPY FL | 507 | 511 | 0.164b | 31500 | 4 |
| DEACc | 435 | 477 | 0.009d | 29000 | 23 |
| Cy3 | 508 | 559 | 0.001e | 53200 | 30 |
| fluorescein | 499 | 519 | 0.053b | 47400 | 12 |
| TAMRA | 556 | 575 | 0.023e | 60100 | 13 |
Measured in 300 mM phosphate buffer, pH 7.
Quantum yields measured using fluorescein standard.
7-(Diethylamino)coumarin.
Quantum yields measured using 9,10-diphenylanthracene standard.
Quantum yields measured using rhodamine B standard.
Catalyst Screening
Arylamine organocatalysts have played crucial roles in the development of hydrazone chemistry, acting as nucleophilic catalysts that activate carbonyl groups to form imines.27 We screened 16 arylamine compounds (Figure 3) at 5 mM for their ability to promote hydrazone exchange with an alkyl aldehyde. Two previously reported catalysts—5-methoxyanthranilic acid26 (3) and 1,4-phenylenediamine28 (4)—demonstrated excellent rate enhancements, 4- to 5-fold greater than that of aniline and >90-fold over the uncatalyzed reaction (Figure S5). We also discovered two unreported catalysts—2,4-dimethoxyaniline (5) and 5-aminoindole (6)—to be efficient as well, with activity 3-fold higher than that of aniline. Notably, this ranking of catalysts is different than that observed in simple hydrazone formation,29 which is consistent with the notion that the reaction mechanism may be distinct in the current hydrazonealdehyde exchange (see possible mechanisms in Figure S6).
Figure 3.

Arylamine catalysts screened for promoting hydrazonealdehyde exchange. The hydrazone exchange rate of fluorescein DarkZone dye (500 nM) with glyoxylic acid (2 mM) was measured by monitoring fluorescence at λEm= 517 nm, with 5 mM catalyst. The rates relative to aniline are listed; standard deviations were calculated from three trials. *No catalytic activity observed.
Substrate Scope
Next, we evaluated how acceptor aldehyde structure influences the extent and rate of hydrazone exchange. We tested a range of aldehyde substrates (aliphatic, aromatic, electron rich/poor) and monitored the extent of reaction by HPLC as a function of time, using 200 μM acceptor aldehyde and exchange dye with 5 mM catalyst 3. The data showed that the reactions required 5 to 21 h to reach equilibrium, depending on the substrate (Figure S7). Electron-poor aromatic aldehydes showed the highest degree of reaction (greatest Keq), which suggested a more stable product hydrazone compared to the starting DarkZone dye. Only minimal reaction was observed for carbohydrate (aldose) acceptors, possibly due to the predominance of the unreactive hemiacetal form in the aqueous buffer. We also measured the fluorescence turn-on for each of the acceptor aldehydes. Interestingly, only aliphatic substrates yielded an appreciable light-up response; reactions between the DarkZone dye and aromatic aldehydes remained dark as a result of the bisaryl hydrazones' apparent ability to quench fluorescence (Figure 4). Tests of the fluorescein DarkZone dye with nine alkyl aldehydes known to be present in mammalian cells30 confirm that signals appear above background for acetaldehyde, acrolein, glycolaldehyde, formaldehyde, glyoxal, methylglyoxal, and glyoxylic acid (Figure S8); only malondialdehyde failed to yield signals. On the basis of these studies, we conclude that the current DarkZone dye design is selective for light-up labeling of a large range of aliphatic aldehydes relative to aryl aldehydes and sugars that appear in cellular metabolism. We chose two of the cellular aldehydes to test over varied concentrations for sensitivity of detection at 20 μM dye concentration (Figure S9). Plots of signal versus concentration revealed detection limits of ≤0.5 μM for glyoxylate and between 20 and 100 μM for glycolaldehyde. Reported physiological glyoxylate concentrations are 40–130 μM in HepG2 cells and liver tissue,31 and for glycolaldehyde, physiological concentrations are estimated at 100 to 1000 μM.32 Thus, the fluorescein DarkZone dye can report on multiple cellular alkyl aldehydes at physiologically relevant concentrations.
Figure 4.
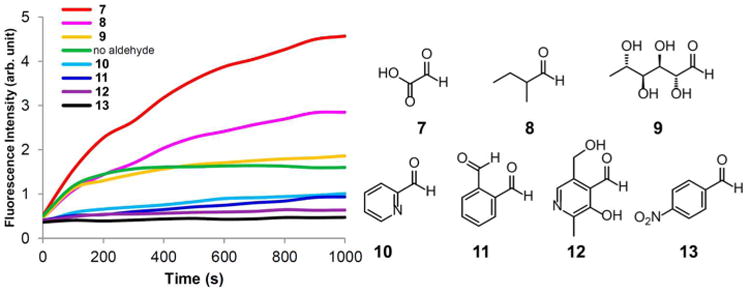
Comparison of signals for varied aldehyde substrates in phosphate buffer, showing selective signaling with alkyl aldehydes. (a) Hydrazone exchange with different acceptor carbonyl substrates. Conditions: 300 mM phosphate buffer (pH 7), 500 nM fluorescein DarkZone dye, 5 mM catalyst 3, and 2 mM carbonyl substrates. Aldehydes: glyoxylic acid (7), 2-methylbutyraldehyde (8), l-rhamnose (9), pyridine-2-carboxaldehyde (10), phthalaldehyde (11), pyridoxal (12), and 4-nitrobenzaldehyde (13).
Intracellular Activity of Catalysts
To perform detection and imaging of alkyl aldehydes within cells, we first evaluated the best catalysts from the above studies for toxicity and effectiveness in intracellular labeling (Figure 5). Since signaling would be most effective if the labeling agent can penetrate the cell membrane, but remain in the cells once inside, we prepared an acetylated fluorescein DarkZone dye (AFDZ, see Figure 6). Once the uncharged acetylated fluorescein penetrates the cells, intracellular esterases are expected to release the negatively charged fluorescent dye,33 trapping it inside the cell. Indeed, we observed very little background signal when AFDZ dye was used and found strong cellular signals when alkyl aldehydes were present (Figure 6a).
Figure 5.
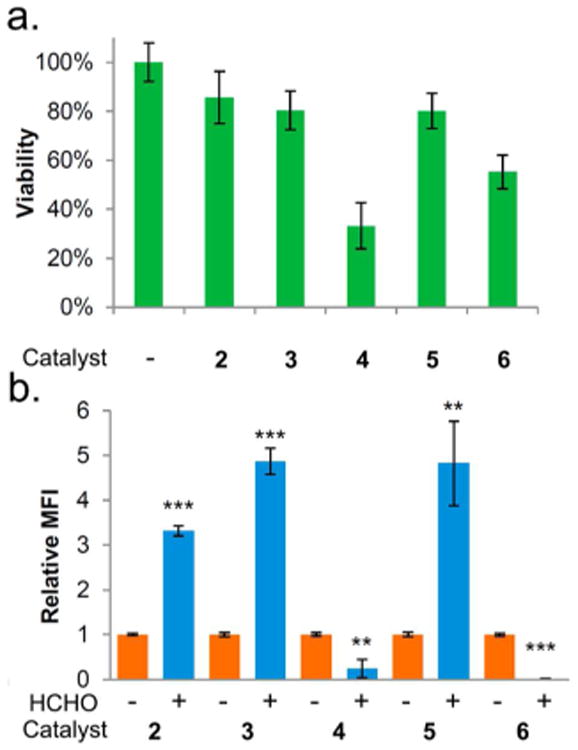
Catalyst screening for intracellular labeling. (a) K562 cell viability at 24 h after incubating with 10 mM catalyst for 1 h; (b) relative fluorescence intensity after 1 h with 10 mM catalyst, 40 μM AFDZ dye with/without 2 mM formaldehyde (HCHO). Error bar indicates standard deviation from n = 3; stars indicate significance in t test, **P ≤ 0.01 and ***P ≤ 0.001.
Figure 6.
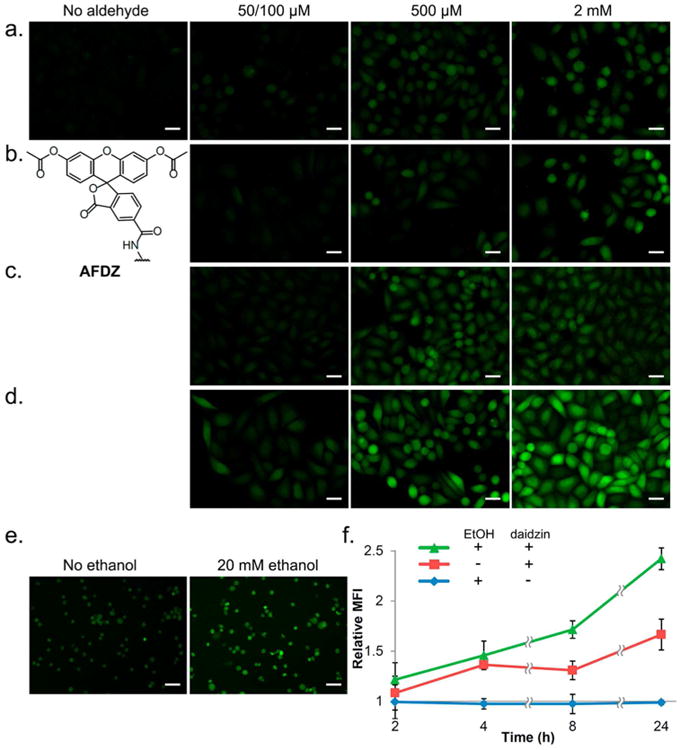
Fluorescence images and flow cytometry data for cellular aldehyde labeling. HeLa cells were incubated with 20 μM of AFDZ dye and 10 mM catalyst 5 and imaged after 1 h with varying concentrations of (a) formaldehyde, (b) glycolaldehyde, (c) acrolein, and (d) acetaldehyde. No washing steps were done. Note that 50 μM was used with acrolein and 100 μM for formaldehyde, glycolaldehyde, and acetaldehyde. (e) K562 cells pretreated with 250 μM daidzin and incubated with 40 μM of AFDZ dye, 10 mM catalyst 5, and with/without 20 mM ethanol. (f) Flow cytometry data monitoring the production of aldehyde over time in K562 cells with/without ethanol. The fluorescence intensities were compared to that obtained from t = 0 without added ethanol and daidzin. Scale bars (20 μM) are shown.
We then proceeded to evaluate organocatalysts for their ability to promote reaction without strong toxicity. We incubated the four best catalysts (catalyst 3, 4, 5, and 6) from the in vitro screen, along with the well-known catalyst aniline (2), with K562 cells. The catalyst was removed after 1 h by exchanging culture media, and cell viability was measured via Trypan Blue staining at 24 h. Cells incubated with catalysts 2, 3, and 5 at 10 mM showed the greatest viability at 80–86%, while catalysts 4 and 6 were somewhat less well tolerated (33 and 55% viability; Figure 5a). We noted discoloration of solutions containing 4 and 6, apparently due to oxidation in the air. We also measured the abilities of the catalysts to catalyze the exchange reaction within the cellular environment. The five catalysts were incubated with the cells at 10 mM with 40 μM AFDZ dye and 2 mM formaldehyde for 1 h, and the fluorescence intensity was subsequently measured by flow cytometry. We found that both catalysts 3 and 5 yield a signal to background ratio of 4.8, outperforming other catalysts (Figure 5b). Since catalyst 3 (without buffering) induced a pH change in the media, we chose catalyst 5 for our further cellular studies.
Intracellular Labeling of Alkyl Aldehydes
We tested the AFDZ dye with multiple biologically relevant aldehydes in HeLa cells: formaldehyde, an environmental pollutant that can induce neurogenic diseases;34 glycolaldehyde, a metabolite that can be further oxidized to highly toxic glyoxal;35 acrolein, a lipid peroxidation product with links to Alzheimer's disease36 and chemotherapy-induced bladder injury;37 and acetaldehyde, a carcinogenic16 aldehyde that is enzymatically produced by the metabolism of ethanol. First, we performed a test of background signals, by incubating the dye with cells and catalyst without added aldehyde. Since wild-type cells with active ALDH2 should have low levels of constitutive aldehydes, signals are expected to be relatively low unless the DarkZone dye is hydrolyzed in the cell under the conditions. Experiments showed that incubation of HeLa cells with AFDZ dye and catalyst 5 for 1 h yield minimal fluorescence signals under the microscope (Figure 6a, no aldehyde), demonstrating hydrolytic stability under the labeling conditions. Next, we tested the effect of aldehydes added into the cells: we incubated HeLa cells with 20 μM AFDZ dye, 10 mM 5, and varying concentrations of aldehydes in the media for 1 h without washing to remove excess dye. We observed a concentration-dependent increase in fluorescence signal from 100 μM to 500 μM to 2 mM for three of the aldehydes (formaldehyde, glycolaldehyde, and acetaldehyde; Figure 6; see also quantified data in Figure S10c). For acrolein, the fluorescence intensities are similar from 100 μM to 2 mM; a drop in fluorescence was only observed at a low (50 μM) concentration, indicating a strong equilibrium driving force to the labeling reaction even at a relatively low concentration of analyte. Signals for aldehydes were strongest in the nucleus (Figure 6d and Figure S10) but were quite substantial in the cytosolic compartment as well. The stronger nuclear signal may reflect the mitochondrial localization of ALDH family enzymes,16 which could lower relative aldehyde concentrations in the cytosol. Confocal microscope imaging confirmed that the labeling is indeed localized inside the cells (Figure S11). We also labeled glyoxylic acid—a strongly responding (see Figure 4) but poorly cell-permeable aldehyde due to its charge—with AFDZ dye using the same labeling conditions as the other aldehydes. The lack of intra- and extracellular fluorescence signal suggests that both exchange with aldehydes and intracellular esterase activation are important for responses (Figure S12).
To test the application of a DarkZone probe for dynamic monitoring of constitutive aldehyde production, we employed the AFDZ dye to monitor acetaldehyde production from ethanol in K562 cells. Ethanol is metabolized through oxidation to acetaldehyde by alcohol dehydrogenase and is further oxidized to acetate by mitochondrial ALDH2.16 Over 500 million East Asians possess a point mutation in the ALDH2 gene, leading to high levels of the aldehyde and causing disulfiram-like symptoms of facial flushing, headaches, nausea, and eventually cancer if chronically overexposed.16 Acetaldehyde is probably the major source of DNA interstrand crosslinks (ICL),38 and the inability to repair this damage is the underlying pathology in FA, a fatal genetic disorder of DNA repair.39 FA patients develop birth defects, marrow failure, leukemia, and other cancers due to the aldehyde-induced ICL.39 Although these issues are clinically important, we still lack efficient ways to monitor the production of acetaldehyde due to its high volatility (boiling point = 20 °C).
We exposed the cells to a standard intoxication level of ethanol (20 mM)40 and employed AFDZ dye to assess levels of acetaldehyde produced from it. Experiments were followed by microscopy and flow cytometry over 24 h with 40 μM AFDZ dye and 10 mM catalyst 5. Differential signals were visible by epifluorescence microscopy (Figure 5e) and were quantifiable by flow cytometry. With ethanol treatment alone (Figure 6f, blue curve), AFDZ shows no fluorescence increase over background, indicating the fast kinetics of acetaldehyde processing to acetate in the cells, which results in no measurable buildup in steady-state acetaldehyde concentration. In contrast, when cells were preincubated with ALDH2 inhibitor daidzin41 (Figure 6f, green curve), microscopy images displayed a clear increase in fluorescence from the buildup of acetaldehyde as its further processing to acetate was inhibited. Flow cytometry results (see representative plots in Figure S13) revealed a 2.5-fold fluorescence increase after incubation of cells with daidzin and 20 mM ethanol for 24 h. Previous literature suggests that a similar ethanol dose in the presence of daidzin can generate 12 μM acetaldehyde in mammals.42 We also observed that incubating daidzin with the cells in the absence of ethanol yielded a continuous increase of fluorescence signal over time (Figure 6f, red curve), which suggests that some of the non-ethanol-induced signal arises from constitutive cellular alkyl aldehydes in the cells rather than simple hydrolysis of the DarkZone dye.
Taken together, our experiments establish a new quenched hydrazone dye design that efficiently labels aldehydes in vitro and in living cells, while yielding light-up signals that report on reaction. The reaction can be performed in neutral or mildly acidic conditions to achieve labeling within minutes to hours with improved catalysts. The light-up capability of the DarkZone dye design not only signals reaction progress in vitro but also enables measurements of relative levels of intracellular aldehydes. This fluorogenic design provides advantages over other aldehyde labeling systems43 by allowing direct quantification of aldehyde using flow cytometry or microscopy without the need of washing or cell lysis, saving time and labor. The labeling of endogenously produced aldehydes using AFDZ can potentially occur inside and outside the cells because of the highly diffusible nature of the aldehydes. However, the intracellular esterase activated AFDZ allows the fluorescence signal to be trapped in the cell, enabling low-background analytical measurements using flow cytometry and fluorescence microscopy. The application of the new hydrazone dye design to flow cytometry may allow aldehydic load in different cell types within a tissue to be defined, e.g., phenotypically defined hematopoietic stem cells, which are the target of acetaldehyde-mediated DNA damage in bone marrow. The selectivity of the current DarkZone design for alkyl aldehydes is useful for monitoring the total cellular alkyl aldehyde content rather than a specific one. In addition to acetaldehyde from ethanol metabolism, it is known that oxidative stress often generates multiple aliphatic aldehydes, including 4-HNE, acrolein, and 4-oxo-2-nonenal.44 Having a tool that can monitor the total aldehydic load provides a measure of the processing of such compounds through the aldehyde-detoxifying ALDH family of enzymes.45 Thus, such reagents have the potential to show broad utility in the study of the biology of normal and disease-related aldehyde metabolism.
Methods
Synthesis of DarkZone Dyes
Materials, methods, characterization data, and spectra are given in the Supporting Information.
Substrate Screening
Five millimolar catalyst 3 and 2 mM aldehyde in DMSO were added to 100 μL of 300 mM phosphate buffer (pH 7) sequentially in a 60 μL cuvette. The solution was mixed with a micropipet. DarkZone dye (500 nM) in DMSO was added to the solution, and the fluorescent intensity was monitored with a fluorimeter with λex and λem listed on Table S1. For the biologically relevant aliphatic aldehydes, 10 mM catalyst 5 and 1 × PBS buffer were used, and the fluorescence intensities were measured in a microplate reader after 1 h of incubation.
HPLC Analysis
The reactions were performed with the same setup procedures as described above. The reactions were incubated at RT protected from light, and 10 μL of the reaction mixture was injected into the HPLC equipped with a Phenomenex Onyx Monolithio C18 at different time points for analysis. The eluent consisted of acetonitrile with 0.1% TFA and 0.22 μm filtered water. The reactions were monitored using the absorption maximum of the fluorescent dye except for fluorescein, which did not show a good absorption in the HPLC eluents; the absorption of the quencher was used instead.
Catalyst Screening
Five millimolar catalysts in DMSO and 2 mM glyoxylic acid in water were added to 300 mM phosphate buffer (pH 7) sequentially to make up a 100 μL solution in a 60 μL cuvette. The solution was mixed with a micropipet. Fluorescein DarkZone dye (500 nM) in DMSO was added to the solution, and the fluorescence intensity was monitored with a fluorimeter for 400 s at RT. The experiment was performed in triplicate to calculate the standard deviation. The rate relative to aniline for each catalyst was calculated using initial rates as measured at the 100 s time point (see Supporting Information for the calculation).
Fluorescence Kinetics and Light-up Measurements
Catalyst (5 mM) and glyoxylic acid (2 mM) were dissolved in 300 mM phosphate buffer (pH 7) in a 100 μL of solution. DarkZone dye in DMSO was then added to reach the desired concentration, and the emission at the chosen wavelength was monitored over time at RT (Table S1). The emission spectra were taken after the emission intensity stabilized based on the kinetic readout. The prereaction emission spectra were taken with DarkZone dyes at the desired concentration dissolved in 300 mM phosphate buffer.
Aldehyde Labeling in HeLa Cells
HeLa cells were cultured with EMEM cell culture media in a 0.7 cm2 eight-chamber glass slide until 90% confluency inside a CO2 incubator at 37 °C. Ten millimolar catalyst 5 was predissolved in media with 1% DMSO, and it was used to replace the media at the start of the experiments. Aldehydes were predissolved in 1 × PBS buffer and added to each chamber. Twenty micromolar DarkZone dye predissolved in DMSO was then added to each well. In the case of acetaldehyde, the container was sealed with parafilm to avoid aldehyde evaporation. The reaction was incubated in a CO2 incubator at 37 °C for 1 h and imaged with an epifluorescence or confocal microscope.
Toxicity Test for Catalysts
K562 cells were cultured with RPMI-1640 cell culture media in a cell culture flask. Aliquots of 105 cells in 150 μL were pipetted into a 96-well microplate with three wells for each catalyst. A total of 10 mM of each catalyst DMSO was added to each well and incubated for 1 h. The cells were then washed three times with cell media, and viability was evaluated by Trypan Blue exclusion at 24 h.
Catalyst Screening for Hydrazone Exchange in Cellular Environment
K562 cells were cultured with RPMI-1640 in a cell culture flask, and aliquots of 105 cells in 150 μL were pipetted into a 96-well microplate. To the cell culture was then added 10 mM of catalyst in DMSO, 2 mM formaldehyde in water, and 40 μM of AFDZ dye in DMSO. The concentration of AFDZ was quantified using ε505 nm = 20 037 cm−1 mol−1 L. The mixtures were incubated in a CO2 incubator at 37 °C for 1 h. The cells were spun down at 100 rcf for 5 min, and the medium was replaced with 300 μL of 1 × PBS buffer with 2% FBS prior to flow cytometry analysis.
Acetaldehyde Labeling from Ethanol Production in Cells
K562 cells were cultured with RPMI-1640 cell culture media in a cell culture flask. A total of 105 cells in 150 μL were transferred to a 96-well cell culturing plate. For experiments requiring ALDH2 inhibitor, 5 mM daidzin was predissolved in DMSO, and 250 μM was added to each well. Note that the experiments with and without ethanol treatment are performed in separate 96-well plates to prevent cross-contamination from the volatile acetaldehyde. Experiments at different time points were also performed with separate plates to avoid the loss of acetaldehyde. The plates were incubated for 8 h in a CO2 incubator at 37 °C. Fluorescence labeling was performed at t = 0 with cells without inhibitor treatment to measure the background fluorescence. Twenty millimolar ethanol was added at t = 0. Adhesive plate seals were used on each plate to prevent evaporation of acetaldehyde and ethanol. Fluorescence labeling was then performed on each experiment at t = 2, 4, 8, and 24 h. In all the experiments, fluorescence labeling was performed by cooling the plate to RT for 5 min, adding 40 μM AFDZ dye and 10 mM catalyst 5 in DMSO, and incubating for 1 h in a CO2 incubator at 37 °C. The cells were spun down at 100 rcf for 5 min, and the medium was replaced with 1 × PBS buffer with 2% FBS before flow cytometry analysis. The mean fluorescence intensity (MFI) was calculated from single parameter histograms and expressed relative to the baseline fluorescence (relative MFI). Each experiment was performed in triplicate.
Supplementary Material
Table S1, Figures S1–S13, synthetic procedures, and NMR spectra (PDF)
Acknowledgments
We thank the National Institutes of Health (GM110050 to E.T.K.) and the Lucile Packard Children's Health Research Institute Transdisciplinary Initiatives Program (to K.W. and E.T.K.) for support. We thank Stanford Cell Sciences Imaging Facility for confocal imaging assistance, which was supported in part by Award #1S10OD010580 from the National Center for Research Resources.
Footnotes
Supporting Information: The Supporting Information is available free of charge on the ACS Publications website at DOI: 10.1021/acschem-bio.6b00269.
Notes: The authors declare no competing financial interest.
References
- 1.Thomas JF, Sanborn EN, Mukai M, Tebbens BD. Aldehyde Production Related to Combustion and Polluted Atmospheres. Ind Eng Chem. 1959;51:774–775. [Google Scholar]
- 2.Gage JC. The subacute inhalation toxicity of 109 industrial chemicals. Occup Environ Med. 1970;27:1–18. doi: 10.1136/oem.27.1.1. [DOI] [PMC free article] [PubMed] [Google Scholar]
- 3.Corradi M, Rubinstein I, Andreoli R, Manini P, Caglieri A, Poli D, Alinovi R, Mutti A. Aldehydes in Exhaled Breath Condensate of Patients with Chronic Obstructive Pulmonary Disease. Am J Respir Crit Care Med. 2003;167:1380–1386. doi: 10.1164/rccm.200210-1253OC. [DOI] [PubMed] [Google Scholar]
- 4.O'Brien PJ, Siraki AG, Shangari N. Aldehyde sources, metabolism, molecular toxicity mechanisms, and possible effects on human health. Crit Rev Toxicol. 2005;35:609–662. doi: 10.1080/10408440591002183. [DOI] [PubMed] [Google Scholar]
- 5.Liu X, Zhu M, Xie J. Mutagenicity of acrolein and acrolein-induced DNA adducts. Toxicol Mech Methods. 2010;20:36–44. doi: 10.3109/15376510903530845. [DOI] [PubMed] [Google Scholar]
- 6.Marchitti SA, Deitrich RA, Vasiliou V. Neurotoxicity and Metabolism of the Catecholamine-Derived 3,4-Dihydroxyphenylacetaldehyde and 3,4-Dihydroxyphenylglycolaldehyde: The Role of Aldehyde Dehydrogenase. Pharmacol Rev. 2007;59:125–150. doi: 10.1124/pr.59.2.1. [DOI] [PubMed] [Google Scholar]
- 7.Bhatnagar A. Environmental cardiology: studying mechanistic links between pollution and heart disease. Circ Res. 2006;99:692–705. doi: 10.1161/01.RES.0000243586.99701.cf. [DOI] [PubMed] [Google Scholar]
- 8.Moretto N, Facchinetti F, Southworth T, Civelli M, Singh D, Patacchini R. alpha,beta-Unsaturated aldehydes contained in cigarette smoke elicit IL-8 release in pulmonary cells through mitogen-activated protein kinases. AM J Physiol Lung Cell Mol Physiol. 2009;296:839–848. doi: 10.1152/ajplung.90570.2008. [DOI] [PubMed] [Google Scholar]
- 9.Esterbauer H, Schaur RJ, Zollner H. Chemistry and Biochemistry of 4-hydroxynonenal, malonaldehyde and related aldehydes. Free Radical Biol Med. 1991;11:81–128. doi: 10.1016/0891-5849(91)90192-6. [DOI] [PubMed] [Google Scholar]
- 10.Kikuchi S, Shinpo K, Moriwaka F, Makita Z, Miyata T, Tashiro K. Neurotoxicity of methylglyoxal and 3-deoxyglucosone on cultured cortical neurons: synergism between glycation and oxidative stress, possibly involved in neurodegenerative diseases. J Neurosci Res. 1999;57:280–289. doi: 10.1002/(SICI)1097-4547(19990715)57:2<280::AID-JNR14>3.0.CO;2-U. [DOI] [PubMed] [Google Scholar]
- 11.Anderson MM, Hazen SL, Hsu FF, Heinecke JW. Human neutrophils employ the myeloperoxidase-hydrogen peroxide-chloride system to convert hydroxy-amino acids into glycolaldehyde, 2-hydroxypropanal, and acrolein A mechanism for the generation of highly reactive alpha-hydroxy and alpha, beta-unsaturated. J Clin Invest. 1997;99:424–432. doi: 10.1172/JCI119176. [DOI] [PMC free article] [PubMed] [Google Scholar]
- 12.Chaplen FW, Fahl WE, Cameron DC. Evidence of high levels of methylglyoxal in cultured Chinese hamster ovary cells. Proc Natl Acad Sci U S A. 1998;95:5533–5538. doi: 10.1073/pnas.95.10.5533. [DOI] [PMC free article] [PubMed] [Google Scholar]
- 13.Niki E. Lipid peroxidation: Physiological levels and dual biological effects. Free Radical Biol Med. 2009;47:469–484. doi: 10.1016/j.freeradbiomed.2009.05.032. [DOI] [PubMed] [Google Scholar]
- 14.Guo R, Ren J. Alcohol and Acetaldehyde in Public Health: From Marvel to Menace. Int J Environ Res Public Health. 2010;7:1285–1301. doi: 10.3390/ijerph7041285. [DOI] [PMC free article] [PubMed] [Google Scholar]
- 15.Langevin F, Crossan GP, Rosado IV, Arends MJ, Patel KJ. Fancd2 counteracts the toxic effects of naturally produced aldehydes in mice. Nature. 2011;475:53–58. doi: 10.1038/nature10192. [DOI] [PubMed] [Google Scholar]
- 16.Chen CH, Ferreira JCB, Gross ER, Mochly-Rosen D. Targeting Aldehyde Dehydrogenase 2: New Therapeutic Opportunities. Physiol Rev. 2014;94:1–34. doi: 10.1152/physrev.00017.2013. [DOI] [PMC free article] [PubMed] [Google Scholar]
- 17.Gomes KMS, Bechara LRG, Lima VM, Ribeiro MAC, Campos JC, Dourado PM, Kowaltowski AJ, Mochly-Rosen D, Ferreira JCB. Aldehydic load and aldehyde dehydrogenase 2 profile during the progression of post-myocardial infarction cardiomyopathy: Benefits of Alda-1. Int J Cardiol. 2015;179:129–138. doi: 10.1016/j.ijcard.2014.10.140. [DOI] [PMC free article] [PubMed] [Google Scholar]
- 18.Zambelli VO, Gross ER, Chen CH, Gutierrez VP, Cury Y, Mochly-Rosen D. Aldehyde dehydrogenase-2 regulates nociception in rodent models of acute inflammatory pain. Sci Transl Med. 2014;6:251ra118–251ra118. doi: 10.1126/scitranslmed.3009539. [DOI] [PMC free article] [PubMed] [Google Scholar]
- 19.Dennis KJ, Shibamoto T. Gas chromatographic determination of malonaldehyde formed by lipid peroxidation. Free Radical Biol Med. 1989;7:187–192. doi: 10.1016/0891-5849(89)90013-0. [DOI] [PubMed] [Google Scholar]
- 20.Mezzar S, Schryver EDe, Van Veldhoven PP. RP-HPLC-fluorescence analysis of aliphatic aldehydes: application to aldehyde-generating enzymes HACL1 and SGPL1. J Lipid Res. 2014;55:573–582. doi: 10.1194/jlr.D044230. [DOI] [PMC free article] [PubMed] [Google Scholar]
- 21.Roth A, Li H, Anorma C, Chan J. A Reaction-Based Fluorescent Probe for Imaging of Formaldehyde in Living Cells. J Am Chem Soc. 2015;137:10890–10893. doi: 10.1021/jacs.5b05339. [DOI] [PubMed] [Google Scholar]
- 22.Brewer TF, Chang CJ. An Aza-Cope Reactivity-Based Fluorescent Probe for Imaging Formaldehyde in Living Cells. J Am Chem Soc. 2015;137:10886–10889. doi: 10.1021/jacs.5b05340. [DOI] [PubMed] [Google Scholar]
- 23.Chen J, Zeng L, Xia T, Li S, Yan T, Wu S, Qiu G, Liu Z. Toward a Biomarker of Oxidative Stress: A Fluorescent Probe for Exogenous and Endogenous Malondialdehyde in Living Cells. Anal Chem. 2015;87:8052–8056. doi: 10.1021/acs.analchem.5b02032. [DOI] [PubMed] [Google Scholar]
- 24.Pfander S, Fiammengo R, Kirin SI, Metzler-Nolte N, Jäschke A. Reversible site-specific tagging of enzymatically synthesized RNAs using aldehyde-hydrazine chemistry and protease-cleavable linkers. Nucleic Acids Res. 2007;35:e25. doi: 10.1093/nar/gkl1110. [DOI] [PMC free article] [PubMed] [Google Scholar]
- 25.Marras SAE, Kramer FR, Tyagi S. Effciencies of fluorescence resonance energy transfer and contact-mediated quenching in oligonucleotide probes. Nucleic Acids Res. 2002;30:e122. doi: 10.1093/nar/gnf121. [DOI] [PMC free article] [PubMed] [Google Scholar]
- 26.Crisalli P, Kool ET. Water-Soluble Organo-catalysts for Hydrazone and Oxime Formation. J Org Chem. 2013;78:1184–1189. doi: 10.1021/jo302746p. [DOI] [PMC free article] [PubMed] [Google Scholar]
- 27.Dirksen A, Hackeng TM, Dawson PE. Nucleophilic Catalysis of Oxime Ligation. Angew Chem, Int Ed. 2006;45:7581–7584. doi: 10.1002/anie.200602877. [DOI] [PubMed] [Google Scholar]
- 28.Wendeler M, Grinberg L, Wang X, Dawson PE, Baca M. Enhanced Catalysis of Oxime-Based Bioconjugations by Substituted Anilines. Bioconjugate Chem. 2014;25:93–101. doi: 10.1021/bc400380f. [DOI] [PubMed] [Google Scholar]
- 29.Larsen D, Pittelkow M, Karmakar S, Kool ET. New Organocatalyst Scaffolds with High Activity in Promoting Hydrazone and Oxime Formation at Neutral pH. Org Lett. 2014;17:274–277. doi: 10.1021/ol503372j. [DOI] [PMC free article] [PubMed] [Google Scholar]
- 30.Semchyshyn HM. Reactive Carbonyl Species In Vivo: Generation and Dual Biological Effects. Sci World J. 2014;2014:1–10. doi: 10.1155/2014/417842. [DOI] [PMC free article] [PubMed] [Google Scholar]
- 31.Baker PR, Cramer SD, Kennedy M, Assimos DG, Holmes RP. Glycolate and glyoxylate metabolism in HepG2 cells. Am J Physiol Cell Physiol. 2004;287:C1359–C1365. doi: 10.1152/ajpcell.00238.2004. [DOI] [PubMed] [Google Scholar]
- 32.Lorenzi R, Andrades ME, Bortolin MC, Nagai R, Dal-Pizzol F, Moreira JC. Circulating glycolaldehyde induces oxidative damage in the kidney of rats. Diabetes Res Clin Pract. 2010;89:262–267. doi: 10.1016/j.diabres.2010.05.005. [DOI] [PubMed] [Google Scholar]
- 33.Han J, Burgess K. Fluorescent indicators for intracellular pH. Chem Rev. 2009;110:2709–2728. doi: 10.1021/cr900249z. [DOI] [PubMed] [Google Scholar]
- 34.Tong Z, Han C, Luo W, Wang X, Li H, Luo H, Zhou J, Qi J, He R. Accumulated hippocampal formaldehyde induces age-dependent memory decline. Age (Omaha) 2013;35:583–596. doi: 10.1007/s11357-012-9388-8. [DOI] [PMC free article] [PubMed] [Google Scholar]
- 35.Yang K, Feng C, Lip H, Bruce WR, O'Brien PJ. Cytotoxic molecular mechanisms and cytoprotection by enzymic metabolism or autoxidation for glyceraldehyde, hydroxypyruvate and glycolaldehyde. Chem -Biol Interact. 2011;191:315–321. doi: 10.1016/j.cbi.2011.02.027. [DOI] [PubMed] [Google Scholar]
- 36.Lovell Ma, Xie C, Markesbery WR. Acrolein is increased in Alzheimer's disease brain and is toxic to primary hippocampal cultures. Neurobiol Aging. 2001;22:187–194. doi: 10.1016/s0197-4580(00)00235-9. [DOI] [PubMed] [Google Scholar]
- 37.Topal T, Oter S, Korkmaz A. Pathophysiological aspects of cyclophosphamide and ifosfamide induced hemorrhagic cystitis; implication of reactive oxygen and nitrogen species as well as PARP activation. Cell Biol Toxicol. 2007;23:303–312. doi: 10.1007/s10565-006-0078-0. [DOI] [PubMed] [Google Scholar]
- 38.Brooks PJ, Zakhari S. Acetaldehyde and the genome: Beyond nuclear DNA adducts and carcinogenesis. Environ Mol Mutagen. 2014;55:77–91. doi: 10.1002/em.21824. [DOI] [PubMed] [Google Scholar]
- 39.Garaycoechea JI, Crossan GP, Langevin F, Daly M, Arends MJ, Patel KJ. Genotoxic consequences of endogenous aldehydes on mouse haematopoietic stem cell function. Nature. 2012;489:571–575. doi: 10.1038/nature11368. [DOI] [PubMed] [Google Scholar]
- 40.Suzdak PD, Schwartz RD, Skolnick P, Paul SM. Ethanol stimulates gamma-aminobutyric acid receptor-mediated chloride transport in rat brain synaptoneurosomes. Proc Natl Acad Sci U S A. 1986;83:4071–4075. doi: 10.1073/pnas.83.11.4071. [DOI] [PMC free article] [PubMed] [Google Scholar]
- 41.Keung WM, Vallee BL. Daidzin: a potent, selective inhibitor of human mitochondrial aldehyde dehydrogenase. Proc Natl Acad Sci U S A. 1993;90:1247–1251. doi: 10.1073/pnas.90.4.1247. [DOI] [PMC free article] [PubMed] [Google Scholar]
- 42.Keung WM, Lazo O, Kunze L, Vallee BL. Daidzin suppresses ethanl consumption by Srian golden hamsters without blocking acaldehyde metabolism. Proc Natl Acad Sci U S A. 1995;92:8990–8993. doi: 10.1073/pnas.92.19.8990. [DOI] [PMC free article] [PubMed] [Google Scholar]
- 43.Xiong XJ, Wang H, Rao WB, Guo XF, Zhang HS. 1,3,5,7-Tetramethyl-8-aminozide-difluoroboradiaza-s-indacene as a new fluorescent labeling reagent for the determination of aliphatic aldehydes in serum with high performance liquid chromatography. J Chromatogr A. 2010;1217:49–56. doi: 10.1016/j.chroma.2009.11.003. [DOI] [PubMed] [Google Scholar]
- 44.Grimsrud Pa, Xie H, Griffin TJ, Bernlohr Da. Oxidative stress and covalent modification of protein with bioactive aldehydes. J Biol Chem. 2008;283:21837–21841. doi: 10.1074/jbc.R700019200. [DOI] [PMC free article] [PubMed] [Google Scholar]
- 45.Koppaka V, Thompson DC, Chen Y, Ellermann M, Nicolaou KC, Juvonen RO, Petersen D, Deitrich Ra, Hurley TD, Vasiliou V. Aldehyde dehydrogenase inhibitors: a comprehensive review of the pharmacology, mechanism of action, substrate specificity, and clinical application. Pharmacol Rev. 2012;64:520–39. doi: 10.1124/pr.111.005538. [DOI] [PMC free article] [PubMed] [Google Scholar]
Associated Data
This section collects any data citations, data availability statements, or supplementary materials included in this article.
Supplementary Materials
Table S1, Figures S1–S13, synthetic procedures, and NMR spectra (PDF)