

Abstract
There is currently a void in the scientific literature on the cortical beta oscillatory activity that is associated with the production of leg motor actions. In addition, we have limited data on how these cortical oscillations may progressively change as a function of development. This study began to fill this vast knowledge gap by using high-density magnetoencephalography to quantify the beta cortical oscillatory activity over a cross-section of typically developing children as they performed an isometric knee target matching task. Advanced beamforming methods were used to identify the spatiotemporal changes in beta oscillatory activity during the motor planning and motor action time frames. Our results showed that a widespread beta event-related desynchronization (ERD) was present across the pre/postcentral gyri, supplementary motor area, and the parietal cortices during the motor planning stage. The strength of this beta ERD sharply diminished across this fronto-parietal network as the children initiated the isometric force needed to match the target. Rank order correlations indicated that the older children were more likely to initiate their force production sooner, took less time to match the targets, and tended to have a weaker beta ERD during the motor planning stage. Lastly, we determined that there was a relationship between the child’s age and the strength of the beta ERD within the parietal cortices during isometric force production. Altogether our results suggest that there are notable maturational changes during childhood and adolescence in beta cortical oscillatory activity that are associated with the planning and execution of leg motor actions.
Keywords: Children, Leg, Magnetoencephalography, Parietal, Sensorimotor
Introduction
Prior experimental work has well established that the brain maintains and updates an internal model that is used to formulate a motor plan for predicting the ideal muscle synergies that will achieve a motor goal (Shadmehr 2004; Wolpert 2007). This internal model is based on the sensory feedback in response to prior attempts at the motor task, and knowledge of the success in achieving the goal state. Over the past decade, neuroimaging of movement-related brain activity has substantially advanced our understanding of how humans plan and produce goal directed movements. Prior positron-emission tomography (PET) and functional magnetic resonance imaging (fMRI) studies have shown that the production of motor actions involves the activation of a distributed network that includes the primary sensorimotor cortices, secondary somatosensory area, supplementary motor area (SMA) and the cingulate motor areas, with activity in each of these regions being stronger in the contralateral hemisphere but generally present in both hemispheres (Luft et al. 2002; Sahyoun et al. 2004; MacIntosh et al. 2004; Kapreli et al. 2006). In addition, such studies also established that the production of motor actions involves regionally-specific subcortical activations within the basal ganglia, thalamus and cerebellum. More recent fMRI experimental work has identified that the locus of motor planning activity likely involves distributed network activation across the fronto-parietal cortices, primary motor cortices, premotor cortices, the SMA and the dorsolateral prefrontal cortices (Beurze et al. 2007; Gallivan et al. 2011, 2013; Valyear and Frey 2015).
Our understanding of the brain networks that serve the planning and execution of motor actions is largely based on experiments with the upper extremities. In fact, there is a vast knowledge gap on the neural regions that are involved in the production of leg motor actions. Studying leg motor actions has historically been more difficult due to the increased probability of head movements, the greater chance of artifacts resulting from the movement of the large leg mass within the MRI scanner’s magnetic field, and the challenge of building magnetically silent devices that can be used to concurrently measure the biomechanics of the leg motor actions while in a supine position (Seto et al. 2001; Barry et al. 2010). Outcomes from the few investigations that have been conducted have shown that the production of self-paced toe, ankle, and knee motor actions arise from the same cortical and subcortical areas seen in the prior upper extremity experiments, but emanate from different neural populations within each area (Johannsen et al. 2001; Luft et al. 2002; Dobkin et al. 2004; Ciccarelli et al. 2005; Kapreli et al. 2006; de Almeida et al. 2015). However, beyond this anatomical information, we still have limited understanding of how these cortical areas are involved in the planning and production of leg motor actions.
Outcomes from electroencephalography (EEG), magnetoencephalography (MEG) and invasive electrocorticography (ECoG) experiments have shown that prior to the onset of movement, cortical oscillatory activity decreases in the beta frequency range (15–30 Hz) and this is sustained throughout the majority of the movement (Pfurtscheller and Berghold 1989; Crone et al. 1998; Cassim et al. 2000; Kaiser et al. 2001; Alegre et al. 2002; Pfurtscheller et al. 2003; Kilner et al. 2005; Jurkiewicz et al. 2006; Miller et al. 2007; Wilson et al. 2010; Tzagarakis et al. 2010; Wilson et al. 2011, 2014; Heinrichs-Graham and Wilson 2015a). This decrease in the amount of power within the beta frequency band, commonly termed beta desynchronization, is thought to reflect task-related changes in the firing rate of local populations of neurons, as they begin to prepare for the specific demands of the pending motor action. The consensus is that this beta event-related desynchronization (ERD) is related to the formulation of a motor plan, because it occurs well before the onset of movement and is influenced by the certainty of the movement pattern to be performed (Kaiser et al. 2001; Alegre et al. 2003; Tzagarakis et al. 2010; Grent-‘t-Jong et al. 2014; Heinrichs-Graham and Wilson 2015b; Tzagarakis et al. 2015). Typical beta ERD responses involve widespread bilateral activity across the fronto-parietal cortical areas, with the strongest maxima contralateral to the effector producing the motor action and following the basic homuncular topology seen in the pre/post central gyrus. Additional areas of concurrent beta ERD activity often include the premotor area, SMA, parietal cortices and mid cingulate (Jurkiewicz et al. 2006; Tzagarakis et al. 2010; Wilson et al. 2014; Tzagarakis et al. 2015). Once again these insights have primarily been derived from finger or hand movements, as only a limited number of MEG/EEG investigations have been performed for self-paced leg motor actions. The outcomes from these investigations have shown that a similar beta ERD can be seen in the electrodes that overlie the rolandic region (e.g., Cz; Neuper and Pfurtscheller 1996, 2001; Wheaton et al. 2008), but these studies did not identify the anatomical correlates. Thus, despite these initial insights, we still have an incomplete understanding of the spatial location and inherent dynamics of the beta oscillations that serve leg motor actions.
Compared with adults, children take longer to plan their leg motor actions and their motor plans are often inaccurate (Davies et al. 2015). These behavioral results imply that the cortical computations that are used for motor planning may not be fully established in children. A related hypothesis is that the information processing speed may be slower in children because the white matter tracts that support the planning and execution of motor actions are not fully developed (Scantlebury et al. 2014). Prior MEG investigations have also shown that the strength of the beta ERD during finger movements may systematically increase in the contralateral primary motor cortices as children mature (Gaetz et al. 2010), while systematically decreasing in secondary motor regions (e.g., SMA, cerebellum, and parietal; Wilson et al. 2010). Potentially, these results suggest that older children have greater certainty in the cortical computations that are involved in the planning of motor actions, and consequently rely less on input from secondary motor regions because their neurological system is more mature. However, this view is considerably speculative, as only a limited number of studies have evaluated the developmental trajectory of the cortical dynamics.
In summary, there are clear gaps in the scientific literature on the cortical beta oscillatory activity that is associated with the production of leg motor actions, and in how these cortical oscillations may progressively change as a function of development. The objective of the current investigation was to use high-density MEG to begin to address these knowledge gaps by quantifying the spatiotemporal dynamics of cortical beta oscillations in a group of children and adolescents who were performing a goal directed target-matching task with the knee joint.
Materials and Methods
Subjects
The Institutional Review Board at the University of Nebraska Medical Center reviewed and approved the protocol for this investigation. Twenty typically developing children between the ages of 11–19 years of age with no neurological, cognitive or musculoskeletal impairments participated in this investigation. All of the parents provided written consent that their child could participant in the investigation and the children assented.
MEG Data Acquisition and Experimental Paradigm
The neuromagnetic responses were acquired with a bandwidth of 0.1–330 Hz and were sampled continuously at 1 kHz using an Elekta Neuromag system (Helsinki, Fin-land) with 306 MEG sensors, including 204 planar gradiometers and 102 magnetometers. All recordings were conducted in a one-layer magnetically-shielded room with active shielding engaged for advanced environmental noise compensation. During data acquisition, the children were monitored via real-time audio–video feeds from inside the shielded room. A custom built head stabilization device that consisted of a series of inflatable airbags that surrounded the sides of the head and filled the void between the head and MEG dewar was worn for all data collections. This system stabilized the head and reduced the probability of any large head movements occurring during the data collections.
The children were seated upright in a magnetically silent chair during the experiment. A custom-built magnetically silent force transducer was developed for this investigation to measure the isometric knee extension forces generated by the children (Fig. 1a). This device consisted of a 20 × 10 cm airbladder that was inflated to 317 kPa, and fixed to the anterior portion of the lower leg just proximal to the lateral malleoli. A thermoplastic shell encased the outer portion of the airbladder and was secured to the chair with ridged strappings. Changes in the pressure of the airbag as the child generated an isometric contraction were quantified by an air pressure sensor (Phidgets Inc., Calgary, Alberta, CA) and were subsequently converted into units of force.
Fig. 1.
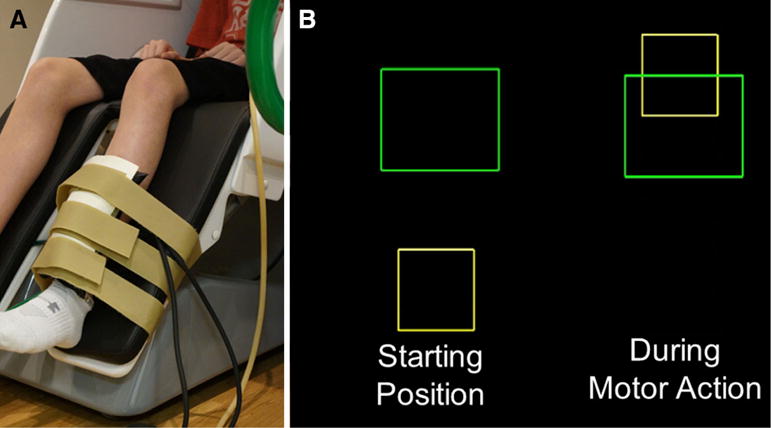
a Depiction of the custom-built pneumatic force transducer that is positioned just proximal to the lateral malleolus of the child. b The isometric knee extension force generated by the child animates the yellow box to ascend vertically to match the green target box (Color figure online)
The experimental paradigm involved the child generating an isometric knee extension force with their left knee that was directed at matching target forces that were between 5 and 30 % of the child’s maximum isometric knee extension force. The target force was visually displayed as a box and the force generated by the child was shown as a smaller box that was animated vertically, based on the isometric force generated (Fig. 1b). The target forces were presented in a random order, and a successful match occurred when the box that represented the child’s isometric force was inside the target box for 0.3 s. A fixation cross was displayed on the screen after the child matched the target. The stimuli were shown on a back-projected screen that was approximately ~1 m in front of the child and at eye-level. The epochs of each trial were 10 s in duration (−5.0 to +5.0 s), with the onset of the isometric force defined as 0.0 s. For the experiment, each child completed 120 target matching trials in order to optimize the signal-to-noise ratio of the MEG data collections. Potential fatigue effects were mitigated in this investigation since there was ample time between muscular contractions, and the presented targets were at a low-force level that was specific to each participant’s maximal force capacity.
MEG Coregistration & Structural MRI Processing
Structural MRI data were acquired using a Philips Achieva 3T scanner. High-resolution T1-weighted sagittal images were obtained with an eight-channel head coil using a 3D fast field echo sequence with the following parameters: FOV: 24 cm, 1 mm slice thickness, no gap, in-plane resolution of 1.0 × 1.0 mm and sense factor of 2.0.
Four coils were affixed to the head of the child and were used for continuous head localization during the MEG experiment. Prior to the experiment, the location of these coils, three fiducial points and the scalp surface were digitized to determine their three-dimensional position (Fastrak 3SF0002, Polhemus Navigator Sciences, Colchester, VT, USA). Once the child was positioned for MEG recording, an electric current with a unique frequency label (e.g., 322 Hz) was fed to each of the four coils. This induced a measurable magnetic field and allowed each coil to be localized in reference to the sensors throughout the recording session. Since the coil locations were also known in head coordinates, all MEG measurements could be transformed into a common coordinate system. With this coordinate system (including the scalp surface points), each child’s MEG data were coregistered with native space structural T1-weighted MRI data using the three external landmarks (i.e., fiducials) and the digitized scalp surface points prior to source space analyses. Structural MRI data were aligned parallel to the anterior and posterior commissures and transformed into the Talairach coordinate system (Talairach and Tournoux 1988) using BrainVoyager QX version 2.2 (Brain Innovations, The Netherlands).
MEG Pre-processing, Time–Frequency Transformation, & Statistics
Using the MaxFilter software (Elekta), each MEG data set was individually corrected for any subtle head motion that may have occurred during task performance, and subjected to noise reduction using the signal space separation method with a temporal extension (Taulu and Simola 2006). Artifact rejection was based on a fixed threshold method, supplemented with visual inspection. The continuous magnetic time series was divided into epochs of 10.0 s in duration. For all time windows, 0.0 s was defined as the onset of the isometric force and the baseline was defined as −3.9 to −3.6 s. Artifact-free epochs for each sensor were transformed into the time–frequency domain using complex demodulation (resolution: 2.0 Hz, 0.025 s) and averaged over the respective trials. These sensor-level data were normalized by dividing the power value of each time–frequency bin by the respective bin’s baseline power, which was calculated as the mean power during the −3.9 to −3.6 s time period. This baseline time window was selected based on our inspection of the sensor level absolute power data, which showed that this time period was quiet and did not encapsulate the peri-movement beta ERD. The specific beta time–frequency windows used for imaging were determined by statistical analysis of the sensor-level spectrograms across the entire array of gradiometers. Each data point in the spectrogram was initially evaluated using a mass univariate approach based on the general linear model. To reduce the risk of false positive results while maintaining reasonable sensitivity, a two stage procedure was followed to control for Type 1 error. In the first stage, one-sample t-tests were conducted on each data point and the output spectrogram of t-values was thresholded at p < 0.05 to define time–frequency bins containing potentially significant oscillatory deviations across all participants and conditions. In stage two, time–frequency bins that survived the threshold were clustered with temporally and/or spectrally neighboring bins that were also above the (p < 0.05) threshold, and a cluster value was derived by summing all of the t-values of all data points in the cluster. Nonparametric permutation testing was then used to derive a distribution of cluster-values and the significance level of the observed clusters (from stage one) were tested directly using this distribution (Ernst 2004; Maris and Oostenveld 2007). For each comparison, at least 10,000 permutations were computed to build a distribution of cluster values. Further information about this method is available in our recent papers (Heinrichs-Graham et al. 2014, 2016; Wilson et al. 2014, 2015; Heinrichs-Graham and Wilson 2015a, b; Proskovec et al. 2016).
These analyses identified that significant peri-movement beta ERD was present in a large number of sensors near the sensorimotor cortex in the 16–24 Hz beta range from about 0.3 s before movement onset until about 1.2 s afterward (p < 0.0001, corrected). In order to identify the dynamics more precisely, the time range of the significant 16–24 Hz beta ERD activity was divided into 5 non-overlapping time windows (i.e., −0.3 to 0.0 s, 0.0–0.3 s, 0.3–0.6 s, 0.6–0.9 s, and 0.9–1.2 s), and the mean power within these windows were independently imaged in each participant using a baseline period of −3.9 to −3.6 s to determine the time dependent changes within the precise brain regions generating these significant oscillatory responses.
MEG Source Imaging & Statistics
A minimum variance vector beamforming algorithm was employed to calculate the source power across the entire brain volume (Gross et al. 2001). The single images were derived from the cross spectral densities of all combinations of MEG sensors within the beta frequency (16–24 Hz) and time ranges of interest, and the solution of the forward problem for each location on a grid specified by input voxel space. Following convention, the source power in these images were normalized per subject using a separately averaged pre-stimulus noise period of equal duration and bandwidth (van Veen et al. 1997; Hillebrand et al. 2005). Thus, the normalized power per voxel was computed for the beta ERD over the entire brain volume per participant at 4.0 × 4.0 × 4.0 mm resolution. Each child’s functional images, which were co-registered to anatomical images prior to beamforming, were transformed into standardized space using the transform previously applied to the structural MRI volume and spatially resampled (Talairach and Tournoux 1988). MEG pre-processing and imaging used the BESA software (BESA v6.0; Grafelfing, Germany).
One-sample t-tests were used to calculate statistical parametric maps (SPM) showing regions with significant beta oscillatory activity. Images were thresholded at (p < 0.001) and a cluster-based correction method (i.e., 40 contiguous voxels), based on the theory of Gaussian random fields, was applied to the supra-threshold voxels to reduce the risk of false positive findings resulting from the multiple comparisons. Thus, we imaged these responses using beamforming, and statistically evaluated the resulting 3D maps of functional brain activity using a mass univariate approach based on the general linear model. The amplitude values of the peak beta voxels in specific time bins were subsequently extracted for each child for further analyses.
Motor Behavioral Data
The output of the force transducer was concurrently collected at 1 kHz during the MEG experiment and was used to quantify the child’s motor performance. The formulation of the motor plan was assumed to be behaviorally represented by the child’s reaction time. The reaction time was calculated based on the time from when the target was presented to when force production was initiated. The amount of error in the feedforward execution of the motor plan was behaviorally quantified based on the percent overshoot of the target. Finally, the time to match the target was used to quantify the online corrections that were made after the initial motor plan was executed. The online corrections were calculated based on the time difference between the reaction time and the time to reach the target.
Relationship Between Age, Beta ERD and Motor Performance
Spearman rho rank order correlations were used to determine the rank order relationships between the amplitudes of the peak beta voxels within the respective time bins, the child’s age and the respective motor behavioral data. All statistical analysis were performed with SPSS statistical software (IBM, Armonk, NY) using a 0.05 alpha level.
Results
Temporal Evolution of the Beta Oscillations
Figure 2 displays the anatomical time course of beta ERD activity prior to and throughout the goal directed isometric leg motor task. As seen in this figure, a beta ERD response endured throughout the leg motor task. However, it was strongest during the motor planning period (−0.3 to 0.0 s) and encompassed the medial pre/postcentral gyri, SMA and inferior/superior parietal cortices bilaterally. Within this area of significant activity, local maximums (i.e., peak voxels) were identified in the leg region of the left and right pre/post-central gyri, as well as the left superior parietal lobule.
Fig. 2.
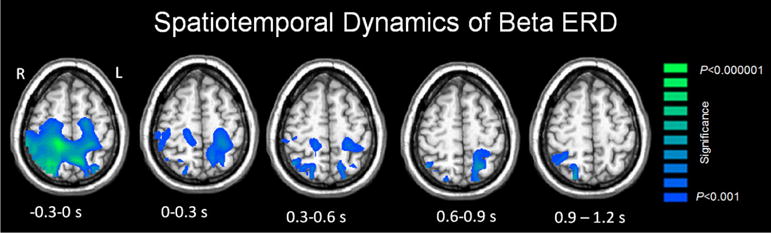
Statistical parametric maps (SPMs) showing the dynamics of beta oscillations (16–24 Hz) during the isometric knee extension motor task. The images have been thresholded at (p < 0.001, cluster-corrected) and are displayed following the radiological convention (R = L). As shown, there was a prominent beta ERD that was spread across the pre/postcentral gyri, SMA and parietal cortices during the motor planning stage (−0.3 to 0.0 s). The strength of the beta ERD diminished across all brain regions as children initiated the isometric knee extension force towards the displayed target (0.0–0.3 s), and this decline in beta ERD amplitude progressively continued throughout the isometric knee extension task (0.0–1.2 s)
During the 0.0–0.3 s time period, the strength of the beta ERD decreased in all regions identified in the earlier time bin (−0.3 to 0.0 s), although significant activity was sustained in the three local maximums of interest. Beta ERD continued to decrease in the subsequent 0.3–0.6 s time window, and progressively diminished in amplitude and became more spatially restricted in the 0.6–0.9 and 0.9–1.2 s time windows. In fact, within the final 0.9–1.2 s time window, the cortical location of the beta ERD was restricted to the right superior parietal cortices.
Relationship Between Age, Beta ERD and Motor Performance
There was a positive rank order correlation between the reaction time and the amplitude of the beta ERD in the parietal cortices during the 0–0.3 s (rho = 0.50; p = 0.02; Fig. 3a) and the 0.3–0.6 s time frames (rho = 0.46; p = 0.03; Fig. 3b). These correlations suggest that a weaker beta ERD within the parietal cortices during these time frames was associated with a slower reaction time. We additionally found a positive rank order correlation between the time to match the target and the amplitude of the beta ERD in the parietal cortices during the 0.0–0.3 s time frame (rho = 0.49; p = 0.04; Fig. 3c). Hence, a longer time to match the target was also related to a weaker beta ERD during the early portion of the motor action.
Fig. 3.
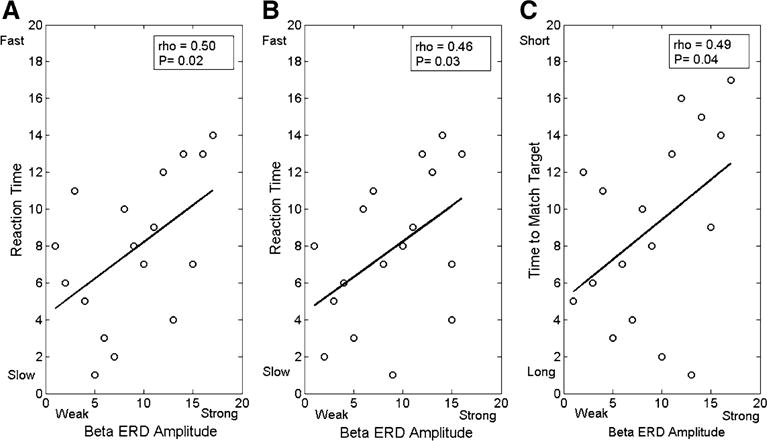
Rank order correlations between a the strength of the beta event-related desynchronization (ERD) within the parietal cortices during the 0.0–0.3 s time window and the child’s reaction time, b the strength of the beta ERD within the parietal cortices during the 0.3–0.6 s time window and the child’s reaction time, c the strength of the beta ERD within the parietal cortices during the 0.0–0.3 s time window and the time to match the target. Overall these correlations imply that a stronger beta ERD within the parietal cortices during the motor action time frame was related to a slower reaction time and longer time to match the target. All correlations were significant at (p < 0.05)
There were also negative rank order correlations between reaction time and the child’s age (rho = −0.52; p = 0.02; Fig. 4a), and the time to match the target and the child’s age (rho = −0.46; p = 0.03; Fig. 4b). These correlations implied that older children tended to have a faster reaction time and took less time to match the target. We also found a positive rank order correlation between the strength of the beta ERD in the superior parietal cortices during the −0.3 to 0.0 s time frame and the child’s age (rho = 0.46; p = 0.03; Fig. 4c). This relationship suggests that older children tended to have a weaker beta ERD in secondary motor cortices during the motor planning stage. Lastly, we also identified a negative rank order correlation between the strength of the beta ERD within the superior parietal cortices during the 0.3–0.6 s time frame and the child’s age (rho = −0.50; p = 0.02; Fig. 4d). This correlation implied that the older children had a stronger beta ERD during the early portion of the isometric force production.
Fig. 4.
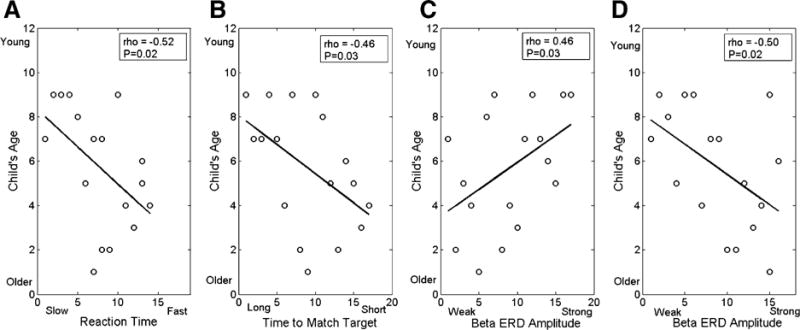
Rank order correlations between a the child’s reaction time and age, b time to match the target and age, c the strength of the beta ERD within the parietal cortices during the motor planning period (−0.3 to 0.0 s) and the child’s age, and d the strength of the beta ERD within the parietal cortices during the isometric force performance period (0.3–0.6 s) and the child’s age. Overall these correlations imply that the older children had faster reaction times and took less time to match the target. In addition, the older children also tended to have a weaker ERD during the motor planning period and a stronger ERD during the performance period
Discussion
There is currently a void in the scientific literature on the cortical beta oscillatory activity that is associated with the production of leg motor actions. In addition, we have limited data on how these cortical oscillations may progressively change as a function of development. This investigation used high-density MEG to begin to fill these knowledge gaps by quantifying the spatiotemporal dynamics of cortical beta oscillations across a cross-section of typically developing children who performed a goal-directed isometric target-matching task with their knee joint. Our results showed that there was a prominent beta ERD that spanned the fronto-parietal cortices during the motor planning stage, and that the strength of this beta ERD became weaker and more spatially restricted as the children converged towards matching the target force. Our results also suggested that the strength of the beta ERD dynamics were related to the child’s age and the characteristics of their motor performance.
Our MEG results showed that there was a prominent beta ERD that was spread across the pre/postcentral gyri, SMA and parietal cortices during the motor planning stage. These results concur with prior studies that have reported broad activity across fronto-parietal regions when planning finger and hand motor actions (Jurkiewicz et al. 2006; Tzagarakis et al. 2010; Wilson et al. 2010, 2011, 2014; Tzagarakis et al. 2015; Heinrichs-Graham and Wilson 2015; Kurz et al. 2014a). Within this broad area of activity, there were local maximas present in the leg region of the pre/post central gyri bilaterally, as well as the left superior parietal cortices. Such neural activity in the parietal cortex supports the notion that this cortical area is involved in planning of the sensorimotor transformations that are necessary for visually guided motor actions (Buneo and Anderson 2006; Beurze et al. 2007; Gallivan et al. 2011, 2013; Valyear and Frey 2015), whereas the activity within the leg region of the medial pre/post-central gyri likely represents the initialization of the motor actions that will be executed by the lower extremity musculature.
The beta ERD became notably weaker and more spatially restricted in both hemispheres as the child generated the knee isometric forces to match the target. During the initial onset of the isometric force (0.0–0.3 s), the maximal activity was located within the parietal cortices. Shortly thereafter, the strongest beta ERD responses were bilateral and located within the pre/post central gyri (0.3–0.6 s). We suggest that these temporal dynamics may represent the parietal cortices initiating online corrections to the feed-forward motor command, followed by these corrections being implemented by the sensorimotor cortices. Our premise for this notion is supported by a prior transcranial magnetic stimulation (TMS) study, which showed that disrupting the parietal cortices impacts the online corrections of feedforward motor actions (Della-Maggiore et al. 2004). In the later time windows (0.6–1.2 s), the participant was closer to completing the target matching task and the peak activity resided within the superior parietal cortices of both hemispheres. This sustained activity within the parietal cortices may be related to neural computations serving the extended visuomotor transformations, which would be needed for matching the target in the current task.
Our rank order correlation analysis identified that a longer reaction time was related to a weaker beta ERD within the left parietal cortices during the 0.0–0.6 s time period. Additionally, we found that a weaker beta ERD within the parietal cortices during the 0.0–0.3 s time period was related to a longer time to match the target. Together these results implied that a weaker beta ERD during the isometric force production was related to a delay in initiating the movement and accurately completing the motor task. A prior investigation highlighted that the parietal cortex is likely involved in processing temporal information for assessing sensory perceptions and motor actions (Bueti et al. 2008). Potentially these correlations imply that a weaker beta ERD within the parietal cortices during the movement is related to the recognition of an aberrant feedforward motor plan, due to temporal inconsistencies between incoming sensory feedback the ongoing motor action.
There were negative rank order correlations between the child’s age, reaction time and time to match the target. These findings suggested that the older children tended to have faster reaction times and took less time to match the targets. This relationship concurs with prior studies that have shown that younger children take longer to initiate and match targets that are within the hand, arm and knee range of motion workspace (Yan et al. 2000; Contreras-Vidal et al. 2005; Davies et al. 2015). We suggest that the noted age-motor performance correlations may indicate that younger children have an internal model that is more primitive due to fewer experiences with visuomotor transformations.
There also was a negative rank order correlation between the child’s age and the strength of the beta ERD within the superior parietal cortices during the motor planning stage. This relationship implied that the older children tended to have a weaker beta ERD while planning their motor action, which is consistent with a prior study of finger movements that found that the strength of motor-related beta oscillatory activity systematically decreases in secondary motor regions throughout development (Wilson et al. 2010). The current working hypothesis is that a weaker beta ERD during the motor planning stage likely represents a greater amount of certainty for successfully completing a motor action (Kaiser et al. 2001; Alegre et al. 2003; Tzagarakis et al. 2010; 2015). Hence, it is plausible that the weaker beta ERD seen in this study may indicate that older children had greater confidence in performing the neural computations for successfully matching the target. This notion is reinforced by the age-motor performance correlations indicating that older children spent less time planning and correcting their feedforward motor actions.
Our correlation analyses also indicated that the older children tended to have a stronger beta ERD within the superior parietal cortices during the 0.3–0.6 s time window. Aligned with our prior interpretation, we suggest that the weaker beta ERD seen in the younger children during this time period may reflect temporal inconsistencies between incoming sensory feedback and the ongoing motor action. This perspective aligns with our view that the age-beta ERD relationships are related to the maturation of the internal model. Along a similar line, we did not observe a significant post-movement beta rebound in this study (PMBR). This neural response is thought to reflect sensory feedback and is commonly seen in motor control studies of adults (e.g., Wilson et al. 2014). However, prior developmental studies have shown that the PMBR response is absent in children (Gaetz et al. 2010), and our results are fully consistent with such findings.
The results of this investigation have begun to illuminate how development may influence the cortical beta oscillations that are involved in the planning and execution of leg motor actions. Pharmacological studies have revealed that the strength of the beta ERD measured by MEG is related to GABAergic activity in local interneurons (Muthukumaraswamy et al. 2013; Hall et al. 2011). In addition, magnetic resonance spectroscopy (MRS) studies have shown that older children may have greater concentrations of the inhibitory GABA neurotransmitter within the sensorimotor cortices (Gaetz et al. 2011). Taken together, it is possible that the age related beta ERD correlations seen in this investigation may be partially driven by increased activity in GABAergic interneurons with development. Although this premise seems feasible, further studies are necessary to explore how changes in GABA neurotransmitter levels may be intertwined with the changes in beta cortical oscillations seen in this investigation. More importantly, there is a critical need to identify at what developmental stage the cortical oscillations converge with what is seen in adults. We suspect that this developmental change will be partially linked with the maturation of the fiber tracts that serve the cortical areas identified in this investigation. Understanding this potential link is critical for advancing translational studies of the sensorimotor system in patients with developmental disabilities (e.g., Kurz et al. 2014b, 2015a, b; Wilson et al. 2016), and should be considered high priority for clinical studies of motor control.
Acknowledgments
This work was supported by Grants from the National Institutes of Health (5R21-HD077532, 1R01-HD086245) and the National Science Foundation (NSF 1539067).
References
- Alegre M, Labarga A, Gurtubay IG, Iriarte J, Malanda A, Artieda J. Beta electroencephalograph changes during passive movements: sensory afferences contribute to beta event-related desynchronization in humans. Neurosci Lett. 2002;331(1):29–32. doi: 10.1016/s0304-3940(02)00825-x. [DOI] [PubMed] [Google Scholar]
- Alegre M, Gurtubay IG, Labarga A, Iriarte J, Malanda A, Artieda J. Alpha and beta oscillatory changes during stimulus-induced movement paradigms: effect of stimulus predictability. Neuroreport. 2003;14(3):381–385. doi: 10.1097/00001756-200303030-00017. [DOI] [PubMed] [Google Scholar]
- Barry RL, Williams JM, Klassen LM, Gallivan JP, Culham JC, Menon RS. Evaluation of preproscessing steps to compensate for magnetic field distortions due to body movements in BOLD fMRI. Magn Reson Imaging. 2010;28:235–244. doi: 10.1016/j.mri.2009.07.005. [DOI] [PMC free article] [PubMed] [Google Scholar]
- Beurze SM, de Lange FP, Toni I, Medendrop WP. Integration of target and effector information in the human brain during reach planning. J Neurophys. 2007;97:188–199. doi: 10.1152/jn.00456.2006. [DOI] [PubMed] [Google Scholar]
- Bueti D, Walsh V, Frith C, Rees G. Different brain circuits underlie motor and perceptual representations of temporal intervals. J Cogn Neurosci. 2008;20(2):204–214. doi: 10.1162/jocn.2008.20017. [DOI] [PubMed] [Google Scholar]
- Buneo CA, Anderson RA. The posterior parietal cortex: sensorimotor interface for the planning and online control of visually guided movements. Neuropsychologia. 2006;44:2594–2606. doi: 10.1016/j.neuropsychologia.2005.10.011. [DOI] [PubMed] [Google Scholar]
- Cassim F, Szurhaj W, Sediri H, Devos D, Bourriez JL, Poirot I, Derambure P, Defebvre L, Guieu JD. Brief and sustained movements: differences in event-related (de)synchronization (ERD/ERS) patterns. Clin Neurophys. 2000;111:2032–2039. doi: 10.1016/s1388-2457(00)00455-7. [DOI] [PubMed] [Google Scholar]
- Ciccarelli O, Toosy AT, Marsden JF, Wheeler-Kinshott CM, Sahyoun C, Matthews PM, Miller DH, Thompson AJ. Identifying brain regions for integrative sensorimotor processing with ankle movements. Exp Brain Res. 2005;166:31–42. doi: 10.1007/s00221-005-2335-5. [DOI] [PubMed] [Google Scholar]
- Contreras-Vidal JL, Bo J, Boudreau JP, Clark JE. Development of visuomotor representations for hand movement in young children. Exp Brain Res. 2005;162(2):155–164. doi: 10.1007/s00221-004-2123-7. [DOI] [PubMed] [Google Scholar]
- Crone NE, Miglioretti DL, Gordon B, Lesser RP. Functional mapping of human sensorimotor cortex with electrocorticographic spectral analysis. II. Event-related synchronization in the gamma band. Brain. 1998;121:2301–2315. doi: 10.1093/brain/121.12.2301. [DOI] [PubMed] [Google Scholar]
- Davies BL, Gehringer JE, Kurz MJ. Age-related differences in the motor planning of a lower leg target matching task. Hum Mov Sci. 2015;44:299–306. doi: 10.1016/j.humov.2015.10.002. [DOI] [PMC free article] [PubMed] [Google Scholar]
- De Almeida PMD, Vieira AICMD, Canario NIS, Castelo-Branco M, Caldas ALD Brain activity during lower-limb movement with manual facilitation: an fMRI study. Neurol Res Int. 2015;701452:1–14. doi: 10.1155/2015/701452. [DOI] [PMC free article] [PubMed] [Google Scholar]
- Della-Maggiore V, Malfait N, Ostry DJ, Paus T. Stimulation of the posterior parietal cortex interferes with arm trajectory adjustments during the learning of new dynamics. J Neurosci. 2004;24(44):9971–9976. doi: 10.1523/JNEUROSCI.2833-04.2004. [DOI] [PMC free article] [PubMed] [Google Scholar]
- Dobkin BH, Firestine A, West M, Saremi K, Woods R. Ankle dorsiflexion as an fMRI paradigm to assay motor control for walking during rehabilitation. NeuroImage. 2004;23:370–381. doi: 10.1016/j.neuroimage.2004.06.008. [DOI] [PMC free article] [PubMed] [Google Scholar]
- Ernst MD. Permutation methods: a basis for exact inference. Stat Sci. 2004;19(4):676–685. [Google Scholar]
- Gaetz W, MacDonald M, Cheyne D, Snead OC. Neuromagnetic imaging of movement-related cortical oscillations in children and adults: age predicts post-movement beta rebound. NeuroImage. 2010;51:792–807. doi: 10.1016/j.neuroimage.2010.01.077. [DOI] [PubMed] [Google Scholar]
- Gaetz W, Edgar JC, Wang DJ, Roberts TP. Relating MEG measured motor cortical oscillation to resting c-aminobutyric acid (GABA) concentration. NeuroImage. 2011;55(2):616–621. doi: 10.1016/j.neuroimage.2010.12.077. [DOI] [PMC free article] [PubMed] [Google Scholar]
- Gallivan JP, McLean DA, Valyear KF, Pettypiece CE, Culham J. Decoding action intentions from preparatory brain activity in human parieto-frontal networks. J Neurosci. 2011;31(26):9599–9610. doi: 10.1523/JNEUROSCI.0080-11.2011. [DOI] [PMC free article] [PubMed] [Google Scholar]
- Gallivan JP, McLean DA, Flanagan JR, Culham JC. Where one hand meets the other: limb-specific and action-dependent movement plans decoded from preparatory signals in single human frontoparietal brain areas. J Neurosci. 2013;33(5):1991–2008. doi: 10.1523/JNEUROSCI.0541-12.2013. [DOI] [PMC free article] [PubMed] [Google Scholar]
- Grent-’t-Jong T, Oostenveld R, Jensen O, Medendorp WP, Praamstra P. Competitive interactions in sensorimotor cortex: oscillations express separation between alternative movement targets. J Neurophys. 2014;112(2):224–232. doi: 10.1152/jn.00127.2014. [DOI] [PMC free article] [PubMed] [Google Scholar]
- Gross J, Kujala J, Hamalainen M, Timmermann L, Schnitzler A, Salmelin R. Dynamic imaging of coherent sources: studying neural interactions in the human brain. Proc Nat Acad Sci. 2001;98:694–699. doi: 10.1073/pnas.98.2.694. [DOI] [PMC free article] [PubMed] [Google Scholar]
- Hall SD, Standford IM, Yamawaki N, McAllister N, Ronnqvist KC, WoodHall GL, Furlong PL. The role of GABAergic modulation in motor function related neuronal network activity. NeuroImage. 2011;56:1506–1510. doi: 10.1016/j.neuroimage.2011.02.025. [DOI] [PubMed] [Google Scholar]
- Heinrichs-Graham E, Wilson TW. Spatiotemporal oscillatory dynamics during the encoding and maintenance of a visual working memory task. Cortex. 2015a;69:121–130. doi: 10.1016/j.cortex.2015.04.022. [DOI] [PMC free article] [PubMed] [Google Scholar]
- Heinrichs-Graham E, Wilson TW. Coding complexity in the human motor circuit. Hum Brain Mapp. 2015b;36(12):5155–5167. doi: 10.1002/hbm.23000. [DOI] [PMC free article] [PubMed] [Google Scholar]
- Heinrichs-Graham E, Wilson TW, Santamaria PM, Heithoff SK, Torres-Russotto D, Hutter-Saunders JA, Estes KA, Meza JL, Mosley RL, Gendelman HE. Neuromagnetic evidence of abnormal movement-related beta desynchronization in Parkinson’s disease. Cereb Cortex. 2014;24(10):2669–2678. doi: 10.1093/cercor/bht121. [DOI] [PMC free article] [PubMed] [Google Scholar]
- Heinrichs-Graham E, Arpin DJ, Wilson TW. Cue-related temporal factors modulate movement-related beta oscillatory activity in the human motor circuit. J Cogn Neurosci. 2016;11:1–13. doi: 10.1162/jocn_a_00948. [DOI] [PMC free article] [PubMed] [Google Scholar]
- Hillebrand A, Singh KD, Holliday IE, Furlong PL, Barnes GR. A new approach to neuroimaging with magnetoencephalography. Hum Brain Mapp. 2005;25:199–211. doi: 10.1002/hbm.20102. [DOI] [PMC free article] [PubMed] [Google Scholar]
- Johannsen P, Christensen LOD, Sinkjaer T, Nielsen JB. Cerebral functional anatomy of voluntary contractions of ankle muscles in man. J Physiol. 2001;535:397–406. doi: 10.1111/j.1469-7793.2001.00397.x. [DOI] [PMC free article] [PubMed] [Google Scholar]
- Jurkiewicz MT, Gaetz WC, Bostan AC, Cheyne D. Post-movement beta rebound is generated in the motor cortex: evidence from neuromagnetic recordings. NeuroImage. 2006;32:1281–1289. doi: 10.1016/j.neuroimage.2006.06.005. [DOI] [PubMed] [Google Scholar]
- Kaiser J, Birbaumer N, Lutzenberger W. Event-related beta desynchroniztion indicates timing of response selection in a delayed-response paradigm in humans. Neurosci Lett. 2001;312:149–152. doi: 10.1016/s0304-3940(01)02217-0. [DOI] [PubMed] [Google Scholar]
- Kapreli E, Athanasopoulos S, Papathanasiou M, van Hecke P, Strimpakos N, Gouliamos A, Peeters R, Sunaert S. Lateralization of brain activity during lower limb joint movement. An fMRI study. NeuroImage. 2006;32:1709–1721. doi: 10.1016/j.neuroimage.2006.05.043. [DOI] [PubMed] [Google Scholar]
- Kilner J, Bott L, Posada A. Modulations in the degree of synchronization during ongoing oscillatory activity in the human brain. Eur J Neurosci. 2005;21:2547–2554. doi: 10.1111/j.1460-9568.2005.04069.x. [DOI] [PubMed] [Google Scholar]
- Kurz MJ, Becker KM, Heinrichs-Graham E, Wilson TW. Neurophysiological abnormalities in the sensorimotor cortices during the motor planning and movement execution stages of children with cerebral palsy. Dev Med Child Neurol. 2014a;56(11):1072–1077. doi: 10.1111/dmcn.12513. [DOI] [PMC free article] [PubMed] [Google Scholar]
- Kurz MJ, Heinrichs-Graham E, Arpin DJ, Becker KM, Wilson TW. Aberrant synchrony in the somatosensory cortices predicts motor performance errors in children with cerebral palsy. J Neurophysiol. 2014b;111(3):573–579. doi: 10.1152/jn.00553.2013. [DOI] [PMC free article] [PubMed] [Google Scholar]
- Kurz MJ, Becker KM, Heinrichs-Graham E, Wilson TW. Children with cerebral palsy have uncharacterisitc somatosensory cortical oscillations after mechanoreceptor stimulation. Neuroscience. 2015a;305:67–75. doi: 10.1016/j.neuroscience.2015.07.072. [DOI] [PMC free article] [PubMed] [Google Scholar]
- Kurz MJ, Heinrichs-Graham E, Becker KM, Wilson TW. The magnitude of somatosensory cortical activity is related to the mobilty and strength impairments seen in children with cerebral palsy. J Neurophysiol. 2015b;113:3143–3150. doi: 10.1152/jn.00602.2014. [DOI] [PMC free article] [PubMed] [Google Scholar]
- Luft AR, Smith GV, Forrester L, Whitall J, Macko RF, Hauser TK, Goldberg AP, Hanley DF. Comparing brain activation associated with isolated upper and lower limb movement across corresponding joints. Hum Brain Mapp. 2002;17:131–140. doi: 10.1002/hbm.10058. [DOI] [PMC free article] [PubMed] [Google Scholar]
- MacIntosh BJ, Mraz R, Baker N, Staines WR, Graham SJ. Optimizing the experimental design for ankle dorsiflexion fMRI. NeuroImage. 2004;22:1619–1627. doi: 10.1016/j.neuroimage.2004.03.035. [DOI] [PubMed] [Google Scholar]
- Maris E, Oostenveld R. Nonparametric statistical testing of EEG- and MEG-data. J Neurosci Methods. 2007;164(1):177–190. doi: 10.1016/j.jneumeth.2007.03.024. [DOI] [PubMed] [Google Scholar]
- Miller KJ, Leuthardt EC, Schalk G, Rao RPN, Anderson NR, Moran DW, Miller JW, Ojemann JG. Spectral changes in cortical surface potentials during motor movement. J Neurosci. 2007;27(9):2424–2432. doi: 10.1523/JNEUROSCI.3886-06.2007. [DOI] [PMC free article] [PubMed] [Google Scholar]
- Muthukumaraswamy SD, Myers JFM, Wilson SJ, Nutt DJ, Lingford-Hughes A. The effect of elevated endogenous GABA levels on movement related network oscillations. NeuroImage. 2013;66:36–41. doi: 10.1016/j.neuroimage.2012.10.054. [DOI] [PubMed] [Google Scholar]
- Neuper C, Pfurtscheller G. Post-movement synchronization of beta rhythms in the EEG over the cortical foot area in man. Neurosci Lett. 1996;216:17–20. doi: 10.1016/0304-3940(96)12991-8. [DOI] [PubMed] [Google Scholar]
- Neuper C, Pfurtscheller G. Evidence for distinct beta resonance frequencies in human EEG related to specific sensorimotor cortical areas. Clin Neurophys. 2001;112:2084–2097. doi: 10.1016/s1388-2457(01)00661-7. [DOI] [PubMed] [Google Scholar]
- Pfurtscheller G, Berghold A. Patterns of cortical activation during planning of voluntary movement. Electroencephalogr Clin Neurophysiol. 1989;72(3):250–258. doi: 10.1016/0013-4694(89)90250-2. [DOI] [PubMed] [Google Scholar]
- Pfurtscheller G, Graimann B, Huggins JE, Levine SP, Schuh LA. Spatiotemporal patterns of beta desynchronization and gamma synchronization in corticographic data during self-paced movement. Clin Neurophys. 2003;114:1226–1236. doi: 10.1016/s1388-2457(03)00067-1. [DOI] [PubMed] [Google Scholar]
- Proskovec AL, Heinrichs-Graham E, Wilson TW. Aging modulates the oscillatory dynamics underlying successful working memory encoding and maintenance. Hum Brain Mapp. 2016;37:2348–2361. doi: 10.1002/hbm.23178. [DOI] [PMC free article] [PubMed] [Google Scholar]
- Sahyoun C, Floyer-Lea A, Johansen-Berg H, Matthews PM. Towards an understanding of gait control: brain activation during the anticipation, preparation and execution of foot movements. NeuroImage. 2004;21:568–575. doi: 10.1016/j.neuroimage.2003.09.065. [DOI] [PubMed] [Google Scholar]
- Scantlebury M, Cunningham T, Dockstader C, Laughlin S, Gaetz W, Rockel C, Dickson J, Mabbott D. Relations between white matter maturation and reaction time in childhood. J Int Neuropsychol Soc. 2014;20:99–112. doi: 10.1017/S1355617713001148. [DOI] [PubMed] [Google Scholar]
- Seto E, Sela G, McIlroy WE, Black SE, Staines WR, Bronskill MJ, McIntosh AR, Graham SJ. Quantifying head motion associated with motor tasks used in fMRI. NeuroImage. 2001;14:284–297. doi: 10.1006/nimg.2001.0829. [DOI] [PubMed] [Google Scholar]
- Shadmehr R. Generalization as a behavioral window to the neural mechanisms of learning internal models. Hum Mov Sci. 2004;23:543–568. doi: 10.1016/j.humov.2004.04.003. [DOI] [PMC free article] [PubMed] [Google Scholar]
- Talairach G, Tournoux P. Co-planar stereotaxic atlas of the human brain. Thieme; New York: 1998. [Google Scholar]
- Taulu S, Simola J. Spatiotemporal signal space separation method for rejecting nearby interference in MEG measurements. Phys Med Biol. 2006;51(7):1759–1768. doi: 10.1088/0031-9155/51/7/008. [DOI] [PubMed] [Google Scholar]
- Tzagarakis C, Ince NF, Leuthold AC, Pellizzer GP. Beta-band activity during motor planning reflects response uncertainty. J Neurosci. 2010;30(4):11270–11277. doi: 10.1523/JNEUROSCI.6026-09.2010. [DOI] [PMC free article] [PubMed] [Google Scholar]
- Tzagarakis C, West S, Pellizzer G. Brain oscillatory activity during motor preparation: effect of directional uncertainty on beta, but not alpha, frequency band. Front Neurosci. 2015;9(1–13):2015. doi: 10.3389/fnins.2015.00246. [DOI] [PMC free article] [PubMed] [Google Scholar]
- Valyear KF, Frey SH. Human posterior parietal cortex mediates hand-specific planning. NeuroImage. 2015;114:226–238. doi: 10.1016/j.neuroimage.2015.03.058. [DOI] [PMC free article] [PubMed] [Google Scholar]
- van Veen BD, van Drongelen W, Yuchtman M, Suzuki A. Localization of brain electrical activity via linearly constrained minimum variance spatial filtering. IEEE Trans Biomed Eng. 1997;44:867–880. doi: 10.1109/10.623056. [DOI] [PubMed] [Google Scholar]
- Wheaton LA, Carpenter M, Mizelle JC, Forrester L. Preparatory band specific premotor cortical activity differentiates upper and lower extremity movement. Exp Brain Res. 2008;184:121–126. doi: 10.1007/s00221-007-1160-4. [DOI] [PMC free article] [PubMed] [Google Scholar]
- Wilson TW, Slason E, Asherin R, Kronberg E, Teale PD, Reite ML, Rojas DC. An extended motor network generates beta and gamma oscillatory perturbations during development. Brain Cogn. 2010;73(2):75–84. doi: 10.1016/j.bandc.2010.03.001. [DOI] [PMC free article] [PubMed] [Google Scholar]
- Wilson TW, Slason E, Asherin R, Kronberg E, Teale PD, Reite ML, Rojas DC. Abnormal gamma and beta MEG activity during finger movements in early-onset psychosis. Dev Neuropsychol. 2011;36(5):596–613. doi: 10.1080/87565641.2011.555573. [DOI] [PMC free article] [PubMed] [Google Scholar]
- Wilson TW, Heinrichs-Graham E, Becker KM. Circadian modulation of motor-related beta oscillatory responses. NeuroImage. 2014;102:531–539. doi: 10.1016/j.neuroimage.2014.08.013. [DOI] [PMC free article] [PubMed] [Google Scholar]
- Wilson TW, Heinrichs-Graham E, Becker KM, Aloi J, Robertson KR, Sandkovsky U, White ML, O’Neill J, Knott NL, Fox HS, Swindells S. Multimodal neuroimaging evidence of alterations in cortical structure and function in HIV-infected older adults. Hum Brain Mapp. 2015;36(3):897–910. doi: 10.1002/hbm.22674. [DOI] [PMC free article] [PubMed] [Google Scholar]
- Wilson TW, Heinrichs-Graham E, Proskovec AL, McDermott TJ. Neuroimaging with magnetoencephalography: a dynamic view of brain pathophysiology. Transl Res. 2016 doi: 10.1016/j.trsl.2016.01.007. [DOI] [PMC free article] [PubMed] [Google Scholar]
- Wolpert DM. Probabilistic models in human sensorimotor control. Hum Move Sci. 2007;26:511–524. doi: 10.1016/j.humov.2007.05.005. [DOI] [PMC free article] [PubMed] [Google Scholar]
- Yan JH, Thomas JR, Stelmach GE, Thomas KT. Developmental features of rapid aiming arm movements across the lifespan. J Motor Behav. 2000;32(2):121–140. doi: 10.1080/00222890009601365. [DOI] [PubMed] [Google Scholar]