Abstract
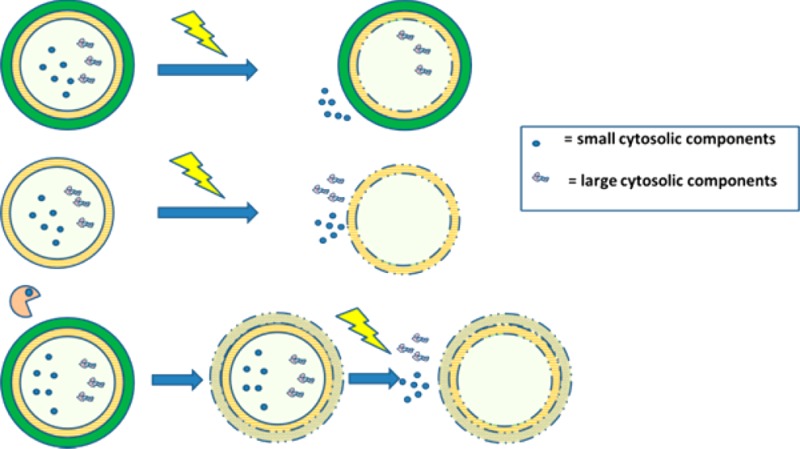
Pulsed electric field (PEF) is considered to be a very promising technology for mild cell disruption. The application of PEF for microalgae that have a rigid cell wall, however, is hampered by the presence of that rigid outer cell wall. A cell wall free mutant of C. reinhardtii was used to mimic pretreated microalgae with removed cell wall, to investigate the possibility of using PEF for protein release from microalgae. A complete release of hydrophilic proteins from the cell wall free mutants was observed whereas PEF treatment on the cell wall containing species resulted in substantially lower protein yields. Additional experiments showed that even at low energy input (0.05 kWh/kgbiomass), still about 70% of the proteins could be released with respect to bead beating as reference. These released proteins were water-soluble while the hydrophobic chlorophyll remained mainly entrapped in cell particles. SEM-analysis of these cell particles showed that PEF only opened the cells, instead of completely fragmenting them into smaller particles. These results indicate that PEF is an energy-efficient cell disruption method for selective release of water-soluble proteins, after the microalgal outer cell wall is removed. Enzymatic pretreatment to degrade the cell walls before PEF treatment was shown to be an efficient method to remove the cell wall.
Keywords: Microalgae, Mild cell disruption, Selective release, Multiproduct biorefinery
Short abstract
Enzyme-assisted pulsed electric field treatment is developed as novel approach for mild, selective protein release in a multiproduct microalgae biorefinery.
Introduction
Biorefineries can be used to extract various components (e.g., proteins, carbohydrates, lipids, pigments) from microalgae. A bottleneck in the biorefinery chain is cell disruption. As the proteins are a generally vulnerable, but valuable, biomass fraction, cell disruption technologies need to be low-cost and mild.
At the moment, various technologies are under investigation. Typically they can be classified as mechanical (e.g., bead milling), physical (e.g., pulsed electric field), or (bio)chemical (e.g., enzymatic cell disruption).1 Various studies have reported a successful disruption of the cells, followed by a release of intact, intracellular components at low energy input. Examples are bead milling2 and steam explosion.3
However, current cell disruption methods commonly have drawbacks such as high cost or shortcomings in mildness.1,4,5 Pulsed electric field (PEF) has been proposed as a potentially low-cost and mild alternative.1,6 Although PEF is regarded as promising, previous work showed that the release of large intracellular components is hampered, making PEF as yet unsuitable for microalgal cell disruption.6−9
In most cases the success of PEF for various applications is attributed to a reverse in the transmembrane potential (TMP), resulting in an opening of the cell membranes.9,10 When the change in TMP is sufficiently high, large openings in the membrane are formed. These openings allow the release of cytosolic components.11
Although the application of a sufficiently high field strength may result in an opening of the cell membrane, the rigid outer cell wall of most microalgae may remain unaffected.12 Therefore, as a result of PEF treatment, only small inorganic salts can freely migrate, while large cytosolic molecules remain intracellularly entrapped.13 This would explain why only small components such as ions were successfully released in previous research while most proteins remained entrapped after PEF treatment.6−8
The hypothesis that PEF treatment of microalgae is hindered by the rigid outer cell wall was investigated by subjecting the cell wall containing microalgae C. reinhardtii (cc-124) and its cell wall deficient mutant (cc-400) to PEF. By assuming that the cell wall deficient mutant (cc-400) mimics pretreated microalgal biomass, we could characterize the effect of the operating conditions on treated cell wall deficient microalgae. The ability to weaken microalgae with potential cell wall degrading enzymes prior to PEF was tested on the wild-type strain (cc-124). Based on the results of this study, an outlook on future steps that need to be taken in the development of PEF as novel technology for microalgae is provided.
Experimental Section
Strain and Medium Composition
Both the wild type strain C. reinhardtii cc-124 and the cell wall deficient mutant strain cc-400 were obtained from the Chlamydomonas Resource Centre (www.chlamycollection.org). The biomass was cultivated in culture medium adapted from the work of Breuer et al.:14 NaNH4 16.8 mM; Na2SO4 3.5 mM; HEPES 100.1 mM; MgSO4·7H2O 5.0 mM; CaCl2·2H2O 2.4 mM; K2HPO4 2.5 mM; Na2EDTA·2H2O 0.08 mM; MnCl2·4H2O 0.02 mM; ZnSO4·7H2O 0.004 mM; CoCl2·6H2O 0.001 mM; CuSO4·5H2O 0.001 mM; Na2MoO4·2H2O 0.0001 mM; NaFeEDTA 0.028 mM, 10.0 mM NaHCO3.
Biomass Cultivation and Pretreatment
Shake flask cultivation was used to evaluate PEF treatment on C. reinhardtii wild type (cc-124) and its cell wall deficient (cc-400). The flasks were orbitally shaken at 90 rpm, cultured at 25 °C, and continuously illuminated at 50 or 120 μmol/m2·s. From this incubator, samples of were taken and used for further experiments.
The screening of operating conditions as well as the evaluation of PEF-treatment at low energy input was performed using the cell wall deficient mutant C. reinhardtii cc-400. It was cultivated in a stirred tank reactor with a 2.2 L working volume (Applikon, The Netherlands). In the reactor, continuous illumination was applied at constant incident light intensity of 200 μmol/m2·s. pH was controlled using CO2-dosing on demand at a set point of pH 7.0 ± 0.1. As the pH was controlled by CO2-sparging, ammonium was replaced by urea as nitrogen source in the culture medium. The microalgae were continuously harvested (chemostat operation) and stored for maximal 24 h in an ice-cooled and dark stored harvesting vessel.
To reduce to conductivity prior to the PEF experiments, the harvested biomass was washed twice by centrifugation at a low shear regime (1500 rpm). For higher energy input PEF-experiments (>2 kWh/kgDW), washing proceeded with 0.04%w/w NaCl. For other experiments washing with demiwater was used. To ensure that no cells were damaged during the pretreatment, samples were analyzed prior to PEF treatment on the dry weight, conductivity, soluble proteins, and released chlorophyll (data not shown).
Initial experiments with enzymes as pretreatment prior to PEF were performed. For these experiments, the wild type C. reinhardtii cc-124 was cultivated in shake flasks at a light intensity of 50 μmol/m2·s. The cells were harvested at the end of the log-phase and were washed with demiwater before the enzymes were added.
In all experiments, the biomass concentration ranged between 2 and 4 g/L.
Pulsed Electric Field
The conditions needed for PEF treatment were tested in a batch electroporation apparatus (Gene-Pulser XcellTM Bio-Rad, USA), which was described in ‘t Lam et al.:7
Disposable treatment cuvettes were used with a gap width of either 4 or 2 mm and a treatment volume of respectively 800 or 400 μL (Westburg Pulsestar Electroporation Cuvettes). After preparation of the biomass, samples were taken for further analysis. The cuvettes were filled and subjected to PEF treatment. When multiple pulses were applied, a pulse interval of 10 s was used. Immediately after the PEF treatment, the temperature was manually measured, and it never exceeded 30 °C.
In all experiments, square wave monopolar pulses were applied. The number of pulses ranged from 1 to 15 pulses, the applied field strength ranged from 0.5 to 15 kV/cm, and the pulse length varied between 0.05 and 0.2 ms.
After PEF treatment, a 1 h resting time was applied using a rotational mixer to allow the release of cytosolic components. After this incubation time, the samples were centrifuged at 1500 rpm for 10 min.
The samples taken after PEF treatment and the samples of the washed biomass before PEF treatment were then analyzed on dry weight, conductivity, protein and chlorophyll content, and particle size distribution.
The results obtained with washed cells subjected to PEF treatment were compared with the results of washed cells that were subjected to bead beating. Bead beating was performed as a positive control. In these experiments, beat beater tubes (“Lysing matrix E”, MP biomedicals) were subjected to three disruption cycles at 6500 rpm for 1 min with a 2 min interval.
Enzyme-Assisted PEF
To explore the potential of enzymatic incubation as pretreatment of the wild type Chlamydomonas cc-124, an initial screening of three potentially cell wall degrading enzymes (cellulase - CAS 9012-54-8, protease - CAS 9014-01-1, and lysozyme - CAS 12650-88-3) was performed. From these preliminary tests, only the protease was found to be effective (see Supporting Information section C).
The protease was further used to further investigate the potential of using enzymes to remove the rigid outer cell wall prior to PEF treatment. In these experiments, a 6-h incubation at room temperature and pH 7.7 was performed. After incubation, the cells were washed with milli-Q water to remove the enzymes and a subsequent PEF-treatment was applied. The applied PEF conditions were 5 pulses with 0.1 ms pulse length at 7.5 kV/cm. As negative control a sample of washed C. reinhardtii cc-124 cells that were not treated with the enzyme, was used. The sample was incubated for 6 h at room temperature and pH 7.7 as well (negative control). As positive control, washed cells treated with bead beating were used and treated similar to the samples of the negative control.
Analysis
Dry Weight and Conductivity
Dry weight analysis was determined according to the work of Lamers et al.15 According to ‘t Lam et al.,7 the conductivity of the samples was determined.
Soluble Protein Release
Modified Lowry protein assays (Thermo-scientific) were used to analyze the water-soluble protein content in the samples taken according to our previous work:7 After colorimetric reaction, absorbance was measured spectrophotometrically at a wavelength of 750 nm. The total protein content was determined using total nitrogen analysis (“Kjehldahl”) and a conversion factor for C. reinhardtii of 4.58.16
Native PAGE Analysis
To evaluate if PEF is mild, native-PAGE analysis of the released proteins after PEF was performed. The protein RubisCo is a well characterized protein with a size of 540 kDa. It has therefore been used as a marker to confirm the degree of mildness.8
Degree of Disruption
Before and after cell disruption, particle size distributions (PSD) were determined using a Beckman Coulter Counter.17 Samples were diluted using Isotonic Buffer Solution (Beckman Coulter). Analyses proceeded using either a 50 μm aperture tube (PEF-samples) or a 100 μm aperture tube (bead beated samples).
Chlorophyll Extraction
After cell disruption, the spectrophotometric method of Postma et al.4 was used to determine the release of pigment in the aqueous phase. The wavelength scans were executed at a wavelength from 400 up to 750 nm.
To test if hydrophilic proteins were selectively released after PEF, additional chlorophyll extraction was performed. After cell disruption, the cell debris was separated from the supernatant using centrifugation at 1500 rpm for 10 min. After centrifugation, the supernatant was replaced with an equal volume of methanol. Methanol incubation proceeded at 40 °C for 1 h. After extraction, the solvent phase was separated again by centrifugation (1500 rpm, 10 min), and adsorptions were determined spectrophotometrically according to Safi et al.18
The PEF treated samples were compared with a sample of cells that were bead beated in methanol and a sample of the pellet obtained after bead beating, that was subjected to chlorophyll extraction (bead beaten + extracted). In addition, to quantify the release without using solvents or cell disruption, samples were subjected to water extraction at 40 °C.
After extraction, the chlorophyll content was measured and quantified spectrophotometrically in the methanol solvent phase according to the work of Ritchie.19
SEM Analysis
SEM analysis was performed to reveal how cells were affected by the PEF and bead beating. Samples were prepared similar to the protocol described in ‘t Lam et al.:20
Biomass was transferred to a poly-l-lysine coverslip. After 1 h, the slip was carefully rinsed with a PBS-buffer and the samples were fixated using a 3% glutaraldehyde solution in PBS buffer for 1 h. An additional fixation step using a 1% OsO4 solution and a 1 h incubation step were performed. After fixation, cells were dehydrated using ethanol and dried using critical point CO2 drying. The coverslips were finally coated with a 15 nm tungsten layer using a sputter-coater.
The prepared samples were imaged at 2 kV, 6 pA, at room temperature using a field emission scanning electron microscope (Magellan 400, FEI Company, Oregon, USA) located at the Wageningen Electron Microscopy Centre (Wageningen, NL).
Data Analysis
Energy Input
The applied energy input was calculated using the work of ‘t Lam et al.:7
| 1 |
In this equation, E = the electric field applied (V/m), tp is the pulse length (s), and N is the number of pulses applied. The conductivity “σ” was measured prior to the PEF treatment (S/m), and the biomass concentration (Cx) was provided in kilograms dry weight per cubic meter.
Protein yield
The protein yield was calculated as the increase in water-soluble proteins divided over the total protein concentration:4
| 2 |
Degree of Disruption
From the particle size distributions, a degree of disruption (%) was calculated by dividing the amount of particles present in the size interval (3–15 μm) after disruption treatment over the amount of particles that were originally present in this size interval:
In these calculations, a size interval ranging between 3 and 15 μm was used as, often, microalgae have a cell size ranging between 2 and 10 μm. In the case of our used microalgae, it had during growth a cell size of 4–5 μm.
Results and Discussion
Evaluating the performance of PEF
By subjecting C. reinhardtii (cc-124) and a cell wall deficient mutant C. reinhardtii (cc-400) to PEF treatment, the effect of a cell wall on the performance of PEF was determined. If the cell wall indeed limits the performance of PEF, a difference in release of intracellular compounds after PEF is expected between the wild type and the cell wall deficient mutant.
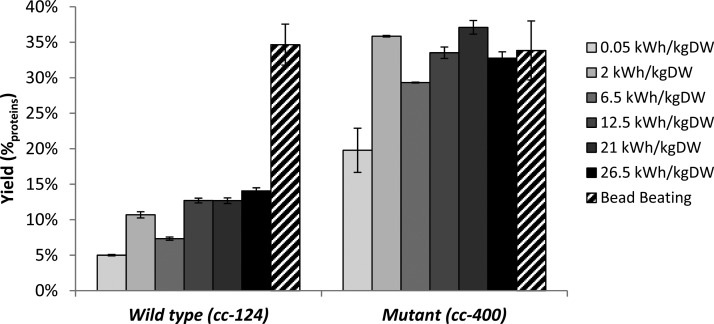
Figure 1 shows, the obtained protein yield (%proteins) after PEF treatment with both strains. In these experiments, a wide range of operating conditions was applied (5–7.5 kV/cm; 1–10 pulses and a pule length 0.05–0.2 ms). In addition to the protein yields obtained after PEF treatment, the protein yields after bead beating are presented as well (positive control).
Figure 1.
Effect of PEF treatment on cell wall containing microalgae and cell wall deficient mutants in comparison to bead beating as positive control. Bead beating was performed in biological triplicates as the positive control (n = 3). PEF experiments are performed in technical replicates (n = 2) with the exception of the 0.05 kWh/kgDW experiments (biological replicates, n = 2).
The protein yields obtained after PEF treatment on the cell wall deficient mutant are on average three times higher as the ones obtained with the wild type (P < 0.05) (Figure 1). With the cell wall deficient mutant an average protein yield of 31 ± 6%proteins was obtained. These results thereby illustrate that PEF-treatment on cell wall less microalgae results in protein yields similar to mechanical cell disruption. Applying PEF on the wild type species resulted in an average protein yield of only 11 ± 3%proteins. The protein yields obtained with the wild type (cc-124) after PEF treatment are similar to those found for other microalgae with a rigid outer cell wall, like Chlorella vulgaris, Neochloris oleoabundans, and Auxenochlorella protothecoides.6−8 The study of ‘t Lam et al.7 even showed that PEF allowed at least a 4-fold lower protein release than bead milling. It is therefore reasonable that in general, protein release by means of PEF is limited by the presence of an outer cell wall.4
Additional experiments were performed with the cell wall deficient mutant (cc-400) to confirm the high protein yields at low energy input (Supporting Information section A). A low energy input is relevant considering that for a bulk scenario, the maximum energy input should not exceed 0.68 kWh/kgDW.21 At an energy input similar to the threshold provided by Coons et al.,21 the protein yield was 23%proteins (0.5 kWh/kgDW). This high protein release at low energy input was confirmed in 24 independent experiments. With an energy input ranging between 0.05 and 0.5 kWh/kgDW, the protein yield was indeed 23%proteins ± 3.3 (Supporting Information section A). These results confirm that at an energy input >2 kWh/kgDW complete release of hydrophilic proteins is possible whereas at extremely low energy inputs still 70% of the proteins could be released, compared to bead beating.
Native PAGE revealed that during the PEF treatment RubisCo kept its native form (Supporting Information section ‘B’). As native RubisCo was present in the supernatant after PEF, it confirms that PEF allows a mild release of proteins.
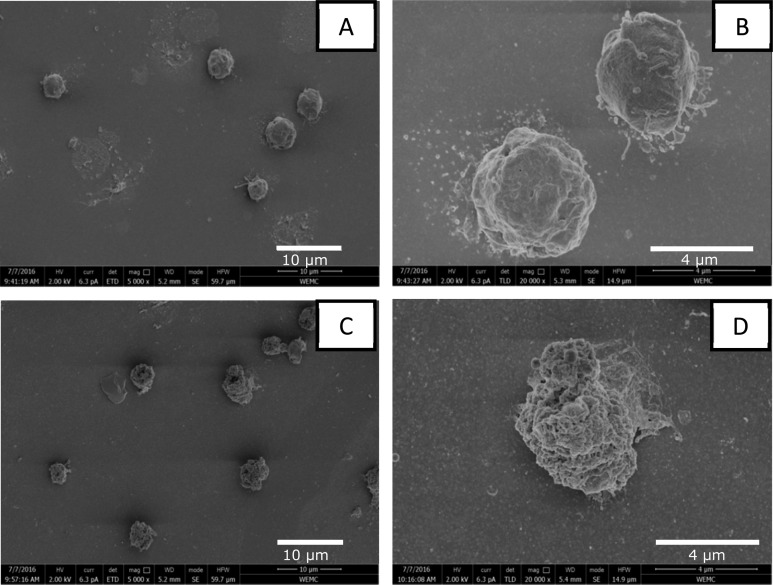
Interestingly, the high protein yields after PEF are not associated with a high degree of cell disruption. While bead beating resulted in 99% of disrupted biomass, PEF treatment at low energy input resulted in only 27% (Supporting Information section A). This is in agreement with the low release of chlorophyll. Compared to bead beating as a positive control, PEF yielded only up to 5% chlorophyll release in the aqueous phase (data not shown). These results indicate that the cells were not completely disintegrated into fine particles. To confirm if the cells after PEF were indeed not completely disintegrated, additional SEM analysis was performed (Figure 2). In Figure 2, PEF-treated samples (7.5 kV/cm, 3 pulses at 0.1 ms pulse length) were washed but nontreated cells were included as control.
Figure 2.
SEM images. (A and B) Nontreated samples at a 5000× and 20 000× magnification. (C and D) Cells treated at 7.5 kV/cm, 3 pulses, and 0.1 ms pulse length at a 20 000× magnification.
Figure 2A and B illustrate that the untreated cells of the cell wall free mutants (cc-400) were intact and not broken by either the washing or the applied fixation protocol. The cells have a diameter of approximately 4.5 μm and a smooth surface. After PEF treatment the cells still seem to be intact (Figure 2). These results suggest that PEF is mild and does not disrupt the cells into small particles. This is in agreement with the low degree of disruption that was observed (Supporting Information section A) and the presence of native RubisCo in the supernatant. The presence of native RubisCo confirms that PEF indeed releases proteins without completely disrupting the cells. Contrary to PEF, after bead beating, however, no cells, or even cell debris and other biological material, could be observed anymore (data not shown).
Influence of Operating Parameters on the Protein Yield
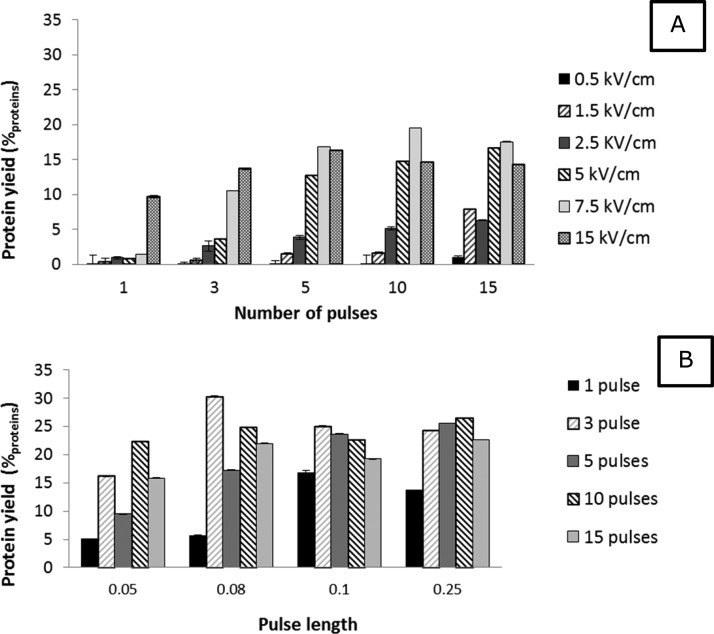
Although the hindering role of the cell wall during PEF treatment for protein release is confirmed, it is not known how the operating conditions affect the efficiency in opening microalgae cell walls. To explore how the operating conditions influence the protein release from cell wall deficient microalgae, a screening of operating conditions was performed using C. reinhardtii cc-400. The operating parameters for PEF that were used to evaluate the effect of PEF on protein yield were the number of pulses (1–15 pulses), pulse length (0.05–0.25 ms), and the applied field strength (0.5–15 kV/cm). In all experiments, the biomass concentration ranges between 2 and 3 g/L, and the pulse interval was in all experiments 10 s. In all experiments, the energy input did not exceed 0.5 kWh/kgDW. The results of this parameter screening are presented in Figure 3.
Figure 3.
Parameter screening on the cell wall deficient mutant cc-400. The protein yield after PEF treatment is presented as a function of the number of pulses (A + B), field strength (A) and pulse length (B). Biomass concentration ranged between 2.5 and 3.7 g/L. Error bars represent technical replicates (n = 2).
Figure 3A presents the effect of the number of pulses (pulse length of 0.05 ms) at six different field strengths. The field strength has a major effect on the release of proteins irrespective of the number of pulses applied (Figure 2A). With a field strength equal or lower than 1.5 kV/cm, only up to 5%proteins were released. At 2.5 and 5 kV/cm, however, the yields became already higher (∼5 and 20%proteins). At field strengths equally or higher than 7.5 kV/cm, in all cases substantial higher protein yields were observed compared to the lower field strengths (>10%proteins difference in yield). The exceptions on this observation are the experiments performed with 1 pulse and 15 pulses. With 1 pulse, only 15 kV/cm resulted in a substantially higher protein yield. At 15 pulses, already a field strength of 1.5 kV/cm resulted in higher protein yields. However, it is likely that with 15 pulses Ohmic heating occurred, leading to additional damage of the cells.
The results shown in Figure 3A strongly indicate the presence of a critical transmembrane potential (c-TMP). According to the literature, PEF is only successful in opening the cell membrane if a field strength is applied that evokes a TMP which is high enough to reverse the charge of the cell membrane. When this c-TMP is reached, reformation and subsequent opening of those membranes occurs.9
By using an average cell size of 4.5 μm and a field strength ranging between 2.5 and 5 kV/cm, we estimated the c-TMP for C. reinhardtii cc-400, to be between 1 and 2 V. Although slightly higher, this range is still in agreement with the critical TMP of 0.4–1.0 V reported for C. reinhardtii by Azencott et al.12 In their work on the development of a transformation protocol for C. reinhardtii using electroporation, they used a cell wall deficient mutant strain as well. They showed that a critical potential up to 1 V was needed for successful delivery of the protein BSA.12
After determining that a field strength of 7.5 kV/cm results in a successful opening of the cell membrane, additional experiments at this field strength were performed to investigate the effect of the pulse length in combination with the number of pulses on the protein yield (Figure 3-B). During these experiments, the biomass concentration ranged between 2 and 3 g/L. The pulse length was varied between 0.05 and 0.2 ms. The number of pulses ranged between 1 and 15 pulses.
The protein yields obtained with the experiments at a pulse length of 0.05 ms are lower than the ones obtained at other pulse lengths (Figure 3B). Besides the lower yields at a short pulse length (0.05 ms), it appears that at all pulse lengths, a single pulse treatment results in lower yields compared to the experiments performed with more pulses. The lower yields obtained with either a single pulse or with pulses of 0.05 ms suggest that next to a threshold field-strength, the total treatment time also influences the performance of PEF. It may be that a minimal treatment time is required to allow sufficient charging and reformation of the cell membrane.
Interestingly, the protein yields that are presented in Figure 2 are in all cases lower as the protein yields obtained with the cell wall deficient mutant (cc-400) at higher energy input (>2 kWh/kgDW, Figure 1). These results suggest that not only the operating conditions, but also the energy input as overall parameter affects the protein yield.
Selective Release of Hydrophilic Components
The results showed that high protein yields were obtained in combination with a low pigments release at low energy inputs, thereby suggesting that PEF is a selective technology. In addition, no complete disintegration occurred during PEF while only low amounts of chlorophyll were observed in the supernatant. The combination of those observations suggests that it is likely that only hydrophilic proteins were released and the hydrophobic chlorophyll remained entrapped. A selective release of hydrophilic proteins is desired as it may result in a less intensive fractionation in the later biorefinery stages.
As a selective release is advantageous for the further biorefinery, chlorophyll extraction from the treated biomass was performed using methanol. For these studies, additional experiments (above the c-TMP) at 7.5 kV/cm, 0.08 ms, 3 pulses, and 5 pulses were performed. After disrupting the algae, the pellet was subjected to additional extraction. Besides performing a methanol extraction on PEF treated and bead beated samples, bead beating in methanol was performed.
An initial observation revealed that the supernatant after bead beating contains substantially more chlorophyll as the supernatant obtained after PEF treatment (Figure 4). The high chlorophyll release during bead beating was confirmed by the low extraction yields using methanol extraction (Figure 4). Different from bead beating, methanol extraction from the PEF treated samples appears to result in high extraction efficiencies (Figure 4).
Figure 4.
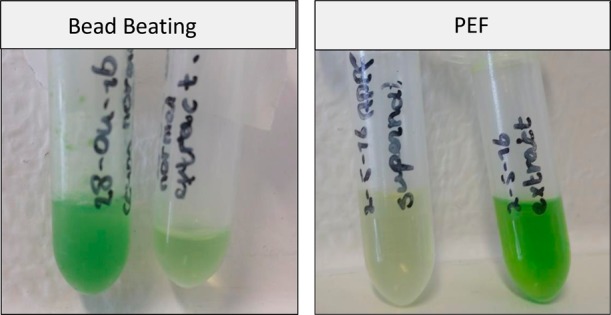
Pictures of the supernatant after cell disruption, and the methanol phase after chlorophyll extraction from the remaining cell debris. PEF treatment of 7.5 kV/cm, 0.08 ms, and 5 pulses.
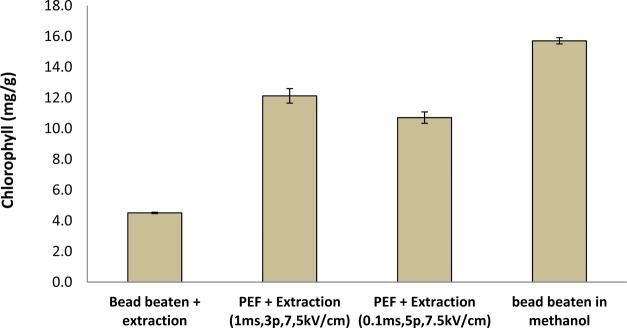
The high chlorophyll extraction efficiency that is presented in Figure 5 confirms that after PEF-treatment, only a small amount of chlorophyll was released. The extraction yield after PEF was approximately 3-fold higher as the yield obtained after bead beating + extraction. This substantially lower extraction efficiency is probably caused by the high degree of disruption in combination with a high chlorophyll release during bead beating.
Figure 5.
Pigment extraction. Samples were PEF treated or bead beaten, and they were collected after centrifugation. Bead beating in methanol is incluced as reference. Error bars represent biological replicates (n = 2).
The results in Figures 4 and 5 evidently show that PEF treatment on cell wall deficient (cc-400) results in a selective release of hydrophilic proteins, allowing hydrophobic extraction afterward. Other work already reported that the combination of PEF with a wet solvent extraction results in increased lipid or pigment yields.22,23 In addition to those results, this work shows that a pretreatment in combination with PEF results in a selective protein release and may facilitate a biorefinery scenario for valorization of multiple components.
Enzymatic Incubation As a Potential Pretreatment for PEF
The previous sections showed that PEF is a very promising technology in terms of protein yield combined with low energy input. It allows a selective release of water-soluble proteins. This is a strong advantage for an integrated biorefinery scenario that requires further fractionation.
It is hypothesized that PEF can be successfully applied if cells are pretreated to remove the cell wall (Figure 2). It has already been suggested to use cell wall degrading enzymes prior to cell disruption to reduce the energy input during cell disruption.24 Similar to such a process, we propose to pretreat algal cells using an enzyme incubation step. Afterward, the weakened cells are treated by an additional PEF-treatment (“E-PEF”).
An initial enzyme screening showed that protease incubation of the wild-type strain (cc-124) at 40 °C, resulted in increased protein yield after PEF (Supporting Information section C). Additional experiments with the protease were performed at room temperature using an enzyme loading of either 4%w/w or 6%w/w.
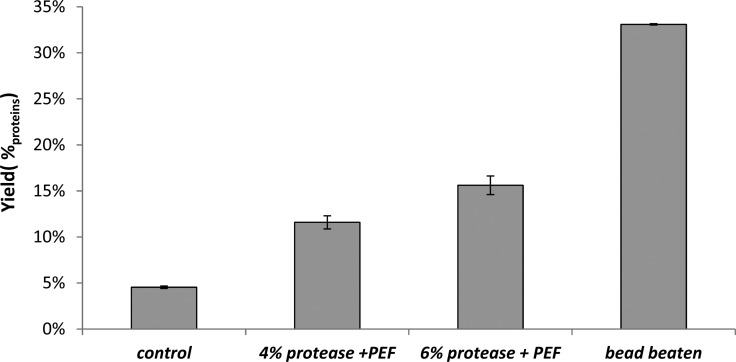
PEF treatment without enzyme addition resulted in a protein yield of 5%protein (Figure 6). Enzymatic incubation with protease resulted in a more than 2-fold increase compared to the control experiment. Although the application of the protease followed by PEF resulted in an increased protein release, compared to PEF-treatment only, the protein yields are still twice as low as those obtained by bead beating.
Figure 6.
E-PEF experiments at room temperature. Samples were loaded with either 4 or 6%w/w enzymes and incubated for 6 h at room temperature at a pH of 7.7. The control sample was treated identically to the other samples with the exception that no proteins were added prior to the incubation. After pretreatment, samples were PEF treatment (5 pulses of 0.1 ms at 7.5 kV/cm). The data of the control experiment originates from Figure 1. Error bars represent biological replicates (n = 2).
To further enhance the performance of PEF by means of a pretreatment, there is a need to further elucidate the structure of microalgal cell walls. When advanced knowledge on microalgal cell walls becomes available, rational development of a (enzymatic) pretreatment becomes possible.
Further development of such a pretreatment prior to PEF may result in a promising and competitive alternative for existing technologies as it releases native proteins at a low energy input in a selective way. It should be noted, however, that when a successful pretreatment becomes reality, in-depth analysis on the scalability, economics, and sustainability should be addressed in future research.
Conclusion
This study showed that the microalgal cell membrane is susceptible for PEF treatment where the outer cell wall remains unaffected. When a successful pretreatment is developed, PEF is a mild disruption technology as it combines a low energy input and selective release of hydrophilic components from cell wall deficient microalgae. Enzymatic weakening of the outer cell wall resulted in substantially higher protein yields after PEF treatment. Although further research on microalgae cell walls is required, this study not only provided a better understanding of PEF on microalgae, but it also presented E-PEF as a novel and promising cell disruption approach.
Acknowledgments
This work is performed within the TKI AlgaePARC Biorefinery program with financial support from The Netherlands’ Ministry of Economic Affairs in the framework of the TKI BioBased Economy under contract no. TKIBE01009. The authors thank Anastasia Piltsii for the fruitful discussions and valuable input on enzyme assisted PEF. The authors thank Marcel Giesbers of the Wageningen Electron Microscopy Centre of Wageningen University for his support with SEM imaging. The authors are grateful for the help received from Wageningen UR Food and Biobased Research and in particular from Jelle van Leeuwen for his help during the total protein determination. The authors are grateful for the help received from Catalina Suarez (Bioprocess Engineering, Wageningen University) with performing Native-PAGE.
Supporting Information Available
The Supporting Information is available free of charge on the ACS Publications website at DOI: 10.1021/acssuschemeng.7b00892.
Part A: protein yield and degree of disruption at a variety of PEF operating conditions. Part B: native-PAGE analysis of released hydrophilic proteins. Part C: preliminary screening of different enzymes for enzymatic pretreatment (PDF)
The authors declare no competing financial interest.
Supplementary Material
References
- Günerken E.; D’Hondt E.; Eppink M. H. M.; Garcia-Gonzalez L.; Elst K.; Wijffels R. H. Cell disruption for microalgae biorefineries. Biotechnol. Adv. 2015, 33, 243–260. 10.1016/j.biotechadv.2015.01.008. [DOI] [PubMed] [Google Scholar]
- Postma P. R.; Miron T. L.; Olivieri G.; Barbosa M. J.; Wijffels R. H.; Eppink M. H. M. Mild disintegration of the green microalgae Chlorella vulgaris using bead milling. Bioresour. Technol. 2015, 184, 297–304. 10.1016/j.biortech.2014.09.033. [DOI] [PubMed] [Google Scholar]
- Lorente E.; Haponiska M.; Clavero E.; Torras C.; Salvado J. Microalgae fractionation using steam explosion, dynamic and tangential cross-flow membrane filtration. Bioresour. Technol. 2017, 237, 3. 10.1016/j.biortech.2017.03.129. [DOI] [PubMed] [Google Scholar]
- Postma P. R.; ‘t Lam G. P.; Barbosa M. J.; Wijffels R. H.; Eppink M. H. M.; Olivieri G.. Microalgal Biorefinery for Bulk and High-Value Products: Product Extraction Within Cell Disintegration. Handbook of Electroporation; Miklavcic D., Ed.; Springer International Publishing: Cham, 2016; pp 1–20. [Google Scholar]
- Vanthoor-Koopmans M.; Wijffels R. H.; Barbosa M. J.; Eppink M. H. M. Biorefinery of microalgae for food and fuel. Bioresour. Technol. 2013, 135, 142–149. 10.1016/j.biortech.2012.10.135. [DOI] [PubMed] [Google Scholar]
- Goettel M.; Eing C.; Gusbeth C.; Straessner R.; Frey W. Pulsed electric field assisted extraction of intracellular valuables from microalgae. Algal Res. 2013, 2, 401–408. 10.1016/j.algal.2013.07.004. [DOI] [Google Scholar]
- ‘t Lam G. P.; Postma P. R.; Fernandes D. A.; Timmermans R. A. H.; Vermuë M. H.; Barbosa M. J.; Eppink M. H. M.; Wijffels R. H.; Olivieri G. Pulsed Electric Field for protein release of the microalgae Chlorella vulgaris and Neochloris oleoabundans. Algal Res. 2017, 24A, 181–187. 10.1016/j.algal.2017.03.024. [DOI] [Google Scholar]
- Postma P. R.; Pataro G.; Capitoli M.; Barbosa M. J.; Wijffels R. H.; Eppink M. H. M.; Olivieri G.; Ferrari G. Selective extraction of intracellular components from the microalga Chlorella vulgaris by combined pulsed electric field–temperature treatment. Bioresour. Technol. 2016, 203, 80–88. 10.1016/j.biortech.2015.12.012. [DOI] [PubMed] [Google Scholar]
- Kotnik T.; Frey W.; Sack M.; Haberl Meglič S.; Peterka M.; Miklavčič D. Electroporation-based applications in biotechnology. Trends Biotechnol. 2015, 33, 480–488. 10.1016/j.tibtech.2015.06.002. [DOI] [PubMed] [Google Scholar]
- Weaver J. C.; Chizmadzhev Y. A. Theory of electroporation: A review. Bioelectrochem. Bioenerg. 1996, 41, 135–160. 10.1016/S0302-4598(96)05062-3. [DOI] [Google Scholar]
- Barba F. J.; Parniakov O.; Pereira S. A.; Wiktor A.; Grimi N.; Boussetta N.; Saraiva J. A.; Raso J.; Martin-Belloso O.; Witrowa-Rajchert D.; Lebovka N.; Vorobiev E. Current applications and new opportunities for the use of pulsed electric fields in food science and industry. Food Res. Int. 2015, 77 (4), 773–798. 10.1016/j.foodres.2015.09.015. [DOI] [Google Scholar]
- Azencott H. R.; Peter G. F.; Prausnitz M. R. Influence of the Cell Wall on Intracellular Delivery to Algal Cells by Electroporation and Sonication. Ultrasound Med. Biol. 2007, 33, 1805–1817. 10.1016/j.ultrasmedbio.2007.05.008. [DOI] [PMC free article] [PubMed] [Google Scholar]
- Madigan M. T.; Martinko J. M.. Brock Biology of Microorganisms; Pearson Prentice Hall: London, 2006. [Google Scholar]
- Breuer G.; Lamers P. P.; Martens D. E.; Draaisma R. B.; Wijffels R. H. The impact of nitrogen starvation on the dynamics of triacylglycerol accumulation in nine microalgae strains. Bioresour. Technol. 2012, 124, 217–226. 10.1016/j.biortech.2012.08.003. [DOI] [PubMed] [Google Scholar]
- Lamers P. P.; van de Laak C. C. W.; Kaasenbrood P. S.; Lorier J.; Janssen M.; De Vos R. C. H.; Bino R. J.; Wijffels R. H. Carotenoid and fatty acid metabolism in light-stressed Dunaliella salina. Biotechnol. Bioeng. 2010, 106, 638–648. 10.1002/bit.22725. [DOI] [PubMed] [Google Scholar]
- Kliphuis A. M.; Klok A. J.; Martens D. E.; Lamers P. P.; Janssen M.; Wijffels R. H. Metabolic modeling of Chlamydomonas reinhardtii: energy requirements for photoautotrophic growth and maintenance. J. Appl. Phycol. 2012, 24 (2), 253–266. 10.1007/s10811-011-9674-3. [DOI] [PMC free article] [PubMed] [Google Scholar]
- de Winter L.; Klok A. J.; Cuaresma Franco M.; Barbosa M. J.; Wijffels R. H. The synchronized cell cycle of Neochloris oleoabundans and its influence on biomass composition under constant light conditions. Algal Res. 2013, 2, 313–320. 10.1016/j.algal.2013.09.001. [DOI] [Google Scholar]
- Safi C.; Liu D. Z.; Yap B. H. J.; Martin G. J. O.; Vaca-Garcia C.; Pontalier P. Y. A two-stage ultrafiltration process for separating multiple components of Tetraselmis suecica after cell disruption. J. Appl. Phycol. 2014, 26, 2379. 10.1007/s10811-014-0271-0. [DOI] [Google Scholar]
- Ritchie R. Consistent Sets of Spectrophotometric Chlorophyll Equations for Acetone, Methanol and Ethanol Solvents. Photosynth. Res. 2006, 89, 27–41. 10.1007/s11120-006-9065-9. [DOI] [PubMed] [Google Scholar]
- ‘t Lam G. P.; Giraldo J. B.; Vermuë M. H.; Olivieri G.; Eppink M. H. M.; Wijffels R. H. Understanding the salinity effect on cationic polymers in inducing flocculation of the microalga Neochloris oleoabundans. J. Biotechnol. 2016, 225, 10–17. 10.1016/j.jbiotec.2016.03.009. [DOI] [PubMed] [Google Scholar]
- Coons J. E.; Kalb D. M.; Dale T.; Marrone B. L. Getting to low-cost algal biofuels: A monograph on conventional and cutting-edge harvesting and extraction technologies. Algal Res. 2014, 6 (Part B), 250–270. 10.1016/j.algal.2014.08.005. [DOI] [Google Scholar]
- Zbinden M. D. A.; Sturm B. S. M.; Nord R. D.; Carey W. J.; Moore D.; Shinogle H.; Stagg-Williams S. M. Pulsed electric field (PEF) as an intensification pretreatment for greener solvent lipid extraction from microalgae. Biotechnol. Bioeng. 2013, 110, 1605–1615. 10.1002/bit.24829. [DOI] [PubMed] [Google Scholar]
- Luengo E.; Martínez J. M.; Bordetas A.; Álvarez I.; Raso J. Influence of the treatment medium temperature on lutein extraction assisted by pulsed electric fields from Chlorella vulgaris. Innovative Food Sci. Emerging Technol. 2015, 29, 15–22. 10.1016/j.ifset.2015.02.012. [DOI] [Google Scholar]
- Wang D.; Li Y.; Hu X.; Su W.; Zhong M. Combined Enzymatic and Mechanical Cell Disruption and Lipid Extraction of Green Alga Neochloris oleoabundans. Int. J. Mol. Sci. 2015, 16, 7707–7722. 10.3390/ijms16047707. [DOI] [PMC free article] [PubMed] [Google Scholar]
Associated Data
This section collects any data citations, data availability statements, or supplementary materials included in this article.


