Abstract
Although the zebrafish is increasingly used as a model organism to study epilepsy, no standard electrophysiological technique for recording electrographic seizures in adult fish exists. The purpose of this paper is to introduce a readily implementable technique for recording pentylenetetrazole seizures in the adult zebrafish. We find that we can consistently record a high quality field potential over the zebrafish cerebrum using an amplification of 5000 V/V and bandpass filtering at corner frequencies of 1.6 and 16 Hz. The cerebral field potential recordings show consistent features in the baseline, pre-seizure, seizure and post-seizure time periods that can be easily recognized by visual inspection as is the case with human and rodent electroencephalogram. Furthermore, numerical analysis of the field potential at the time of seizure onset reveals an increase in the total power, bandwidth and peak frequency in the power spectrum, as is also the case with human and rodent electroencephalogram. The techniques presented herein stand to advance the utility of the adult zebrafish in the study of epilepsy by affording an equivalent to the electroencephalogram used in mammalian models and human patients.
Keywords: Epilepsy, Zebrafish, EEG, Pentylenetetrazole, Seizure, Amplifier
1. Introduction
A seizure is a sustained and synchronous elevation in brain electrical activity that can result in loss of consciousness and injury. Epilepsy is the condition of having recurrent and unprovoked seizures. Up to 0.5% of the general population has epilepsy, or an estimated 60 million people worldwide (Hauser et al., 1991). Recurrent seizures result in higher rates of mortality (Zielinski, 1974), cognitive impairment (Aldenkamp, 2006), and psychosocial dysfunction (Shorvon, 2007) and cost the US economy over $12 billion annually (Begley et al., 1994).
The zebrafish (Danio rerio) is a model vertebrate organism for many human diseases (Lieschke and Currie, 2007) including cardiovascular disease (Dahme et al., 2009), cancer (Amatruda and Patton, 2008; Payne and Look, 2009), motor neuron disease (Beattie et al., 2007) and epilepsy. The zebrafish epilepsy model is widely accepted as a screening tool for new antiepileptic drugs (Berghmans et al., 2007) and has also been used in mutagenesis studies to screen for genes that promote either susceptibility or resistance to seizures (Baraban et al., 2007; Hortopan et al., 2010). Genetic mutations associated with known human epilepsy syndromes have also been successfully implemented in transgenic zebrafish (Bassuk et al., 2008; DiBella et al., 2009). In fact, Teng et al. (2010) successfully implemented a morpholino knockdown of leucine-rich glioma inactivated 1 (LGI1) gene expression that shows a reduced threshold for seizures. Mutations in the LGI1 gene are associated with a form of human autosomal dominant epilepsy (Michelucci et al., 2003; Ottman et al., 2004). But thus far these transgenic animals have been used mainly to study the effects of the epileptogenic genes on development and not on brain electrical activity or seizure threshold. While techniques have been described for recording electrographic seizures in zebrafish larvae (Baraban et al., 2005), no techniques to our knowledge are available for use in adult fish. Epilepsy syndromes are often classified primarily on abnormalities of brain electrical activity as measured by the electroencephalogram (EEG). Thus, having an EEG equivalent for the adult zebrafish would advance the role of the zebrafish in the study of epilepsy considerably.
The purpose of this study is to describe a technique for recording the field potential over the zebrafish cerebrum and to determine if it can be used for the electrographic evaluation of seizures in the adult zebrafish. More specifically, we detail the construction of a readily implementable amplifier and filter bank and provide a characterization of its gain vs. frequency transfer characteristics. We also provide a detailed method for constructing and characterizing a suitable set of recording electrodes. We then use this apparatus to characterize pentylenetetrazole (PTZ) seizures in adult zebrafish in terms of both visual appearance and power spectral content. Taken as a whole, this study establishes a set of tools and baseline measurements for the electrographic study of seizures in the adult zebrafish.
2. Materials and methods
2.1. Zebrafish care and maintenance
Zebrafish were maintained in The Ohio State University’s zebrafish core facility. All studies used adult (9–14 month) laboratory strain WIK zebrafish. Fish were fed to satiety twice daily on weekdays, once daily on weekends. All experiments were conducted greater than 2 h after a weekday morning feeding. All studies in this paper were approved by The Ohio State University’s Institutional Animal Care and Use Committee (IACUC Protocol # 2010A0196).
2.2. Anesthesia and euthanasia
Prior to electrode insertion fish were anesthetized with eugenol (clove oil extract) obtained at a local pharmacy. Eugenol induces anesthesia and analgesia by blocking fast voltage gated sodium channels in the cortex and in the dorsal horn cells respectively (Cho et al., 2008). Eugenol also has an additional analgesic effect on both central and peripheral pain circuits by activation of the transient receptor potential vanilloid subtype 1 (TRPV1) (Vriens et al., 2009). Anesthesia was induced with 15 ppm eugenol and maintained with 7.5 ppm eugenol as described by Grush et al. (2004). Anesthesia induction was deemed adequate when the fish lost posture and rolled to the side. Swim attempts in the recording chamber were taken to be signs of distress and prompted increased eugenol delivery during experiments. At the end of each experiment individual fish were euthanized by emersion in tricaine (MS-222; Sigma, 160 μg/ml) until all respiratory movements had ceased for 3 min.
2.3. Electrode and recording chamber manufacture
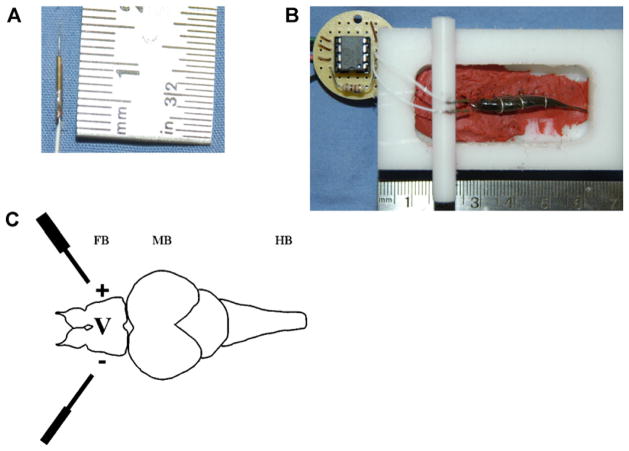
As shown in Fig. 1A two identical segments of 5 mil (0.005″) 316 alloy enamel coated stainless steel wire (California Fine Wire Company, Grover Beach, CA) stripped of insulation along 0.5 mm of the distal tip served as recording electrodes. The proximal ends of the recording electrodes were also stripped of insulation and fitted into small segments of 1/32″ inner diameter brass tubing (K&S Industries, Chicago, IL #05035). Segments of Kynar-insulated stainless steel wire (Radio Shack, Fort Worth, TX #278–502) were then used to connect the recording electrodes to the head-stage amplifier that is affixed to the recording chamber. This electrode configuration has been shown to average all potentials along the stripped section of wire and to result in reduced amounts of high frequency noise (Banks et al., 1995; Robinson, 1968; Cooley and Vanderwolf, 1978). The exposed metal was then coated with a brush on epoxy (Gardner Bender, Milwaukee, WI—#LTB-400) for additional electrical insulation.
Fig. 1.
(A) Photograph of a single uncoated recording electrode. (B) Photograph of fish mounted into recording chamber with uncoated electrodes affixed to either side of the forebrain. The INA129A head-stage amplifier is affixed to the recording chamber. Electrodes are affixed to a bridge which is affixed to the recording chamber by force of friction obtained with precision machining. The entire apparatus is grounded by a wire that comes up through the floor of the chamber contacting the chamber solution and fish on one end, and the Faraday cage on the other. The Faraday cage is connected to house ground which is also the ground for the amplifier. For the purpose of photographic clarity, the electrodes shown were not coated with epoxy insulator and tank water was not added to the recording chamber. (C) The configuration is such that the electrodes measure the potential difference across the forebrain (FB). MB—midbrain; HB—hindbrain.
As shown in Fig. 1B, following induction of anesthesia, fish were mounted into the recording chamber by pinning the lower lip and the body posterior to the gills to a bed of modeling clay using “horseshoe”-shaped segments of wire. The recording electrodes were then introduced over the cerebrum on either side of the fore-brain by direct skull puncture using established landmarks (Rupp et al., 1996) for anatomical reference. The electrodes were then affixed to a bridge to provide mechanical stabilization. The net effect was to record the potential difference across the forebrain as shown in Fig. 1C.
The recording chamber was machined out of a 1 in. section of Acetyl block (Small Parts Inc., Plainfield, IL). The bridge was machined from a section of 1/4″ Acetyl rod in such a fashion so as to lock in place and to hold the recording electrodes by force of friction. Machining was done using a Sherline (Vista, CA—#3580) vertical milling column affixed to a Sherline (#4400) lathe bed. The entire setup was inside a metal screen Faraday cage (not shown). Tank water with 7.5 ppm eugenol was then added so as to submerge the fish up to the level of the eye. The amplifier headstage was seated in a groove precisely machined into the side of the recording chamber. To be discussed below, we used a high-input impedance, high gain differential head-stage amplifier so strictly speaking it was not necessary for the fish and recording chamber to be grounded as each electrode would register approximately the same ambient noise. Nonetheless, we did ground the recording chamber by way of a wire that runs up through the bottom of the chamber to contact the fish and recording solution. So long as the bare tips of the recording wires did not contact the fish, skin or skull, we did not register a “flat-line” signal.
2.4. Amplifier and filter-bank manufacture
A prior characterization of goldfish EEG by Schade and Weiler (1959) indicates that the potential we are trying to measure is along the order of 100 μV and that the frequency range of interest is 3–14 Hz. Our target output voltage was ±0.5 V, which necessitated a gain of 5000 V/V. Using such a high gain imposes the risk of saturating the analog-to-digital converter (ADC) if the DC offset is too high with respect to the peak to peak signal amplitude. To reduce the risk of ADC saturation, we chose a high pass frequency of 1.6 Hz to provide rejection of any DC signal component without distorting the 3 Hz signal component. The high gain also increased the risk of 60-cycle and ambient high frequency noise contamination. We chose a low pass frequency of 16 Hz to reject this high frequency noise without distorting the 14 Hz band.
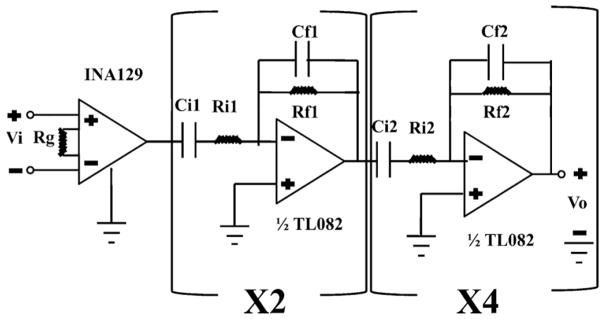
Fig. 2 shows a schematic representation of the amplifier and filtering circuit. The circuit was inspired by and manufactured according to methods presented by Land et al. (2001). As shown in the figure, an INA129 bioinstrumentation amplifier (Burr-Brown, Texas Instruments, Dallas, TX) served as the head-stage amplifier. Low noise BiFET operational amplifiers (TL082, Radio Shack, Fort Worth, TX) were configured to provide further amplification and filtering. A Burr-Brown Model 503A DC power source was used to power the circuit using rail voltages of ±15 V. All other electrical components were obtained from a local electronics supplier.
Fig. 2.
Schematic representation of the amplifier and filter bank used to record the zebrafish cerebral field potential. An INA129 bioinstrumentation amplifier comprises the head stage of the circuit. By setting Rg = 1 kΩ the gain of the INA129 is then 50, 000/1000 = 50 V/V. The second stage of the circuit produces a gain of Rf1/Ri1 = 1 MΩ/100 kΩ= 10 V/V per stage, times two sub-stages for a total gain of 100 V/V. The overall gain of the entire circuit is then 50 × 100 = 5000 V/V. The low pass corner frequency of the second stage is 1/2πRf1Cf1 = 1/2π (1 MΩ)(0.01 μF) ≅ 16 Hz. Similarly, the high pass corner frequency of the second stage is 1/2πRi1Ci1 = 1/2π(100 kΩ)(1 μF) ≅1.6 Hz. The third stage of the circuit produces uniform gain of Rf2/Ri2 = 1 MΩ/1 MΩ = 1 V/V. The low pass corner frequency is 1/2πRf2Cf2 = 1/2π (1 MΩ)(0.01 μF) ≅ 16 Hz and the high pass corner frequency is 1/2πRi2Ci2 = 1/2π(1 MΩ)(0.1 μF)≅ 1.6 Hz. With 4 sub-stages, the net result is an additional 4 poles of uniform gain bandpass filtering. The net result of the circuit is then a gain of 5000 V/V with 6 poles of band-pass filtering between 1.6 and 16 Hz. The active and reference recording electrodes are connected to terminals and respectively.
As shown in Fig. 2, the INA129 was configured to produce a head stage gain of 50 V/V. A second stage with two identical sub-stages produced an additional gain of 100 V/V and two poles of band-pass filtering between 1.6 and 16 Hz. A third stage consisting of 4 identical sub-stages provided 4 additional poles of band-pass filtering (1.6–16 Hz) with a uniform gain of 1 V/V. The circuit as a whole produced a net gain of 5000 V/V with 6 poles of band-pass filtering at corner frequencies of 1.6 and 16 Hz.
2.5. Recording of cerebral field potential during PTZ seizures
The output of the recording apparatus was input to a Measurement Computing Corporation (MCC—Norton, MA) USB-1208HS-4AO data acquisition device linked to a laptop computer by a USB cable. MCC’s Tracer DAQ® program was then run in “strip-chart” recording mode sampling at 50 Hz, well in excess of the 32 Hz that would be required to eliminate aliasing in accordance with the Shannon–Nyquist sampling theorem (Nyquist, 1928; Shannon, 1949). Individual data files were stored electronically on the laptop for future analysis.
PTZ was introduced into the recording chamber via drop application of concentrated stock solution. Where applicable, following PTZ exposure, the recording was paused and the recording chamber perfusate was then rapidly evacuated and replaced with fresh tank water containing 7.5 ppm eugenol, at which time the recording was restarted. The time to change the perfusate was consistently less than 3 s.
2.6. Data analysis
Recorded data was reviewed using MCC’s Tracer Daq® and screened for artifacts. Long continuous artifact-free data segments were exported to Matlab® (MathWorks, Natick, MA) for rigorous statistical analysis.
3. Results
3.1. Electrode transfer characteristics
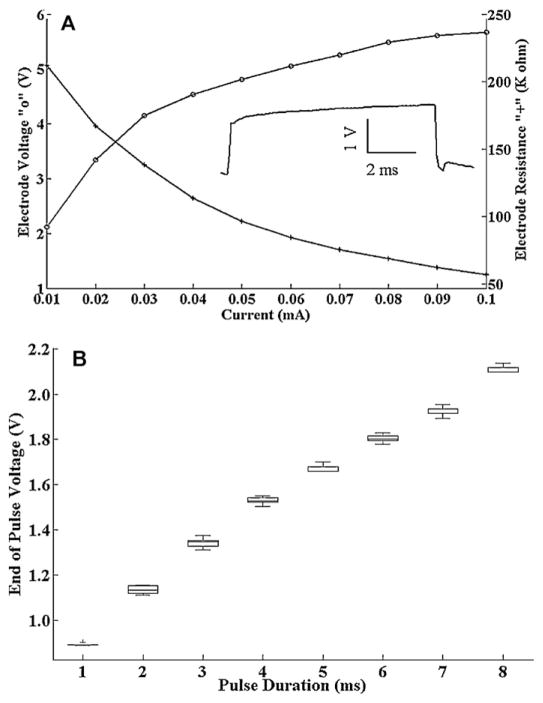
The electrical impedance of the recording electrodes must be substantially lower than the input impedance of the amplifier in order to reduce signal loss and minimize ambient noise registration, yet large enough to register the signal voltage (see Ferree et al., 2001 for a review). To assure that we have compatible electrode impedances over a wide range of current densities, we affixed the recording electrodes to the fish as described above and then measured the steady state voltage response to a constant duration current pulse of varying amplitude. We used a Grass Instruments (Quincy, MA) S88 stimulator in series with a Grass Instruments CCU1A constant current stimulus isolation unit to deliver stimulations. We recorded the voltage response vs. input current with a Propscope (Parallax, Rocklin, CA) USB oscilloscope. We used a pulse duration of 8 ms because as shown in the inset of Fig. 3A, the voltage reaches a steady plateau beyond this pulse duration limit. As shown in Fig. 3A, we see what could be approximated as single-time-constant resistance and voltage transfer functions with single digit voltage readings at ~100 kΩ resistance and ~10 μA current pulses. These results are similar to what was described by Kaczmarek and Webster (1989) in their characterization of the EEG electrode resistance in human. The INA129 has an input impedence of 10 GΩ. With this electrode configuration then we expect to see a signal loss of about 1 part in 100,000 (105/1010) which should be tolerable. Thus we expect that our electrode impedance is large enough to register the signal of interest without substantial signal loss. Below we will also address whether the electrode impedance is small enough so as not to lead to the introduction of ambient noise into our recordings.
Fig. 3.
(A) Voltage (“o”) and resistance (“+”) vs. current magnitude for a pair of recording electrodes affixed to a fish in the recording chamber. The current pulse duration used was 8 ms as shown in the inset. The current pulse magnitude used to generate the inset trace was 0.01 mA. These results show that the recording electrode impedance is low in comparison to the input impedance of the INA129. (B) Histograms of peak voltage recorded at the end of an “x” ms current pulse. Each column represents 40 consecutive measurements. Horizontal lines represent the median. Boxes encompass 25–75th percentiles. Whiskers encompass 5–95th percentiles. Outliers are marked with “+”. These results show relatively constant current density down to a pulse duration of about 1 ms (where the first outlier occurs).
The electrical impedance of bio-tissue is current dependent (Grimnes, 1983), so it is also necessary to validate that we can achieve steady state current flux in the electrodes themselves over a physiologically relevant frequency range. To determine the maximum frequency resolvable with these electrodes, we subjected the fish to constant current pulses of varying duration and recorded the peak voltage at the end of consecutive current pulses. As shown in Fig. 3B we found that the peak voltage at the end of consecutive identical current pulses was highly reproducible down to 1 ms pulse duration. This means that theoretically we could resolve frequencies upwards of 1 kHz with these electrodes which is well beyond our range of interest.
3.2. Amplifier and filter bank transfer characteristics
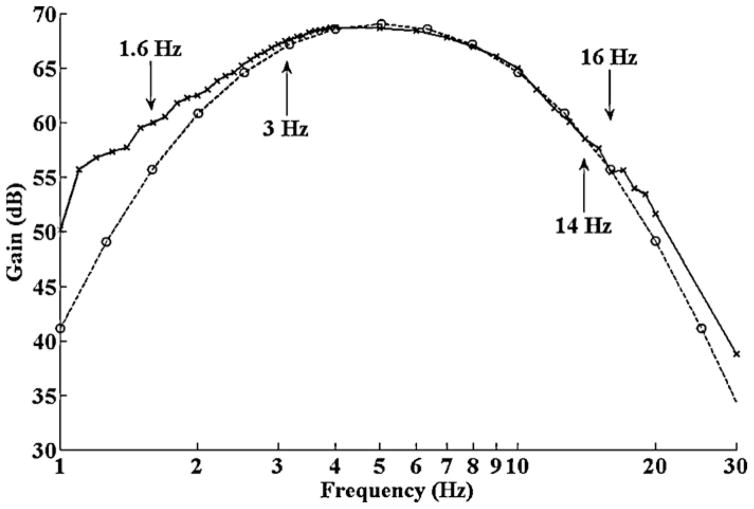
We next set out to establish the transfer characteristics of the amplifier and filter bank described in Fig. 2. Fig. 4 shows both the theoretical and measured transfer characteristics for the circuit of Fig. 2. Using the Propscope USB oscilloscope, function generator and a voltage dividing circuit, a 150 μV peak–peak sinusoidal test voltage was applied to the input terminals of the circuit. The amplitude response at each frequency was ascertained by direct visual observation of the corresponding peak on the oscilloscope spectrum analyzer. Matlab’s bode function was used to derive the theoretical gain vs. frequency response. Fig. 4 shows near uniform amplification in the frequency range of interest (3–14 Hz) with rejection of DC offset and higher frequency signal components. While we realize that more elaborate filter configurations could provide steeper rejection at the corner frequencies (see Carter and Brown, 2001 for a review), the relatively narrow bandwidth of interest makes distortion of the signal at the corner frequencies undesirable. Hence the apparatus of Fig. 2 should suffice for recording the zebrafish cerebral field potential.
Fig. 4.
Gain vs. frequency plot for the amplifier and filter bank of Fig. 2. The solid line with “x” markers signifies actual measurements taken directly from the apparatus using a 150 μV test source. The dashed line with “o” markers is obtained from a computer simulation of the circuit. There is good agreement in the theoretical and experimental values in the frequency range of interest (3–14 Hz).
3.3. PTZ and eugenol exposure levels
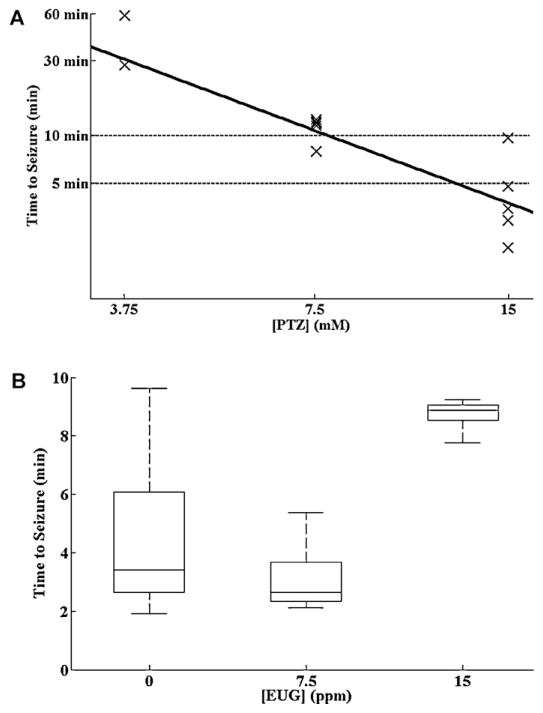
When exposed to increasing concentrations of PTZ, zebrafish larvae exhibit predictable stages of behavioral seizure activity (Baraban et al., 2005). Stage I seizure activity consists of increased swim activity. Stage II seizure activity is characterized by the emergence of aversive or so-called “whirlpool” maneuvers. Stage III seizure activity is characterized by course clonic convulsion with loss of posture i.e. rolling to the side. To determine the proper PTZ exposure time and concentration in adult fish, we exposed individual fish to varying concentrations of PTZ and recorded the time of onset to visual observance of Stage III seizure activity.
Fig. 5A shows a log-log regression plot of the time to onset of Stage III seizure activity vs. PTZ concentration. Two of 5 fish seized within 1 h of exposure to 3.75 mM PTZ, one of 5 fish seized within 10 min of exposure to 7.5 mM PTZ, and four of 5 fish seized within 5 min of exposure to 15 mM PTZ. We therefore chose a PTZ exposure concentration of 15 mM, reasoning that we should see electrographic seizure activity within 5 min of exposure in most fish.
Fig. 5.
(A) log:log regression of time to seizure vs. PTZ concentration. At 15 mM PTZ, 4/5 fish seized within 5 min of exposure (lower dotted line). At 7.5 mM, 1/5 fish seized within 10 min of exposure (upper dotted line). The other fish seized shortly thereafter. At 3.75 mM, 2/5 fish seize within 60 min of exposure. (B) Eugenol at a concentration of 7.5 ppm had no effect on the latency to onset of behavioral seizure activity. Concentrations of 15 ppm did significantly prolong the latency to onset of PTZ seizures. Horizontal lines represent the median. Boxes encompass 25–75th percentiles. Whiskers encompass 5–95th percentiles.
Baraban et al. (2005) reported longer latencies to seizure onset in agar embedded larvae. This discrepancy likely results from three factors, the first and most obvious of which would be increased diffusion time of PTZ through the agar to the larvae. Second, larval respiration is chiefly through the skin where PTZ uptake is likely to be slow, where as in the adult fish respiration is through the gills where the uptake should be considerably faster. Finally, as is the case with rodent and human, the immature nervous system of the larvae is not likely as capable of generating well developed seizure activity as rapidly as the mature adult.
Anesthetic agents invariably suppress seizure activity. In fact, general anesthesia is the definitive treatment for status epilepticus, defined as continuous life threatening seizure activity in humans. Many anesthetic agents act by directly activating the GABA receptor, which would directly counter the proconvulsant mechanism of action of PTZ (Huang et al., 2001; Jim et al., 1989). As mentioned, eugenol exerts an anesthetic effect by blocking the fast sodium channel. Therefore PTZ antagonism should be less of a factor. But given that PTZ induced seizures have been shown to be blocked by tetrodotoxin (Baraban et al., 2005) we would expect eugenol to also attenuate PTZ seizures.
To investigate the effects of eugenol on PTZ-induced seizure threshold we exposed fish to 15 mM PTZ in the presence of varying maintenance concentrations of eugenol. As shown in Fig. 5B, a eugenol concentration of 7.5 ppm produced no significant elevation in seizure onset latency. But a eugenol concentration of 15 ppm did significantly prolong the latency to onset of behavioral seizure activity. Therefore we decided to use a eugenol concentration of 7.5 ppm and a PTZ concentration of 15 mM as our experimental paradigm.
To be certain that the effects we measured were from seizure activity and not from the effects of osmolarity changes or the known anxiogenic and sympathomimetic effects of PTZ, we pre-treated a group of fish with a 15 min soak in 10 mM valproic acid prior to PTZ exposure. We chose valproic acid because of reports that it can attenuate PTZ-induced learning deficits in zebrafish (Lee et al., 2010). We chose a 10 mM concentration empirically based on commonly used valproate concentrations in toxicology studies (Benavides et al., 1982). No fish that was pretreated with valproic acid seized despite 60 min of PTZ exposure (not shown) suggesting that the effects we were observing were indeed due to seizure activity and not due to anxiogenesis, sympathomimesis or osmolarity changes.
3.4. Visual attributes of the cerebral field potential
A key to the usefulness of the EEG as a clinical tool is that experienced electroencephalographers can ascertain the state of vigilance, the presence of gross cerebral pathology, metabolic derangement, seizures or the predisposition to have seizures, all by visual inspection of the EEG tracings. If the cerebral field potential is to have utility in studying seizures in adult zebrafish, obvious changes in the visual appearance of the tracings should occur upon exposure to proconvulsants. To investigate this, we made long (upwards of 60 min) recordings in the presence of continuous exposure to 15 mM PTZ and reviewed the traces by examining contiguous 10-s epochs of data.
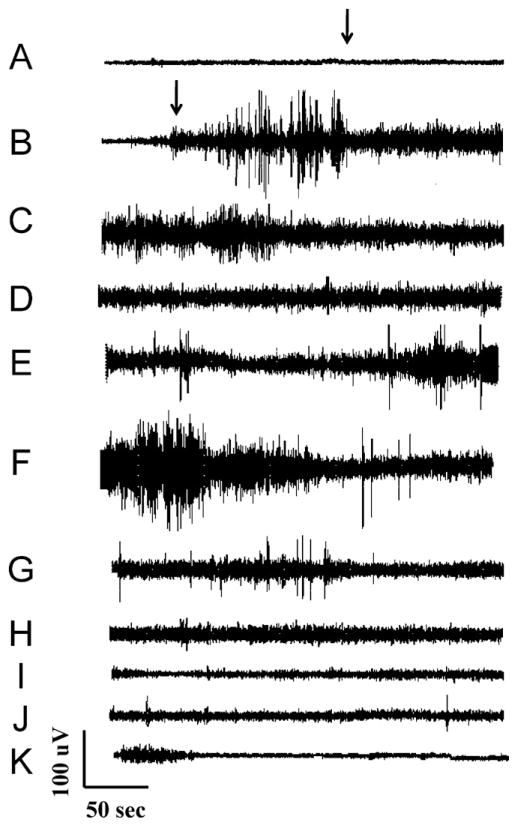
Fig. 6 shows the results of one such experiment. As shown in the figure, the baseline electrical activity was along the order of 25 μV (A). PTZ was added at 3 min (arrow—Fig. 6A). After a latency of 2:47, the background amplitude increased corresponding to the beginning of electrographic seizure activity (arrow—Fig. 6B). This activity persisted for nearly 35 min (Fig. 6C–H) at which time the recording amplitude reverted to approximately baseline levels (I–K). The fish stopped breathing at this point as would be expected after having endured such a long duration of sustained generalized seizure activity. The electrical activity observed here was consistent with what would be expected in the course of brain death. The recording did not become “flat” indicative of electrocerebral silence or brain death, for an additional 30 min however (to be shown in detail in Fig. 7).
Fig. 6.
Cerebral field potential in response to continuous PTZ exposure. PTZ was applied to the recording chamber at 3 min (arrow trace A) and electrographic seizure activity ensued following 2:47 exposure to PTZ (arrow trace B). The electrographic seizure activity persisted for approximately 35 min (traces C–H) at which time the field potential amplitude reverted to baseline (traces I–K).
Fig. 7.
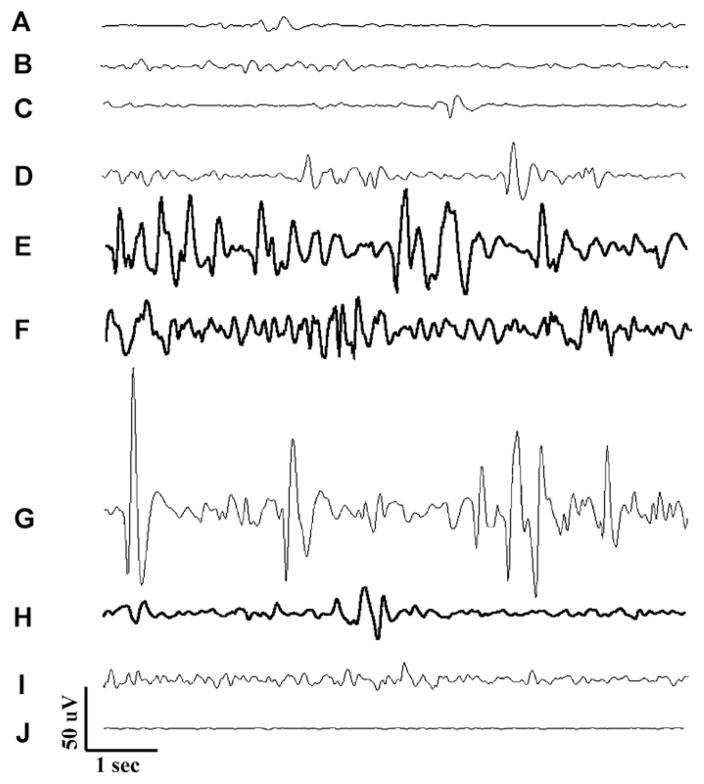
Short scale snapshots of cerebral field potential during PTZ seizures showing: (1) baseline activity (traces A and B), (2) pre-seizure activity (traces C and D), (3) seizure activity (traces E–G), (3) post-seizure activity (traces H and I), (4) electrocerebral silence (trace J).
As shown in Fig. 7, several consistent features emerged as a result of reviewing this data in detail. First of all, the activity observed at baseline in the anesthetized fish can best be described as low amplitude (~25–50 μV) sinusoidal activity in the delta (3–4 Hz) frequency range (A and B). Next, following the addition of PTZ, one begins to see high amplitude sharp transients that are similar in appearance to the interictal epileptiform discharges characteristic of human epileptic EEG and similar to what was previously described in zebrafish larvae (Baraban et al., 2005) (Fig. 7C and D).
Then, seizure activity ensued (Fig. 7E–G). Electrographically seizure activity consisted of higher than baseline amplitude (100–200 μV) sinusoidal activity in the theta frequency range (4–7 Hz) with occasional high amplitude spikes. Again this is similar in appearance to ictal EEG of human and rodent. Next, following cessation of seizure activity we saw a reduction in background amplitude with spurious epileptiform transients (Fig. 7H and I). Finally after nearly 90 min exposure we saw a pattern of electro-cerebral silence or a “flat-line EEG” (Fig. 7J) indicative of brain death.
These results suggest qualitatively that the baseline, pre-seizure, seizure and post-seizure states can be recognized in terms of the visual appearance of the traces alone. The ease with which these visual determinations can be made speaks to the utility these techniques could have in studying seizures in the adult zebrafish.
3.5. Common artifacts
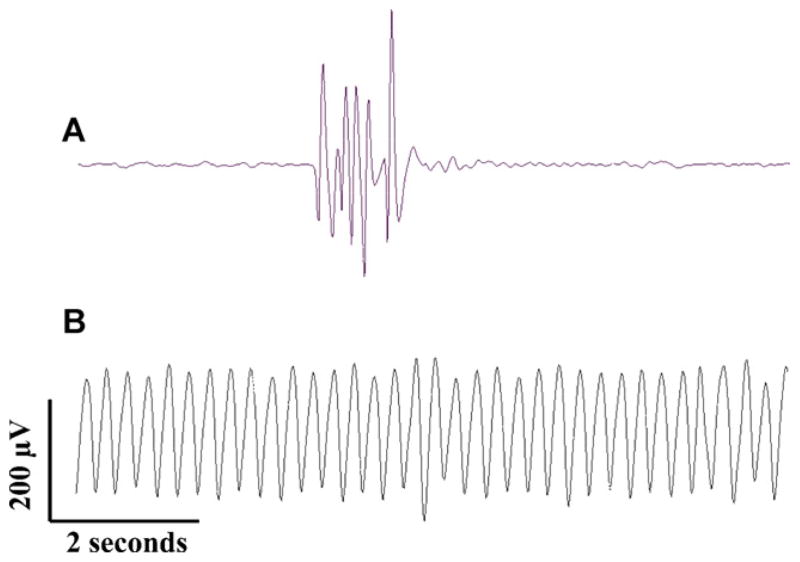
Just as the human EEG is known to contain certain stereotypical artifacts such as eye blink, glossokinetic, electrocardiographic, myogenic, movement and sweat artifacts, we were able to identify artifacts in the zebrafish cerebral field potential as well. As shown in Fig. 8A, the most common artifact we saw was from swim attempts in the recording chamber. This movement artifact could be characterized as high amplitude polyphasic sharp activity that was disproportionately large in amplitude with respect to the baseline. Swim attempts are aversive maneuvers and a sign of inadequate anesthesia. Swim attempts abated when additional eugenol was added to the recording chamber. Surprisingly when the animal was appropriately anesthetized, swim artifacts were otherwise rare, even with seizure activity.
Fig. 8.
Artifacts of swim attempt and gill movement. Swim attempts (A) are easily visualized during an experiment and indicate the need for higher levels of anesthesia. Electrographically a swim attempts generates a very high amplitude sharply contoured polyphasic artifact that is easily discernable from physiologic electrographic activity. These movement artifacts are virtually eliminated by maintaining appropriate levels of anesthesia. Gill movement artifact (B) consists of high amplitude rhythmic sinusoidal activity. Gill movement artifact is reduced to non-detectable levels by eliminating contact between the electrodes and mounting pins.
Not having the head fully immobilized or having the insulated portion of the electrode in contact with one of the immobilizing wires resulted in gill movement artifact, as shown in Fig. 8B. This artifact was easily recognized as high amplitude monomorphic sinusoidal activity. Gill movement artifact was easily eliminated by minimizing body contact with the recording wires and by securing the head properly to the modeling clay. We found that gluing or cementing the recording electrodes to the fish head was not necessary to eliminate movement artifact and that in general artifact of movement can be easily identified and controlled. We preferred to not affix the electrodes to the skull permanently because the electrodes cannot be reused after cement application, nor can fish subjected to cemented electrodes be recovered for future study.
3.6. The effect of sampling rate and bandwidth on ambient noise
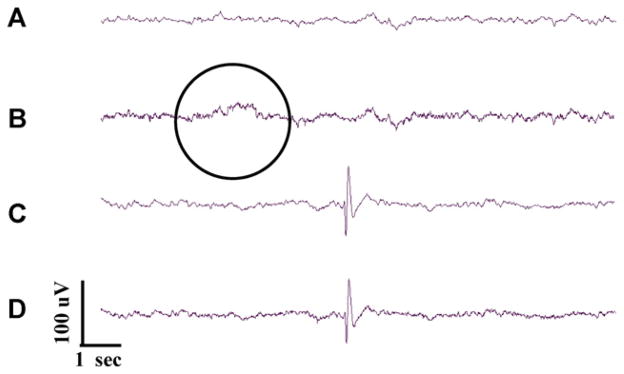
In using such a narrow bandwidth and low sampling frequency, we run the risk of aliasing high frequency ambient noise into our tracings. Conventional EEG in human is bandpass filtered between 0.1 and 100 Hz and sampled at a rate of 250–500 Hz. To examine the effects of a broader bandwidth we output the INA129 simultaneously to the filter bank described above and a separate filter bank configured to filter at 6 poles between 0.1 and 100 Hz, again with a gain of 100. We then sampled both channels simultaneously at 250 Hz. Fig. 9 shows representative tracings of interest. Fig. 9A shows baseline tracing filtered at 1.6 and 16 Hz while Fig. 9B shows a simultaneous tracing filtered at 0.1 and 100 Hz. As expected, we saw more prominent slow transients associated with the lower corner frequency (circled). We also saw an increase in the low amplitude high frequency noise associated with the higher corner frequency which contributes to the “fuzziness” of the second trace. Fig. 9C and D shows a single epileptiform transient following PTZ exposure recorded simultaneously with the low and high bandwidth filter banks respectively. Both configurations resolved this sharp transient completely. Based on the flat appearance of the tracing in the dead fish (Fig. 7J) and these results, we do not feel that we introduced artifact into our records by using the lower bandwidth and slower sampling rate.
Fig. 9.
Simultaneous recording of the cerebral field potential using low bandwidth (1.6–16 Hz) and high bandwidth (0.1–100 Hz) filtering banks (sample rate 250 Hz). A) Baseline cerebral field potential filtered at 1.6–16 Hz. (B) Same signal filtered at 0.1–100 Hz. Note more prominent slow transients (circle) and low amplitude high frequency noise in the high bandwidth signal. (C) Despite the lower bandwidth, sharp epileptiform transients are still able to be resolved at low bandwidth (trace C) with little or no loss in resolution when compared to the high frequency tracing (D).
3.7. The effect of transient PTZ exposure on the cerebral field potential
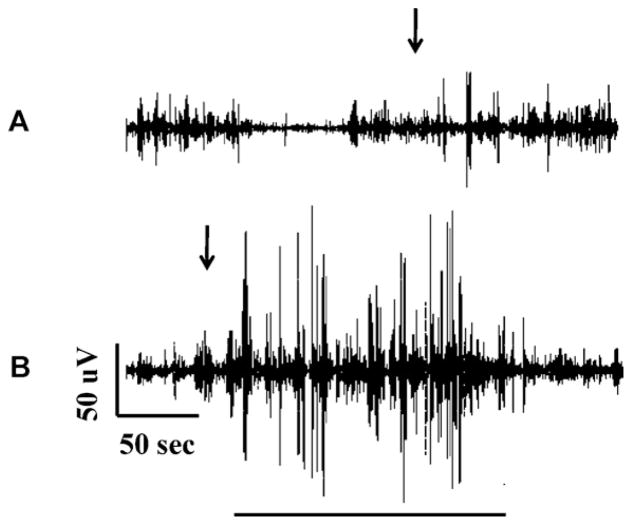
To be useful in scientific experimentation the animal must be able to survive the experiment so that baseline recording conditions can be recovered. The ability to recover the baseline allows for differentiation between physiologic effects of experimentation and terminal events. Rather than expose animals continuously to PTZ, we performed a set of experiments where animals were exposed to 15 mM PTZ for 3 min only. In addition to promoting survival, the transient exposure time also more closely mimics epileptic seizures in rodent models and humans with epilepsy. Following 3 min of PTZ exposure the recording chamber was evacuated by syringe and replaced with tank water containing 7.5 ppm eugenol. A representative tracing is shown in Fig. 10. PTZ was applied at 3 min (arrow Fig. 10A) and withdrawn at 6 min (arrow Fig. 10B). As shown in the figure we actually did see an electrographic seizure a short time after the withdrawal of PTZ (underscored Fig. 10B). As expected the animal survived this experiment. Hence these experimental parameters should suffice for providing a recoverable baseline and are more congruent with seizure induction methods in rodent models and in simulating epileptic seizures in humans.
Fig. 10.
Seizure induction with transient PTZ exposure. Shown is a long time scale tracing of cerebral field potential in response to 3 min PTZ exposure. PTZ was applied at 3 min (arrow trace A) and removed at 6 min (arrow trace B). A seizure occurred shortly after PTZ withdrawal (underscore trace B) and abated with recovery of baseline. The animal survived this experiment.
3.8. Power spectrum of the cerebral field potential during PTZ seizures in the adult zebrafish
Human EEG has been subjected to numerical analysis on many fronts over the years with hopes of determining state of vigilance, establishing level of anesthesia, detecting epileptiform discharges, and predicting seizure activity (Lehnertz et al., 2001; Litt and Echauz, 2002). Although the efficacy of numerical EEG analysis in accomplishing these goals remains largely controversial, few would object to the notion that the power content of the EEG generally increases with the onset of seizure activity. To provide a more quantitative description of PTZ seizures in the adult zebrafish, we computed the power spectrum of the zeromean (adjusted) cerebral field potential with PTZ exposure using Matlab’s periodogram function. Power spectrum calculations were made on 1 s segments sampled at 50 Hz using 64 point fast Fourier transforms (FFT) and the Hamming windowing function. The use of other windowing functions including the Hann window and Matlab’s default “rectangular” window did not produce significantly different results. The use of longer FFT segments, higher sampling frequencies including frequencies that were an integer power of two, and smaller frequency graduations also did not produce statistically different results.
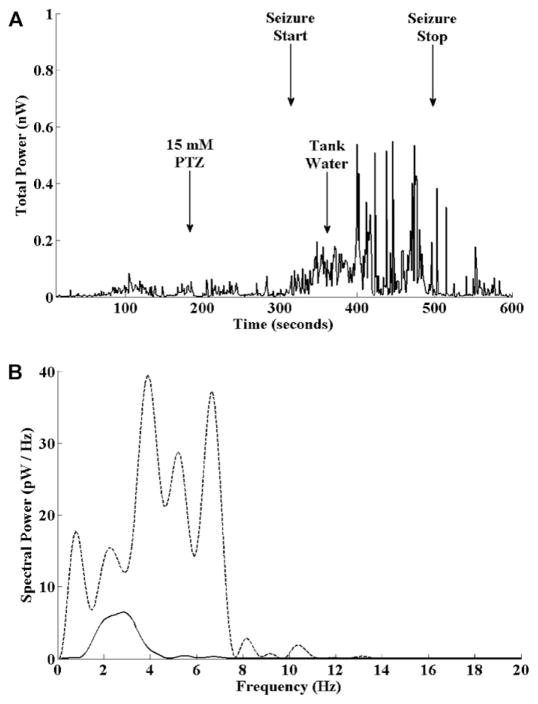
Performing this analysis, we observed that the total signal power at baseline was fluctuant with relatively quiescent periods alternating with more active periods as has been previously described in larvae (Fig. 11A). For statistical purposes, seizure onset was defined as the point at which the total signal power was significantly (p < 0.05) increased for 30 one-second bins by at least 100% over a 180 s baseline mean according to the Student’s T-test. Fig. 11A shows the power content of the field potential signal vs. time for the seizure of Fig. 10. As shown in the figure, PTZ was added to the recording chamber at 180 s (3 min). After a latency of approximately 140 s, seizure activity began as evidenced by an increase in the total signal power. PTZ was removed from the recording chamber at time t = 360 s (6 min after the start of the recording) for a total PTZ exposure time of 3 min. The seizure was deemed terminated at 490 s as evidenced by normalization of the signal power content.
Fig. 11.
Power content of the cerebral field potential with PTZ seizures. (A) Total power content of the cerebral field potential measured in nano-watts (nW) vs. time for a typical PTZ seizure. PTZ was added to the recording chamber at 3 min following recording onset. Seizure activity began approximately 2 min and 20 s later as evidenced by a sustained increase in the signal power content by 100% over baseline. The statistical onset of seizure activity is detected using statistical criteria before visual inspection of Fig. 10 would suggest seizure onset. The recording chamber perfusate was changed to fresh tank water with 7.5 ppm eugenol at 6 min. Seizure activity abated at 490 s as evidenced by the reduced power content of the signal. (B) Typical “snapshots” of the power spectrum at baseline (solid line) and during seizure activity (dashed line) measured in pico-watts per Hz (pW/Hz). At seizure onset there was an increase in the overall power, mean frequency and bandwidth of the field potential signal.
Of 12 fish exposed to 15 mM PTZ for 3 min, 9 were deemed to have had a seizure by this criterion and all fish survived this experiment. The mean time to seizure onset was 200 ± 19 s (mean ± SEM). The seizure was terminated at the point when the total signal power fell to within 10% of baseline. The mean seizure duration was 237 ± 63 s. The mean power at baseline was 0.019 ± 0.006 nW and the mean power at seizure onset was 0.054 ± 0.017 nW.
The mean frequency of power spectrum was determined by using a weighted average over a frequency range of 30 Hz. The bandwidth of the spectrum was defined as the distance (in Hz) from the mean frequency where 70% of the total signal power as measured by the area under the curve was contained. The peak frequency of the spectrum was taken to be the frequency at which the maximal power occurred. There were non-sustained epochs of increased mean frequency, bandwidth and peak frequency during seizure activity as shown in Fig. 11B. The variance in these parameters also increased during seizure activity however. As such, sustained and statistically significant increases in these parameters over contiguous bins were absent.
4. Discussion and conclusions
The recording electrode, amplifier and filter bank presented herein provides a readily implementable method for recording the field potential over the zebrafish cerebrum. The cerebral field potential exhibits predictable changes that allow visual discrimination between the baseline, pre-seizure, seizure and post-seizure states as is the case with human and rodent EEG. As is also the case with rodent and human EEG, there is a significant and sustained increase in the total power content of the field potential signal during seizure activity as well as paroxysmal increases in the mean frequency, peak frequency and bandwidth of the signal. Thus the techniques presented herein recapitulate the salient features of the human and rodent EEG and provide a methodology for studying electrographic properties of seizures in the adult zebrafish. Implementation of these techniques stands to advance the utility of the zebrafish in the study of epilepsy by bringing the high throughput capacity, experimental manipulability and cost effectiveness of the zebrafish model to the epilepsy research arena. Furthermore these techniques allow for the non-lethal and quantitative study of seizures in adult fish with mature nervous systems and completely preserved anatomical connectivity—attributes that are not attainable with larvae or in brain slice preparations.
References
- Aldenkamp A. Cognitive impairment in epilepsy: state of affairs and clinical relevance. Seizure. 2006;15:219–20. [Google Scholar]
- Amatruda J, Patton E. Genetic models of cancer in zebrafish. Int Rev Cell Mol Biol. 2008;271:1–34. doi: 10.1016/S1937-6448(08)01201-X. [DOI] [PubMed] [Google Scholar]
- Banks D, Ewins D, Balachandran W, Richards P. A modelling study on the effects of the geometry of recording sites on neural signal transduction. Engineering in medicine and biology society—IEEE 17th annual conference. 1995;2:1671–2. [Google Scholar]
- Baraban S, Dinday M, Castro P, Chege S, Guyenet S, Taylor M. A large-scale mutage-nesis screen to identify seizure-resistant zebrafish. Epilepsia. 2007;48:1151–7. doi: 10.1111/j.1528-1167.2007.01075.x. [DOI] [PMC free article] [PubMed] [Google Scholar]
- Baraban S, Taylor M, Castro P, Baier H. Pentylenetetrazole induced changes in zebrafish behavior, neural activity and c-fos expression. Neuroscience. 2005;131:759–68. doi: 10.1016/j.neuroscience.2004.11.031. [DOI] [PubMed] [Google Scholar]
- Bassuk A, Wallace R, Buhr A, Buller A, Afawi Z, Shimojo M, et al. A homozygous mutation in human PRICKLE1 causes an autosomal-recessive progressive myoclonus epilepsy-ataxia syndrome. Am J Hum Genet. 2008;83:572–81. doi: 10.1016/j.ajhg.2008.10.003. [DOI] [PMC free article] [PubMed] [Google Scholar]
- Beattie C, Carrel T, McWhorter L. Fishing for a mechanism: using zebrafish to understand spinal muscular atrophy. J Child Neurol. 2007;22:995–1003. doi: 10.1177/0883073807305671. [DOI] [PubMed] [Google Scholar]
- Begley C, Famulari M, Annegers J, Lairson D, Reynolds T, Coan S, et al. The cost of epilepsy in the United States: an estimate from population-based clinical and survey data. Epilepsia. 1994;41:342–51. doi: 10.1111/j.1528-1157.2000.tb00166.x. [DOI] [PubMed] [Google Scholar]
- Benavides J, Martin A, Ugarte M, Valdivieso F. Inhibition by valproic acid of pyruvate uptake by brain mitochondria. Biochem Pharmacol. 1982;31:1633–6. doi: 10.1016/0006-2952(82)90392-6. [DOI] [PubMed] [Google Scholar]
- Berghmans S, Hunt J, Roach A, Goldsmith P. Zebrafish offer the potential for a primary screen to identify a wide variety of potential anticonvulsants. Epilepsy Res. 2007;75:18–28. doi: 10.1016/j.eplepsyres.2007.03.015. [DOI] [PubMed] [Google Scholar]
- Carter B, Brown T. Handbook of operational amplifier applications. Texas Instruments Application Report. 2001 [Google Scholar]
- Cho J, Kim T, Lim J, Song J. Effects of eugenol on Na+ currents in rat dorsal root ganglion neurons. Brain Res. 2008;1243:53–62. doi: 10.1016/j.brainres.2008.09.030. [DOI] [PubMed] [Google Scholar]
- Cooley R, Vanderwolf C. Construction of wire leads and electrodes for use in slow wave recording in small animals. Brain Res Bull. 1978;3:175–9. doi: 10.1016/0361-9230(78)90044-8. [DOI] [PubMed] [Google Scholar]
- Dahme T, Katus H, Rottbauer W. Fishing for the genetic basis of cardiovascular disease. Dis Model Mech. 2009;2:18–22. doi: 10.1242/dmm.000687. [DOI] [PMC free article] [PubMed] [Google Scholar]
- DiBella L, Park A, Sun Z. Zebrafish Tsc1 reveals functional interactions between the cilium and the TOR pathway. Hum Mol Genet. 2009;18:595–606. doi: 10.1093/hmg/ddn384. [DOI] [PMC free article] [PubMed] [Google Scholar]
- Ferree T, Luu P, Russell J, Tucker D. Scalp electrode impedance, infection risk, and EEG data quality. Clin Neurophysiol. 2001;112:536–44. doi: 10.1016/s1388-2457(00)00533-2. [DOI] [PubMed] [Google Scholar]
- Grimnes S. Skin impedance and electro-osmosis in the human epidermis. Med Biol Eng Comput. 1983;21:739–49. doi: 10.1007/BF02464037. [DOI] [PubMed] [Google Scholar]
- Grush J, Noakes D, Moccia R. The efficacy of clove oil as an anesthetic for the zebrafish, Danio rerio (Hamilton) Zebrafish. 2004;1:46–53. doi: 10.1089/154585404774101671. [DOI] [PubMed] [Google Scholar]
- Hauser W, Annegers J, Kerland L. Prevalence of epilepsy in Rochester, Minnesota. Epilepsia. 1991;32:429–45. doi: 10.1111/j.1528-1157.1991.tb04675.x. [DOI] [PubMed] [Google Scholar]
- Hortopan G, Dinday M, Baraban S. Zebrafish as a model for studying genetic aspects of epilepsy. Dis Model Mech. 2010;3:144–8. doi: 10.1242/dmm.002139. [DOI] [PubMed] [Google Scholar]
- Huang R, Bell-Horner C, Dibas M, Covey D, Drewe J, Dillon G. Pentylenetetrazole-induced inhibition of recombinant gamma-aminobutyric acid type A (GABA(A)) receptors: mechanism and site of action. J Pharmacol Exp Ther. 2001;298:986–95. [PubMed] [Google Scholar]
- Jim K, Lathers C, Farris V, Pratt L, Spivey W. Suppression of pentylenetetrazol-elicited seizure activity by intraosseous lorazepam in pigs. Epilepsia. 1989;30:480–6. doi: 10.1111/j.1528-1157.1989.tb05329.x. [DOI] [PubMed] [Google Scholar]
- Kaczmarek K, Webster J. Voltage–current characteristics of the electrotactile skin–electrode interface. Proc Annu Int Conf IEEE Eng Med Bio Soc. 1989;11:1526–7. [Google Scholar]
- Land B, Wyttenbach R, Johnson B. Tools for physiology labs: an inexpensive high-performance amplifier and electrode for extracellular recording. J Neurosci Methods. 2001;106:47–55. doi: 10.1016/s0165-0270(01)00328-4. [DOI] [PubMed] [Google Scholar]
- Lee Y, Kim D, Kim Y, Lee H, Lee C. Improvement of pentylenetetrazol-induced learning deficits by valproic acid in the adult zebrafish. Eur J Pharmacol. 2010;643:225–31. doi: 10.1016/j.ejphar.2010.06.041. [DOI] [PubMed] [Google Scholar]
- Lehnertz K, Andrzejak RG, Arnhold J, Kreuz T, Mormann F, Rieke C, et al. Nonlinear EEG analysis in epilepsy: its possible use for interictal focus localization, seizure anticipation, and prevention. J Clin Neurophysiol. 2001;18:209–22. doi: 10.1097/00004691-200105000-00002. [DOI] [PubMed] [Google Scholar]
- Lieschke G, Currie P. Animal models of human disease: zebrafish swim into view. Nat Rev Genet. 2007;8:353–67. doi: 10.1038/nrg2091. [DOI] [PubMed] [Google Scholar]
- Litt B, Echauz J. Prediction of epileptic seizures. Lancet Neurol. 2002;1:22–30. doi: 10.1016/s1474-4422(02)00003-0. [DOI] [PubMed] [Google Scholar]
- Michelucci R, Poza J, Sofia V, De Feo M, Binelli S, Bisulli F, et al. Autosomal dominant lateral temporal epilepsy: clinical spectrum, new Epitempin mutations, and genetic heterogeneity in seven European families. Epilepsia. 2003;44:1289–97. doi: 10.1046/j.1528-1157.2003.20003.x. [DOI] [PubMed] [Google Scholar]
- Nyquist H. Certain topics in telegraph transmission theory. Trans AIEE. 1928;47:617–44. reprinted in Proc IEEE 2002;90:280–305. [Google Scholar]
- Ottman R, Winawer M, Kalachikov S, Barker-Cummings C, Gilliam T, Pedley T, et al. LGI1 mutations in autosomal dominant partial epilepsy with auditory features. Neurology. 2004;62:1120–6. doi: 10.1212/01.wnl.0000120098.39231.6e. [DOI] [PMC free article] [PubMed] [Google Scholar]
- Payne E, Look T. Zebrafish modelling of leukaemias. Br J Haematol. 2009;146:247–56. doi: 10.1111/j.1365-2141.2009.07705.x. [DOI] [PubMed] [Google Scholar]
- Robinson D. The electrical properties of metal microelectrodes. Proc IEEE. 1968;56:1065–71. [Google Scholar]
- Rupp B, Reichert H, Wullimann M. The zebrafish brain: a neuroanatomical comparison with the goldfish. Anat Embryol. 1996;194:187–203. doi: 10.1007/BF00195012. [DOI] [PubMed] [Google Scholar]
- Schade J, Weiler I. Electroencephalographic patterns of the goldfish (carassius auratus l) Exp Biol. 1959;36:436–52. [Google Scholar]
- Shannon C. Communication in the presence of noise. Proc IRE. 1949;37:10–21. reprinted in Proc IEEE 1998;86:447–457. [Google Scholar]
- Shorvon S. The epidemiology and treatment of chronic and refractory epilepsy. Epilepsia. 2007;37:s1–3. doi: 10.1111/j.1528-1157.1996.tb06027.x. [DOI] [PubMed] [Google Scholar]
- Teng Y, Xie X, Walker S, Rempala G, Kozlowski D, Mumm J, et al. Knockdown of zebrafish Lgi1a results in abnormal development, brain defects and a seizure-like behavioral phenotype. Hum Mol Genet. 2010;19:4409–20. doi: 10.1093/hmg/ddq364. [DOI] [PMC free article] [PubMed] [Google Scholar]
- Vriens J, Appendino G, Nilius B. Pharmacology of vanilloid transient receptor potential cation channels. Mol Pharmacol. 2009;75:1262–79. doi: 10.1124/mol.109.055624. [DOI] [PubMed] [Google Scholar]
- Zielinski J. Epilepsy and mortality rate and cause of death. Epilepsia. 1974;15:191–201. doi: 10.1111/j.1528-1157.1974.tb04941.x. [DOI] [PubMed] [Google Scholar]


