Abstract
Mitochondria are highly dynamic organelles whose fusion and fission play an increasingly important role in a number of both normal and pathological cellular functions. Despite the increased interest in mitochondrial dynamics, robust and quantitative methods to analyze mitochondrial fusion and fission activity in intact cells have not been developed. The current state-of-the art method to measure mitochondrial fusion activity is the polyethylene glycol (PEG) fusion assay in which cells expressing distinct mitochondrially-targeted fluorescent proteins (FPs) are fused together and mitochondrial fusion activity is determined by the rate at which color mixing occurs. Although this assay is useful, cell-cell fusion events are rare, and finding the number of fused cells required to generate statistically rigorous data is both tedious and time-consuming. Furthermore, the data-collection methods available for fluorescence microscopy lead to inherent selection biases that are difficult to control for. To that end, we have developed an unbiased and high-throughput method to detect, image and analyze fused cells using the Amnis ImagestreamX™ MKII. With IDEAS™ software, we developed algorithms for identifying the fused cells (two nuclei within a single cell), distinguishing them from cell aggregates. Additionally, using the fluorescence localization of the mitochondrially-targeted fluorescent proteins (YFP and DsRed), we applied a modified co-localization algorithm to identify those cells that had a high co-localization score indicating mitochondrial fusion activity. These algorithms were tested using negative controls (FPs associated with ribosomes and mitochondria) and positive controls (cells expressing both FPs in the mitochondria). Once validated these algorithms could be applied to test samples to evaluate the degree of mitochondrial fusion in cells with various genetic mutations. Ultimately, this new method is the first robust, high thoughput way to directly measure mitochondrial fusion in intact cells. Given how many cellular processes are being linked mitochondrial dynamics, this technique will provide a powerful new tool in the study of this important organelle.
Graphical Abstract
Introduction
Mitochondria are highly dynamic double membrane-bound organelles that are primarily responsible for meeting the energy requirements of the cell1–3 and play an essential role in mediating programmed cell death3. These functions of mitochondria are profoundly influenced by mitochondrial morphology4, which is characterized by continuous cycles of fusion and fission5. Shifts in the balance of fission and fusion can result in rapid changes in mitochondrial morphology and significantly impact mitochondrial function6. Analysis of a large number of different cell types reveals a high degree of variability in mitochondrial morphology2, ranging from extensive interconnected networks to populations of small, punctuate like structures7,8. This variability arises as a response to the particular energetic demands of each cell type and to the particular nutrient conditions it encounters. Alterations in the activity of the mitochondrial fusion and fission machinery regulate the morphologies seen among different cell types. The mitochondrial machinery consists of large dynamin-related GTPases2 MFN1, MFN2 (outer membrane fusion), OPA1 (inner membrane fusion) and Drp1 (fission)4. Defects in this machinery result in a wide range of pathologies, from neurodegenerative diseases to cancer1,3,9,10. Despite its importance in so many cellular and organismal processes, there is currently a lack of robust, quantitative assays to monitor mitochondrial fusion and fission activity. In particular, because mitochondrial morphology is ultimately determined by a balance of both fission and fusion activity, static pictures of mitochondrial networks are not sufficient to distinguish between the relative contributions of these two processes, despite an increasingly sophisticated set of tools to both generate and analyze these images.
Similar issues limit the utility of even the more robust and quantitative assays of mitochondrial connectedness. For example, the rate of diffusion of a mitochondria-targeted photo-activatable green fluorescent protein (mt-PA-GFP) throughout a mitochondrial network11, or the recovery of fluorescence following photobleaching of a region of mitochondrial network, can both provide a quantitative measure of mitochondrial connectedness. However, these assays fail to distinguish the relative contributions of fusion and fission activity to these phenotypes.
To date, the only direct measure of either fusion or fission activity in cells is the Polyethylene glycol (PEG) fusion assay, which measures content mixing between separately labeled fluorescent mitochondria in two cells whose plasma membranes have been fused through the addition of PEG12–14. Initially utilized to induce fusion of plant protoplasts15, treatment with PEG is a widely used method to fuse mammalian cells and has a variety of applications, including the generation of hybridomas15–17. In the PEG fusion assay, the degree of co-localization between the fluorescent mitochondrial proteins used in the two cells depends on the level of mitochondrial fusion activity and thus can be measured in a quantitative manner. However, there are several drawbacks to this approach as it is currently applied. First, the frequency of cell-cell fusion events following treatment with PEG is relatively low, and thus acquiring enough events for statistical analysis is a time-consuming and laborious process. Further, the need to manually search for fusion events to analyze under the microscope introduces a potential source of bias. To address these issues, we have developed a high throughput method to analyze and quantify mitochondrial fusion activity by fusing mito-YFP and mito-DsRed expressing cells and performing imaging flow cytometry (IFC) via the Amnis ImagestreamX MKII (EMD Millipore, Seattle, WA)18. Through IFC, we are able to drastically reduce the time required to capture the total fusion events of a cell population in a given experiment. Through the co-localization wizard of the ImagestreamX data processing software, IDEAS®, we have generated a standardized method to quantify the co-localization of mitochondria in fused cell populations.
Results
Verification of Mitochondrial Morphology in MEF and HEK cells
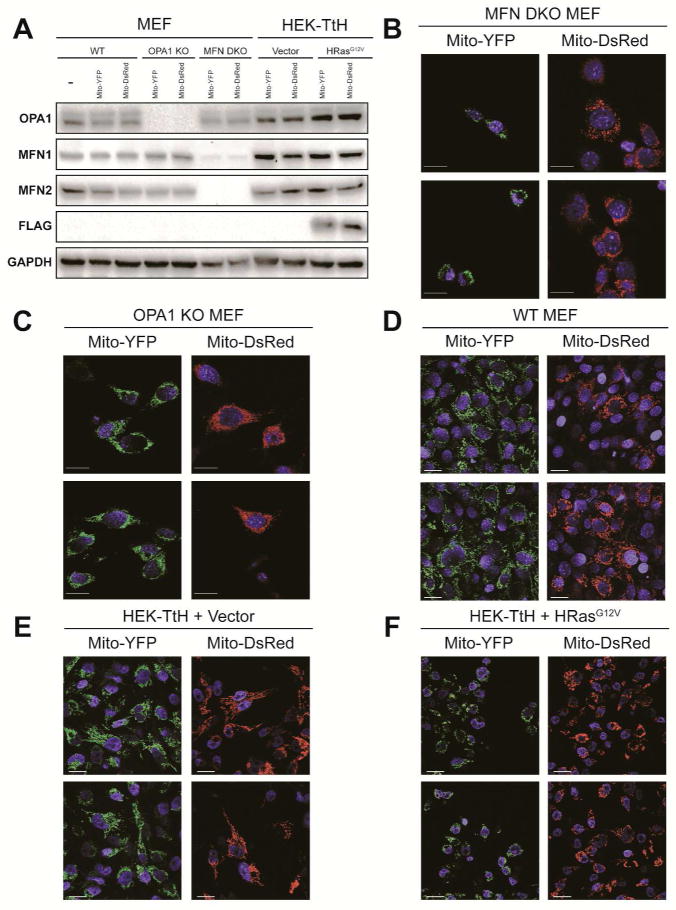
To investigate the capability of IFC to detect co-localization of fused mitochondria, we generated separate fluorescently labeled sets of Mouse embryonic fibroblasts (MEF) and Human embryonic kidney (HEK) cells that would serve as control and experimental samples. As a negative control for mitochondrial fusion, we utilized MFN1 and MFN2 double knockout (MFN DKO)19 or OPA1 knockout MEFs20 that are expressing mitochondrially targeted YFP (mito-YFP)21 or DsRed (mito-DsRed). As MFN1 and MFN2 are involved in the fusion of the outer mitochondrial membrane, their loss prevents mitochondrial fusion resulting in a fragmented mitochondrial morphology. Due to its role in inner mitochondrial membrane fusion, loss of OPA1 also results in mitochondrial fragmentation. We confirmed the loss of MFN1, MFN2 and OPA1 in the red and green labeled sets of MEFs by immunoblot (Figure 1A). As expected, the MFN DKO and OPA1 KO MEFs exhibit a fragmented, punctuate and perinuclear mitochondrial morphology indicative of their defect in mitochondrial fusion (Figures 1B and 1C). In addition to these fusion deficient controls, we established three additional cell lines that express a full complement of fusion machinery (Figure 1A) and display a range of mitochondrial morphologies. These include WT MEFs, which exhibit an intermediate mitochondrial morphology (Figure 1B) and immortalized HEK cells stably transduced with either an empty vector or flag-HRasG12V. As we have previously shown11, the HEK vector alone cells display an intermediate mitochondrial morphology (Figure 1E) while HRasG12V cells exhibit a predominantly fragmented mitochondrial morphology characterized by small, punctate and perinuclear mitochondria (Figure 1F).
Figure 1.
Mitochondrial Morphology of MEF and HEK mito-YFP and mito Ds-Red cells. (A) Immunoblot analysis of the expression level of mitochondrial fusion machinery (OPA1, MFN1 and MFN2) as well as Flag-HRasG12V in a panel of separately labeled fluorescent sets (mito-YFP or mito-DsRed) of MEF and HEK cells. GAPDH, loading control. (B–F) Mitochondrial morphologies of the panel of cells examined by immunoblot in (A). Green, mito-YFP; Red, mito-DsRed; Blue, DAPI. Scale bar, 20 μm.
Mitochondrial Fusion Resolved via Confocal Microscopy
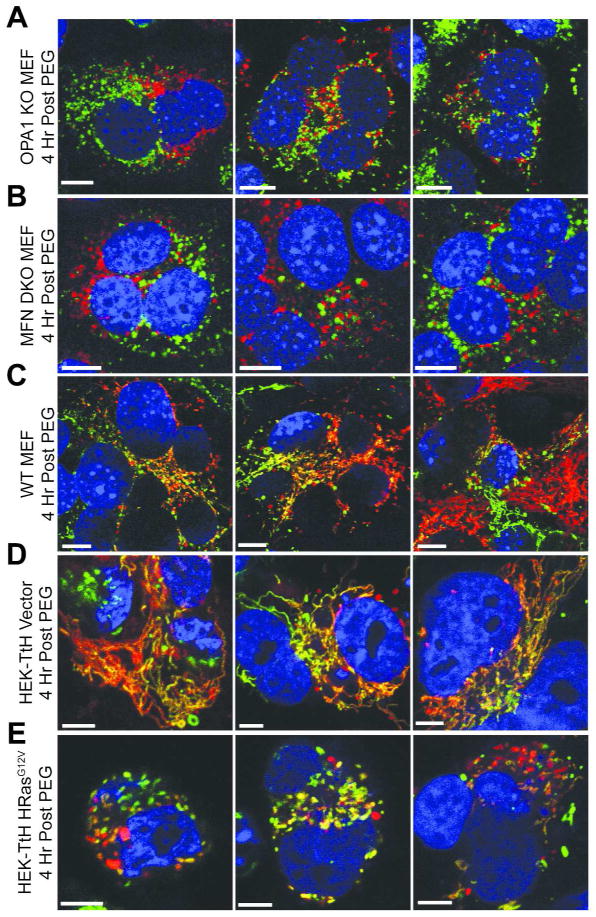
In order to confirm that the mitochondrial morphology of the MFN DKO and OPA1 KO MEFs is due to a defect in fusion activity and to explore the fusion activity in our experimental cell lines, we performed the classical PEG fusion assay between the respective red and green labeled subsets of these cells. Labeled cells were co-plated at a ratio of 1:1 red-to-green and treated with 50% PEG/DMEM for two minutes to induce cell-cell fusion followed by several washes and incubated at 37° for four hours. Analysis of the mitochondrial morphologies through laser scanning confocal microscopy resulted in expected phenotypes of the knockout MEFs. The OPA1 KO and MFN DKO cells exhibited negligible co-localization between red and green signals as demonstrated by distinct red and green puncta in the cytoplasm of fused cells (Figures 2A and 2B). Somewhat surprisingly, the WT MEFs display a low degree of co-localization between red and green signals as revealed by the presence of several red and green puncta surrounding colocalized signals (Figure 2C). These data suggest that WT MEFs have inherently low fusion activity. As expected, the vector expressing HEK cells demonstrated robust co-localization between red and green signals, indicating a high degree of fusion activity over the four hour time course (Figure 2D). In contrast, the HRasG12V expressing cells display reduced co-localization and an increased number of red and green puncta (Figure 2E), suggesting a decrease in mitochondrial fusion activity in the presence of mutated HRas. Collectively, these data confirm that co-localization of separately labeled green and red mitochondria in fused cells requires an intact set of mitochondrial fusion machinery and that these cell lines can serve as a suitable system in which to test the capability of IFC to analyze mitochondrial fusion in a quantitative and high-throughput manner.
Figure 2.
Confocal Microscopy 4 Hrs Post PEG Treatment of MEF and HEK cell lines. Mitochondrial morphologies of fused cells containing separate fluorescently labeled sets of OPA1 KO MEFs (A), MFN DKO MEFs (B), WT MEFs (C), HEK-TtH cells stably expressing either vector alone (D) or HRasG12V (E) after treatment with polyethylene glycol (PEG), obtained by laser scanning confocal microscopy. Each column represents a replicate image of the respective cell type. Cells were treated with 50% (wt/vol) PEG 1500/DMEM for 2 minutes, followed by incubation in 10% FBS/DMEM containing Cyclohexamide (33μg/mL) for 4 Hrs, fixed and analyzed by confocal microscopy. Green, mito-YFP; Red, mito-DsRed; Blue, DAPI. Scale bar, 10 μm.
High Throughput Analysis of Mitochondrial Fusion via IFC
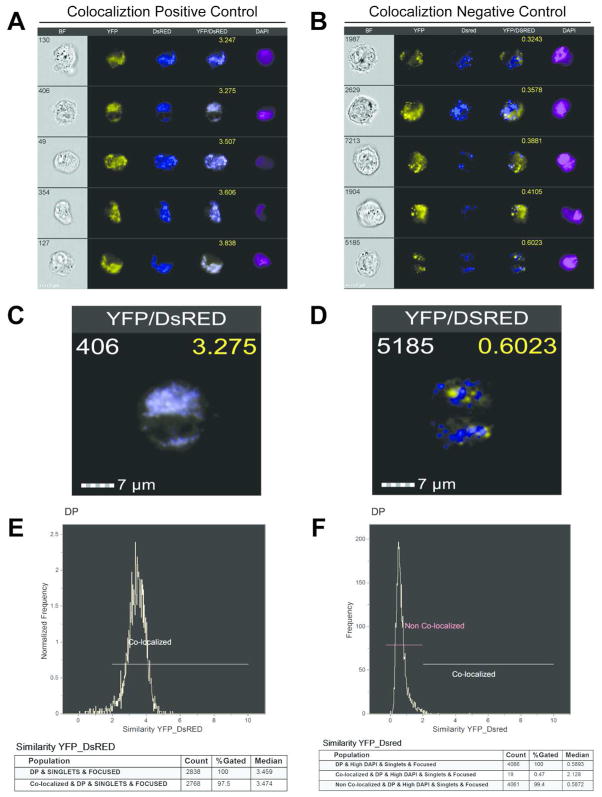
Imaging flow cytometry (IFC) via the ImagestreamX allows for high throughput analysis of a variety of cell characteristics and has only recently been utilized to study aspects of the mitochondria such as protein translocation and mitochondrial localization22,23. We next sought to determine if we could apply the high throughput capability of IFC to characterize and quantify the extent of mitochondrial content mixing by measuring co-localization of mitochondrial fluorescent signals in fused cells. We collected 100,000 events for each cell type, except for the co-expressing YFP/DsRed HEK cells that served as the positive fusion control. We only collected 10000 events for individual mito-YFP and mito-DsRed compensation controls using either mito-YFP or mito-DsRed expressing MEF or HEK cells. Through the IDEAS® 6.0 software, we were able to identify the double positive YFP/DsRed fused cell populations for each cell type (Figure 3). Representative IFC images in four channels demonstrate the complete co-localization between YFP and DsRed for the HEK co-expressing cells (Figure 4A). As the negative control, we utilized the fusion deficient MFN DKO MEFs and performed the PEG fusion assay between mito-YFP and mito-DsRed expressing cells. Representative IFC images for these cells demonstrate the lack of co-localization between YFP and DsRed (Figure 4B). The images acquired by IFC also capture the mitochondrial morphology of the respective positive and negative controls. The HEK cells display a more intermediate mitochondrial morphology (Figure 4C) whereas the MFN DKO MEFs exhibit a fragmented, punctuate morphology (Figure 4D). Similar results were obtained for the OPA1 KO MEFs (Supporting Information Figure 1). Through the IDEAS® co-localization wizard, we were able to acquire co-localization scores for the double positive populations of the positive and negative controls. For the positive control, the co-localization wizard provided a very high median score of 3.474 with 97.5% of the cell population falling in the colocalized range (Figure 4E). The remainder of the population, which didn’t fall into the colocalized region, is most likely composed of cells that weren’t efficiently transduced with either YFP or DsRed. For the negative control, the co-localization wizard produced a very low co-localization median value of 0.5872 for 99.4% of the double positive population, which we identified as non-colocalized (Figure 4F). The very small remainder of the cells (0.47%) fell outside the noncolocalized region with a median score of 2.128. Using these results a ≥ 2 cutoff was set for determining co-localization, based on the minimum range of the positive control and the maximum range of the negative control (Figure 4E and 4F). Taken together, these data demonstrate the ability of the IDEAS® software to generate expected co-localization values (high vs. low) of completely “fused” and fusion deficient mitochondrial populations.
Figure 3.
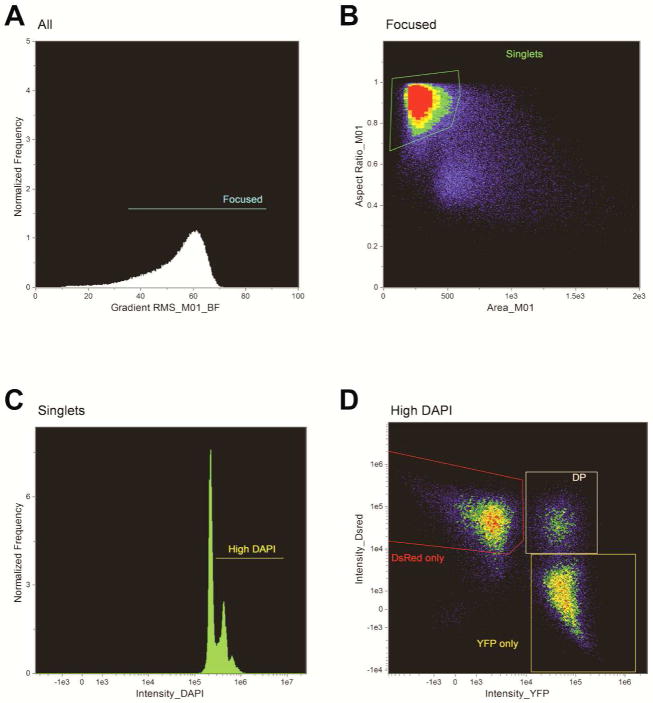
Gating Strategy for identification of double positive Mito-YFP/Mito-DsRed fused cells in the IDEAS Software. (A) Gating of focused cells according to the gradient RMS feature above 30 arbitrary units. (B) The single cells were gated based on their aspect ratio and area in the brightfield channel. (C) Gating of High DAPI expressing cells was based on high DAPI positivity according to DAPI fluorescence intensity. (D) Gating of the double positive mito-YFP/mito-DsRed expressing cells according to fluorescence intensity of YFP and DsRed.
Figure 4.
Establishment of co-localized and non-co-localized cutoffs based on Positive and Negative Mitochondrial Fusion Controls. (A–B) Representative images of HEK-TtH co-expressing Mito-YFP and Mito-DsRed as the positive fusion control (A) or MFN DKO MEFs after PEG treatment as the negative fusion control(B). White number, Cell number; Yellow number, co-localization score. (C–D) Single merged YFP/DsRed Image of positive control (C) or negative control (D). (E–F) Histograms depicting the range of co-localization scores and statistics for the positive control (E) and negative control (F).
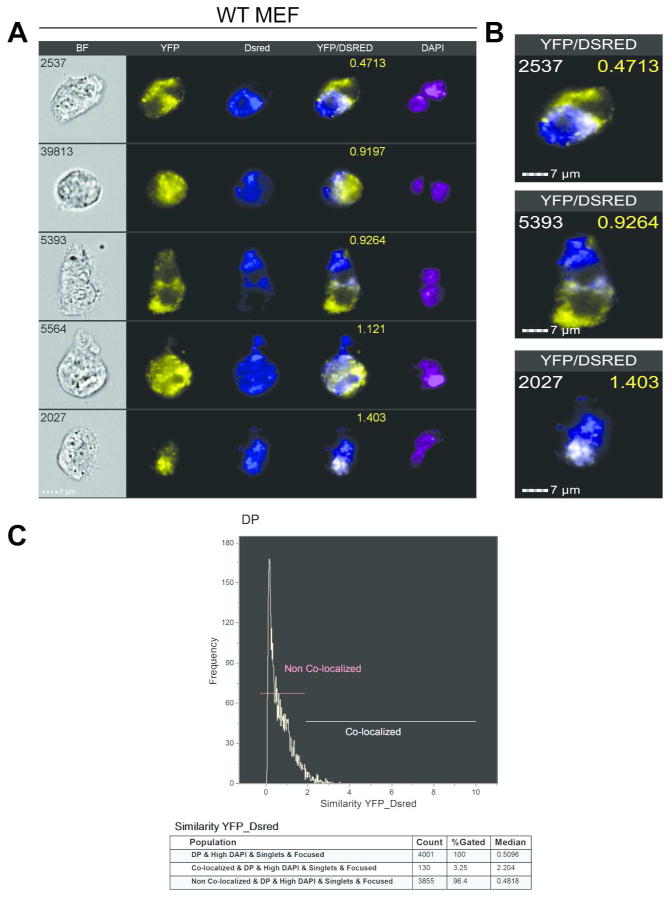
In order to perform an initial test of IFC to measure co-localization in PEG treated cells where we were uncertain of the outcome, we performed the assay on WT MEFs (Figure 5). Consistent with the results from the classical PEG fusion analysis of this cell line, we observed a lack of mitochondrial fusion in the IFC images (Figure 5A and 5B). The merged YFP/DsRed images display distinct red and green signals over large areas within a signal cell, suggesting a lack of mitochondrial mobility. Through co-localization analysis of the DP cell population, we found that the majority (96.4%) fell within the non-colocalized region with a median score of .4818 (Figure 5C), which matches the low level of co-localization seen in the IFC images (Figure 5A and 5B). The remaining colocalized population had a median score of 2.204.
Figure 5.
Co-localization Scores for WT MEFs 4 Hrs Post PEG Treatment. (A) Representative images in five channels of WT MEFs 4Hrs after PEG treatment. (B) Single merged YFP/DsRed images of individual WT MEFs for corresponding co-localization scores (yellow). (C). Histogram demonstrating the range of co-localization scores for the WT MEFs including percentages and median scores of populations in the co-localized and non co-localized regions.
Oncogenic Ras expressing cells have impaired Mitochondrial Fusion
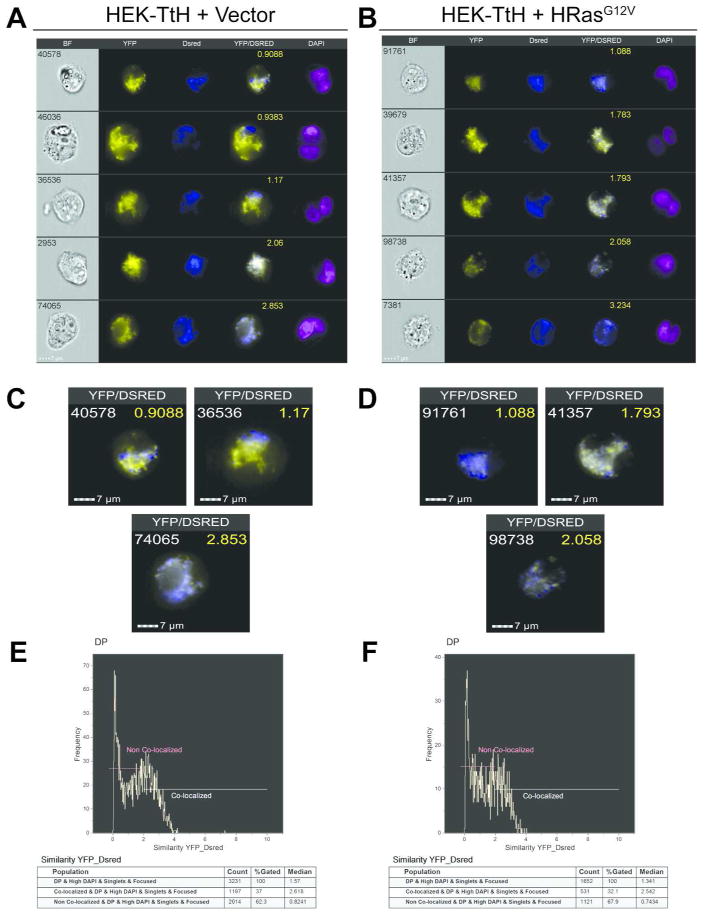
Next we wanted to use IFC to test the mitochondrial fusion capacity of our two HEK cell lines that displayed different mitochondrial fusion activity using the classical PEG fusion assay (Figures 2D–E). We have previously shown that expression of oncogenic HRas leads to robust mitochondrial fragmentation in HEK cells due to the upregulation of mitochondrial fission activity11. Further, a mt-PA-GFP assay found that the mitochondria in cells expressing oncogenic HRas, but not vector control, remained punctate over an hour-long time course, suggesting a possible defect in their fusion activity11. To further test this hypothesis via IFC, we repeated the PEG fusion assay with the separately labeled HEK cells expressing empty vector or oncogenic HRasG12V. We found that HEK cells expressing vector alone achieved a moderate degree of co-localization (Figure 6A) which was comparable to what we observed using confocal microscopy (Figure 2D). The HRasG12V cells displayed less co-localization in IFC images (Figure 6B), also matching what we observed using confocal microscopy (Figure 2E). Upon closer inspection of the IFC images (Figures 6C and 6D), we observe that the mitochondria of each cell type displayed similar mitochondrial morphology to what we observe in Figures 2D and 2E, respectively. These data suggest that the HEK cells are amenable to PEG treatment and are able to maintain their cellular composition after image capture via IFC. We then ran the co-localization wizard on the gated DP population. For the vector control cells, we obtained a distribution that favored the non-colocalized state (62.3%, median co-localization value 0.8241) versus colocalized (37%, median co-localization value 2.618) (Figure 6E). Given that mitochondria are dynamic organelles, these data align with what we would expect from a population of cells with an intermediate mitochondrial morphology in which the mitochondria are constantly undergoing varying degrees of fusion and fission. The HRasG12V cells displayed a distribution where a higher percentage of the fused cells fell within the non-colocalized population (67.9%) and had a lower median co-localization value (.7434) compared to the vector control cells. Conversely, the HRasG12V cells had a lower colocalized population (32.1%) with a lower median co-localization value (2.542) compared to the vector control cells (Figure 6F). These data suggest oncogenic HRas may be signaling to downregulate mitochondrial fusion activity. This loss of fusion activity may contribute to the extensive mitochondrial fragmentation observed in HEK HRasG12V cells where we have shown an upregulation of fission activity. This reciprocal regulation of fusion and fission suggests a bimodal role of oncogenic Ras in mediating mitochondrial dynamics. Taken together, these data validate IFC as a viable high-throughput tool to detect and quantify mitochondrial fusion in mammalian cells.
Figure 6.
Co-localization Scores for HEK-TtH Vector and HEK-TtH HRasG12V 4 Hrs Post PEG Treatment. (AB) Representative images in five channels of HEK-TtH Vector (A) and HRasG12V cells (B) 4 Hrs after PEG treatment. (C–D) Merged YFP/DsRed images of single cells spanning a range of co-localization scores (yellow) for HEK-TtH Vector (C) and HRasG12V cells (D). (E–F) Histograms illustrating the range of co-localization scores for the Vector alone expressing cells (E) and HRasG12V cells including percentages and median scores of populations in the co-localized and non-co-localized regions.
Discussion
Mitochondrial fusion and fission are increasingly recognized to regulate several important physiological processes, especially in the context of human disease. Indeed, several studies have established a connection between the dysregulation of mitochondrial dynamics and the pathology of diseases as diverse as Alzheimer’s disease24, Parkinson’s disease25, diabetes26 and cancer1. Recently we have shown that oncogenic Ras signaling promotes mitochondrial fragmentation and contributes to tumor growth11. These studies underscore the importance of establishing novel high throughput methods to evaluate not just static mitochondrial morphology, but the activity of both mitochondrial fission and mitochondrial fusion machinery in intact cells. Indeed, methods have already been developed to quantify mitochondrial morphology utilizing high-content wide-field fluorescent microscopy in combination with semi-automated data analysis27. Leonard and colleagues employ automated wide-field fluorescence microscopy to initially capture mitochondrial images from live cells followed by “preprocessing” to enhance fluorescent signal from their images and utilize a machine-learning based algorithm to classify mitochondrial morphologies into four different subtypes. Consequently they are able to determine changes in distributions of mitochondrial morphologies as a result of treatment with drugs that impair mitochondrial function27. While developing new methods to quantify changes in mitochondrial morphology, which are vital for proper cellular function, remain an integral part of biological research, there still remains a lack of high throughput methods to directly measure and quantify mitochondrial fusion activity.
Mitochondrial fusion activity can be measured using the PEG fusion assay in which content mixing of separately labeled fluorescent mitochondria in fused cells is used as a readout for mitochondrial fusion activity. The major drawback of this method is that it has traditionally relied on confocal microscopy to survey fusion events and is thus time-consuming and subject to bias. Furthermore, given the low occurrence of cell-cell fusion events following PEG treatment, it is difficult to collect number of fusion events required to achieve statistical rigor.
The application of IFC to examine mitochondrial fusion activity provides a high throughput method to automate the acquisition of double positive cell-cell fusion events with which to subsequently analyze co-localization. The co-localization can be assessed in an objective manner as the IDEAS® 6.0 co-localization wizard can measure co-localization of entire mitochondrial networks on a per cell basis. We have demonstrated the ability to acquire expected co-localization scores for cell types that should have low co-localization due to loss of mitochondrial fusion activity (OPA1 KO and Mfn1/2 DKO) and for cells that should have high co-localization due to co-expression of mito-YFP and mito-DsRed. However, one caveat to the technique may be that the co-localization wizard is unable to distinguish the co-localization of healthy vs. dying cell populations, which will have differing mitochondrial dynamics. This may result in attributing co-localization to non-distinct mitochondrial signals. In future experiments, we may be able to utilize a viability dye such as the LIVE/DEAD® Fixable Far Red Stain (Thermo Fisher Scientific) to segregate live cells from dead cells without fluorescence bleed-through into the DAPI, YFP and DsRed channels already utilized by our assay. Another drawback of the application of IFC to measure mitochondrial fusion is that our gating strategy could not eliminate 100% of the false positive fused double positive cells. These are instances in which a red labeled cell and a green labeled cell have not fused together, but are within close enough proximity to each other to exhibit an aspect ratio and DAPI content to be falsely identified as a cell fusion event with noncolocalized mitochondrial signal. The prevalence of these contaminating events was fairly low, however they may result in the overestimation of the noncolocalized population designated by the co-localization wizard. In an attempt to diminish the contribution of falsely identified fused cells, we utilized the IDEAS® 6.0 software’s Feature Finder wizard to identify the parameters that could segregate these falsely identified fused cells by defining true sets of cells that contain two distinct nuclei within a single cell. The Feature Finder identified the features “Nuclear Aspect Ratio” and “Nuclear Symmetry2 Object (M07, Ch07, tight)” as being able to segregate the true fused cells from those that were not. When the truth sets were overlayed on the “Nuclear Aspect Ratio” vs. “Nuclear Symmetry2 Object (M07, Ch07, tight)” plot, a gate was drawn on the events that fell within the region defined by the truth set depicting two nuclei within a single cell membrane, which we defined as “High DAPI & Multi-Nuclei”. We attempted to verify this gate for single, multinucleated cells in the brightfield image by the presence of two nuclei within a continuous cell membrane/cytoplasm. Upon further inspection, we continued to find cells within the gate that appeared to be two cells/nuclei close together with a high aspect ratio, so we proceeded with our original gating strategy in order to obtain a more robust number of events for analysis. The co-localization scores from our original gating strategy and the “High DAPI & Multi-Nuclei” gating strategy were very similar, implying minimal impact of these contaminating events on the final results. Thus, through our original gating strategy (Figure 3) we were able to test the mitochondrial fusion capacity of WT MEFs as well as that of cells transformed with oncogenic Ras. We determined that Ras transformed cells had impaired fusion activity compared to vector control cells which suggests that oncogenic Ras may be able to signal to fusion machinery in order to moderately downregulate mitochondrial fusion.
In conclusion, we validate IFC as a viable high throughput tool to detect and measure PEG-mediated mitochondrial fusion activity in mammalian cells. This technique will become invaluable as we seek to unravel the intricacies of mitochondrial dynamics and to understand how the interplay of fusion and fission are regulated in a variety of human diseases.
Materials and Methods
Chemicals
Cyclohexamide was obtained from Sigma-Aldrich (St. Louis, MO). Polyethylene Glycol was obtained from Alfa Aesar (Ward Hill, MA). Accutase was obtained from Innovative Cell Technologies (San Diego, CA) and Triton X-100 was obtained from Amresco (Dallas, TX).
Cell lines
OPA1 KO and MFN DKO MEFs were purchased from the ATCC (Manassas, VA). Immortalized HEK Vector and HRasG12V cell lines were previously described11. The WT MEFs were a generous gift from Dr. Chris Counter.
Cell Culture
All cells were maintained in Dulbecco’s Modified Eagles Medium (DMEM, Life Technologies) and supplemented with 10% Fetal Bovine Serum (FBS, Life Technologies).
Protein Analysis
All whole cell lysates were prepared as described previously11.
Plasmids
pBabeBleo empty vector and HRasG12V constructs were previously described11. pWZL-Blasti Mito-YFP was generated through PCR amplification of Mito-YFP21 (5′-ACCGTCGAATTCGCCACCATGTCCGTCCTGACGCCG-3′ and 5′-GTCGCGGTCGACTTACTTGTACAGCTCGTCCATGCC-3′) followed by restriction enzyme digest with EcoRI/SalI and ligation into EcoRI/SalI digested pWZL-Blasti. pWZL-Blasti and pBabeNeo Mito-DsRed were generated by PCR amplification of pDsRed2-Mito (Clontech Laboratories) (5′-ACCGTCGAATTCGCCACCATGTCCGTCCTGACG-3′ and 5′-TTTTTTCTCGAGCTACAGGAACAGGTG-3′) followed by restriction enzyme digest with EcoRI/XhoI and ligation into EcoRI/XhoI digested pWZL-Blasti or EcoRI/SalI digested pBabeNeo.
Immunofluorescence
Cells were prepared for immunofluorescence analysis as described previously11. A Zeiss LSM 700 or 710 confocal microscope with 63x oil objective was used for imaging.
PEG Fusion Assay
For the PEG fusion assay, a total of 20 million separately labeled fluorescent MEF cells expressing mito-YFP or mito-DsRed or 40 million separately labeled HEK cells were seeded at a 1:1 ratio in 143 × 22 mm tissue culture dish and allowed to incubate for 12–16 hours. The cells were then washed once with PBS and incubated in Serum Free (SF) DMEM/Cyclohexamide (CHX) (33 μg/ml) solution for 30 min to inhibit de novo protein synthesis. The cells were then incubated with 5 mL of a 50% (wt/vol) solution of PEG 1500 in SF DMEM for 2 min. Following treatment, the cells were washed three times with a solution of 10% FBS/DMEM/CHX and were left to incubate for 4 hours in 10% FBS/DMEM/CHX.
Sample Preparation and Data Evaluation by Imaging Flow Cytometry
Following PEG treatment, cells were washed twice with DNAse I/PBS (10 units/mL, New England Biolabs) and dissociated using 3 mL of Accutase for 5 min at room temp. The cells were collected in 10 mL of PBS and spun at 1000 rpm for 15 min. The cells were resuspended in 4 mL of PBS and gently filtered through 100 micron filter mesh (Genessee) into 4 mL of a 4% Formaldehyde/PBS mixture to bring the final solution to a concentration of 2% FA/PBS. The cells remained at RT for 10 min with intermittent agitation. The cells were then spun at 2000 rpm for 5 min. The cells were resuspended in 8 mL of DNAse I/PBS and respun at 2000 rpm. The cells were then resuspended in 1 mL of DAPI (1μg/mL, Thermo Fisher Scientific) in 0.1%Triton X-100/DNAse I/PBS. The cells were spun one final time at 2000 rpm for 5 min and resuspended in 50–80 μL of DAPI/0.1% Triton X-100/DNAse I/PBS. The cells are stored at 4° C overnight. We utilized 10 million unstained MEF cells for unstained and DAPI compensation controls. 10 million mito-YFP or mito-DsRed cells were also prepared in this manner for YFP and DsRed compensation controls.
The ISX MKII system utilized in these studies used two CCD cameras with 6 channels per camera, each with 256 rows of pixels. Mito-YFP was excited with 20mW of 488nm laser and emission collected in Channel 2 (480–560nm; camera 1), Mito-DsRed was excited with 200mW of 561nm laser and emission collected in Channel 4 (595–660nm; camera1) and DAPI was excited with 20mW of 405nm laser and emission collected in Channel 7 (420–505nm; camera 2). Brightfield images were collected in both Channel 1 (camera 1) and Channel 9 (camera 2) for insuring the same image location across both cameras. Samples were acquired using the 60X magnification option, which has a numerical aperture of 0.9, pixel resolution was 0.3μm2, a 40μm field of view and a 2.5μm depth of field. At the 60X objective setting cells were hydrodynamically focused to a core of 6μm with a velocity of 40mm/sec. A minimum of 100,000 DAPI positive events was collected whenever cell concentrations allowed. Individual mito-YFP, mito-DsRed and DAPI fluorescent controls were collected (without brightfield & 758nm scatter laser) for determining spectral overlap (compensation) across image channels. Compensation was performed using the Compensation wizard in IDEAS® 6.0 software.
Compensated data files were analyzed with IDEAS® 6.0 software utilizing the gating strategy in Figure 3. First, we selected well focused cells in the brightfield channel by gating on high gradient RMS (Figure 3A). From this focused population of cells we next gated on single cells with an aspect ratio between 0.6 and 1 and an area ranging from 100–500 units in the brightfield channel (Figure 3B). From the population of focused single cells, we then gated on cells expressing high DAPI staining (Figure 3C). Finally, within the high DAPI gate, we segregated the cell populations based on YFP and DsRed intensity and we selected the double positive (DP) YFP/DsRed population to run the IDEAS® 6.0 software co-localization wizard (Figure 3D). The co-localization wizard uses the Bright-detail Similarity feature to quantify the degree to which two probes are colocalized. The algorithm uses a log transformed Pearson’s correlation efficient of the localized spots within the masked area of two images. The higher the “similarity” score, the more co-localization between the images. The only exception to this gating strategy was the positive control HEK cell population which co-expresses YFP and DsRed. As these cells did not undergo PEG-mediated cell fusion, they did not need to be isolated through the high DAPI gate. For co-localization analysis of the HEK co-expressing population, after gating on well focused cells and singlets, we segregated by YFP and DsRed intensity and chose the DP population to run the co-localization wizard (Figure 4). Random images from the colocalized and non colocalized populations were reviewed to determine the accuracy of the algorithm.
Supplementary Material
References
- 1.Grandemange S, Herzig S, Martinou JC. Mitochondrial dynamics and cancer. Seminars in cancer biology. 2009;19:50–56. doi: 10.1016/j.semcancer.2008.12.001. [DOI] [PubMed] [Google Scholar]
- 2.Westermann B. Bioenergetic role of mitochondrial fusion and fission. Biochimica et biophysica acta. 2012;1817:1833–1838. doi: 10.1016/j.bbabio.2012.02.033. [DOI] [PubMed] [Google Scholar]
- 3.Corrado M, Scorrano L, Campello S. Mitochondrial dynamics in cancer and neurodegenerative and neuroinflammatory diseases. International journal of cell biology. 2012;2012:729290. doi: 10.1155/2012/729290. [DOI] [PMC free article] [PubMed] [Google Scholar]
- 4.Chan DC. Fusion and fission: interlinked processes critical for mitochondrial health. Annual review of genetics. 2012;46:265–287. doi: 10.1146/annurev-genet-110410-132529. [DOI] [PubMed] [Google Scholar]
- 5.Kageyama Y, Zhang Z, Sesaki H. Mitochondrial division: molecular machinery and physiological functions. Current opinion in cell biology. 2011;23:427–434. doi: 10.1016/j.ceb.2011.04.009. [DOI] [PMC free article] [PubMed] [Google Scholar]
- 6.Cerveny KL, Tamura Y, Zhang Z, Jensen RE, Sesaki H. Regulation of mitochondrial fusion and division. Trends in cell biology. 2007;17:563–569. doi: 10.1016/j.tcb.2007.08.006. [DOI] [PubMed] [Google Scholar]
- 7.Benard G, Rossignol R. Ultrastructure of the mitochondrion and its bearing on function and bioenergetics. Antioxidants & redox signaling. 2008;10:1313–1342. doi: 10.1089/ars.2007.2000. [DOI] [PubMed] [Google Scholar]
- 8.Kuznetsov AV, Hermann M, Saks V, Hengster P, Margreiter R. The cell-type specificity of mitochondrial dynamics. The international journal of biochemistry & cell biology. 2009;41:1928–1939. doi: 10.1016/j.biocel.2009.03.007. [DOI] [PubMed] [Google Scholar]
- 9.Boland ML, Chourasia AH, Macleod KF. Mitochondrial Dysfunction in Cancer. Frontiers in oncology. 2013;3:292. doi: 10.3389/fonc.2013.00292. [DOI] [PMC free article] [PubMed] [Google Scholar]
- 10.Martin LJ. Biology of mitochondria in neurodegenerative diseases. Progress in molecular biology and translational science. 2012;107:355–415. doi: 10.1016/B978-0-12-385883-2.00005-9. [DOI] [PMC free article] [PubMed] [Google Scholar]
- 11.Kashatus JA, et al. Erk2 phosphorylation of Drp1 promotes mitochondrial fission and MAPK-driven tumor growth. Molecular cell. 2015;57:537–551. doi: 10.1016/j.molcel.2015.01.002. [DOI] [PMC free article] [PubMed] [Google Scholar]
- 12.Mattenberger Y, James DI, Martinou J-C. Fusion of mitochondria in mammalian cells is dependent on the mitochondrial inner membrane potential and independent of microtubules or actin. FEBS Letters. 2003;538:53–59. doi: 10.1016/s0014-5793(03)00124-8. [DOI] [PubMed] [Google Scholar]
- 13.Graves JA, et al. Mitochondrial Structure, Function and Dynamics Are Temporally Controlled by c-Myc. PloS one. 2012;7:e37699. doi: 10.1371/journal.pone.0037699. [DOI] [PMC free article] [PubMed] [Google Scholar]
- 14.Cipolat S, Martins de Brito O, Dal Zilio B, Scorrano L. OPA1 requires mitofusin 1 to promote mitochondrial fusion. Proceedings of the National Academy of Sciences of the United States of America. 2004;101:15927–15932. doi: 10.1073/pnas.0407043101. [DOI] [PMC free article] [PubMed] [Google Scholar]
- 15.Kao KM, MR A Method for High-Frequency Intergenic Fusion of Plant Protoplasts. Planta. 1974;115:355–367. doi: 10.1007/BF00388618. [DOI] [PubMed] [Google Scholar]
- 16.Wojcieszyn JWS, RA, Lumley-Sap K, Jacobson KA. Studies on the Mechanism of Polyethylene Glycol-mediated Cell Fusion using Fluorescent Membrane and Cytoplasmic Probes. The Journal of cell biology. 1983;96:151–159. doi: 10.1083/jcb.96.1.151. [DOI] [PMC free article] [PubMed] [Google Scholar]
- 17.Yang J, Shen MH. Polyethylene glycol-mediated cell fusion. Methods in molecular biology. 2006;325:59–66. doi: 10.1385/1-59745-005-7:59. [DOI] [PubMed] [Google Scholar]
- 18.George TC, et al. Distinguishing modes of cell death using the ImageStream multispectral imaging flow cytometer. Cytometry A. 2004;59:237–245. doi: 10.1002/cyto.a.20048. [DOI] [PubMed] [Google Scholar]
- 19.Chen H, et al. Mitofusins Mfn1 and Mfn2 coordinately regulate mitochondrial fusion and are essential for embryonic development. The Journal of cell biology. 2003;160:189–200. doi: 10.1083/jcb.200211046. [DOI] [PMC free article] [PubMed] [Google Scholar]
- 20.Song Z, Chen H, Fiket M, Alexander C, Chan DC. OPA1 processing controls mitochondrial fusion and is regulated by mRNA splicing, membrane potential, and Yme1L. The Journal of cell biology. 2007;178:749–755. doi: 10.1083/jcb.200704110. [DOI] [PMC free article] [PubMed] [Google Scholar]
- 21.Karbowski M, et al. Spatial and temporal association of Bax with mitochondrial fission sites, Drp1, and Mfn2 during apoptosis. The Journal of cell biology. 2002;159:931–938. doi: 10.1083/jcb.200209124. [DOI] [PMC free article] [PubMed] [Google Scholar]
- 22.Wabnitz GH, et al. Mitochondrial translocation of oxidized cofilin induces caspase-independent necrotic-like programmed cell death of T cells. Cell Death Dis. 2010;1:e58. doi: 10.1038/cddis.2010.36. [DOI] [PMC free article] [PubMed] [Google Scholar]
- 23.Prowse AB, et al. Analysis of mitochondrial function and localisation during human embryonic stem cell differentiation in vitro. PloS one. 2012;7:e52214. doi: 10.1371/journal.pone.0052214. [DOI] [PMC free article] [PubMed] [Google Scholar]
- 24.Dupuis L. Mitochondrial quality control in neurodegenerative diseases. Biochimie. 2013 doi: 10.1016/j.biochi.2013.07.033. [DOI] [PubMed] [Google Scholar]
- 25.Rakovic AGAKJBNPP, Lohmann K, Klein C. Mutations in PINK1 and Parkin Impair Ubiquitination of Mitofusins in Human Fibroblasts. PloS one. 2011;6:1–13. doi: 10.1371/journal.pone.0016746.g001. [DOI] [PMC free article] [PubMed] [Google Scholar]
- 26.Gordon JWJW. Targeting skeletal muscle mitochondria to prevent type 2 diabetes in youth. Biochemistry and cell biology. 2015:1–14. doi: 10.1139/bcb-2015-0012. [DOI] [PubMed] [Google Scholar]
- 27.Leonard AP, et al. Quantitative analysis of mitochondrial morphology and membrane potential in living cells using high-content imaging, machine learning, and morphological binning. Biochimica et biophysica acta. 2015;1853:348–360. doi: 10.1016/j.bbamcr.2014.11.002. [DOI] [PMC free article] [PubMed] [Google Scholar]
Associated Data
This section collects any data citations, data availability statements, or supplementary materials included in this article.


