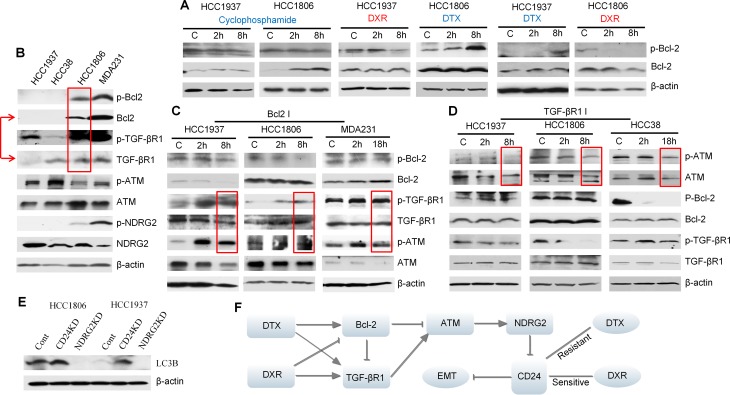
Figure 6. Interactions between Bcl-2, TGF-βR1 and ATM signaling in TNBC cells treated with either docetaxel (DTX) or doxorubicin (DRX).
(A) and (B) Western blot results. Docetaxel: 6.4 μM; doxorubicin: 4 μM; cyclophosphamide: 2 μM. The results showed that doxorubicin reduced p-Bcl-2 in HCC1937 and HCC1806 and docetaxel increased p-Bcl-2 in the same cell lines. Cyclophosphamide had no significant effect on p-Bcl-2 in the two cell lines. HCC38 had a relatively higher basal level of TGF-βR1 compared to HCC1937. The bands of p-Bcl-2, Bcl-2 and β-actin in HCC1806 treated with DTX and HCC1937 treated with DXR have been shown in Figure 5. They were shown here again for a different comparison. (C) Cells were treated with 5 μM Bcl-2 inhibitor ABT-737. The results showed that Bcl-2 inhibitor stimulated p-TGF-βR1 and p-ATM, suggesting that Bcl-2 is an inhibitor of TGF-βR1 and ATM in the three cell lines. (D) Cells were treated with 5 μM TGF-βR1 inhibitor LY 364947. The results showed that TGF-βR1 inhibitor suppressed p-ATM and TGF-βR1 is stimulatory to p-ATM. (E) The Western blot results of autophagy marker-LC3B. The results showed that CD24 knockdown increased LC3B expression and NDRG2 knockdown eliminated LC3B expression. (F) Proposed diagram to summarize contrasting effects of doxorubicin and docetaxel on critical TNBC cell signaling pathways.

