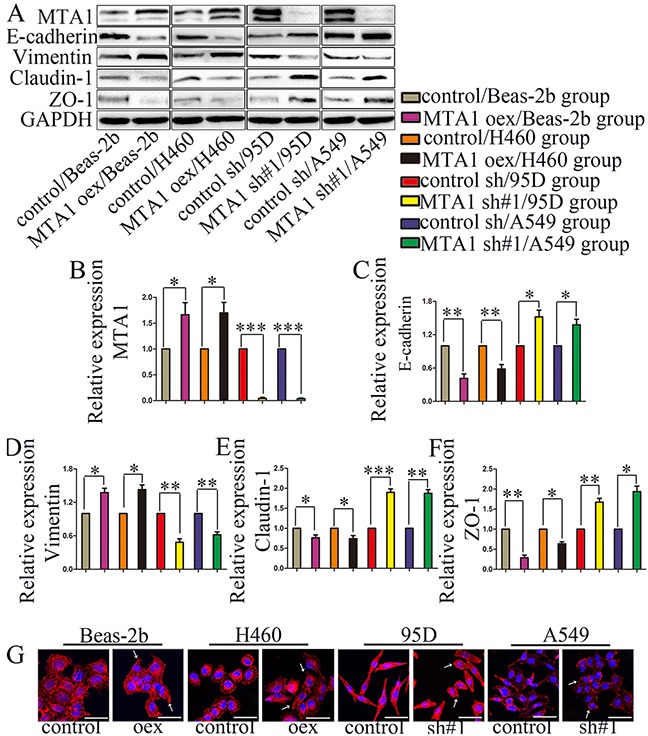
Figure 3. MTA1 expression is associated with NSCLC cell EMT.

(A) Western blot analysis of MTA1, E-cadherin, Vimentin, Claudin-1, and ZO-1 expression GAPDH was used as a loading control. Quantitative data are shown in (B–F). Student t-test was used for statistical analyze for three independent experiments. *P<0.05, **P<0.01, ***P<0.001. (G) Cell cytoskeleton images were obtained via confocal microscopy MTA1 overexpression changed cells from relatively circular to irregular in shape, with the emergence of prolonged “feet.” The “feet” of MTA1-shRNA-treated cells were shortened, and cells changed from long spindles to relatively elliptical or circular in shape compared with controls. Red: F-actin; blue: nuclei (bars: 50 μm). →: representative changes; oex: overexpression; sh#1: shRNA#1.
