

Abstract
Animal studies have shown that autophagy is essential in the process of obesity. Here, we performed daily injection of the autophagy inhibitor chloroquine (CQ) in mice and found that systemic administration of CQ blocks high-fat diet-induced obesity. To investigate the potential underlying molecular mechanism, we employed genetic and pharmacological interventions in cultured preadipocytes to investigate the role of autophagy in the control of the expression of the adipogenic regulator peroxisome proliferatior-activated receptor-γ (PPARγ). We show that adipogenic differentiation of 3T3-L1 preadipocytes is associated with activation of autophagy and increased PPARγ2 protein level. Treatment with CQ, shRNA-mediated knockdown, or genetic engineering-induced deletion of autophagy-related gene 5 (Atg5) promoted proteasome-dependent PPARγ2 degradation and attenuated adipogenic differentiation. Therefore, activated autophagy increases PPARγ2 stability and promotes adipogenic differentiation, and inhibition of autophagy may prevent high-fat diet-induced obesity and the consequential type 2 diabetes.
Keywords: peroxisome proliferatior-activated receptor-γ2, obesity, adipogenesis, adipogenic differentiation, autophagy, proteasome-dependent protein degradation
obesity is a major health risk factor that contributes significantly to the development of many human diseases, including type 2 diabetes mellitus, hyperlipidemia, hypertension, coronary heart diseases, and certain types of cancer (13, 14, 34). Embryonic mesenchymal stem cells from the mesoderm give rise to common early precursors or adipoblasts, and these cells develop further into committed preadipocytes and ultimately mature adipocytes. Obesity can result from adipocyte hypertrophy (an increase in adipocyte size) and hyperplasia (an increase in cell number) (19, 28). In humans, adipocyte number increases dramatically in the first two decades of life and continues to turn over at the rate of 10% per year throughout adulthood (38). Since mature adipocytes are postmitotic, adipocyte hyperplasia requires formation of new adipocytes from the differentiation of precursor cells.
A transcriptional cascade for adipogenesis involving the sequential induction of transcription factors Krox20, Klf4, C/EBPs, and peroxisome proliferator-activated receptor-γ (PPARγ) has been elucidated in preadipocyte lines (4, 11, 39). Among these factors, PPARγ is both necessary and sufficient to induce adipogenesis in vitro and in vivo (3, 35, 43). In particular, genetic studies have shown that PPARγ is rate limiting in the development of obesity and insulin resistance in animal models (26) and in human populations (12, 16).
A recent advancement in the understanding of adipogenesis is in the role of autophagy, a catabolic process for the degradation of bulk cytoplasmic contents and subcellular organelles (29, 31). Autophagy has been functionally linked to adipogenesis and obesity. Specifically, increased autophagy and autophagic flux in adipose tissues in obesity have been observed in obese humans and animals (21, 25, 33), although one study reported suppressed autophagy in adipose tissues in mice (46). Importantly, genetic disruption of autophagy genes such as Atg5 and Atg7 significantly impedes adipogenesis in cultured preadipocytes and attenuates diet-induced obesity in mice (2, 47). These exciting findings have revealed the functional importance of autophagy in obesity; however, the link between autophagy and cellular program of adipogenesis and obesity remains to be further defined. We hypothesized that an activation of autophagy is critical in adipogenic differentiation by regulating the expression of adipogenic transcription factors.
Here, we first show that systemic administration of CQ, an inhibitor of autophagy, blocks high-fat diet-induced obesity and insulin resistance in mice. To gain mechanistic insights, we took advantage of pharmacological and genetic interventions in a well-established cell culture system to show that activation of autophagy is associated with and functionally required for adipogenic differentiation in vitro. We then show data supporting the functional importance of autophagy on proteasome-mediated degradation of the functional isoform of PPARγ, PPARγ2. These findings provide mechanistic insights and prove the feasibility of targeting autophagy pharmacologically for prevention of obesity and related pathological conditions.
MATERIALS AND METHODS
Reagents and antibodies.
Bovine serum albumin (fatty acid free), human recombinant insulin, 3-isobutyl-1-methylxanthine (IBMX), dexamethasone (DEX), Oil Red O dye, chloroquine (CQ), hydroxychloroquine (HCQ), primaquine (PQ), bafilomycin (Baf), polybrene, Eagle's Balanced Salt Solution, and the set of Atg5 shRNA lentiviruses with three different target sequences (NM_053069.2-381s1c1, NM_053069.2-576s1c1, and NM_053069.2-514s1c1) and a non-target shRNA lentivirus (SHC002V) were purchased from Sigma. TRIzol reagent and all cell culture media were purchased from Invitrogen. Antibodies against PPARγ, C/EBPα, C/EBPβ, C/EBPδ, fatty acid-binding protein 4 (FABP4; aP2), LC3, and p62 were from Cell Signaling Technology. Antibody for Atg5 was from Novus Biologicals. Antibody for α-tubulin was from Abcam. Protease inhibitor tablets were from Roche.
Animals.
Adult male mice (C56BL/6J, 8 wk of age) were purchased from the Jackson Laboratory and housed in temperature-controlled (21°C) quarters with a 12:12-h light-dark cycle. Mice were fed normal chow (Purina Chow, 11% fat) or a 60% high-fat diet (D12492; Research Diets) for 8 wk with a daily injection of saline or CQ (60 mg·kg−1·day−1 ip). The mice with targeted disruption of the Atg5 gene (in C57BL/6 background) were obtained from Dr. Noboru Mizushima at Tokyo Medical and Dental University (27). Because of the early postnatal lethality, all Atg5 mutant mice were maintained as heterozygous mutant. All animal protocols were approved by the SingHealth and University of Virginia Institutional Animal Care and Use Committees.
Body composition.
Mice were analyzed for body composition by using an EchoMRI-100 (Echo Medical Systems) essentially as described previously (15).
Glucose tolerance test.
Glucose tolerance tests were performed by a bolus intraperitoneal (ip) glucose injection (0.5 g/kg) after overnight fasting. Blood samples were taken at various time points (0–120 min) from the tail vein, and blood glucose concentrations were measured by using an Ascensia Contour Blood Glucose Meter (Bayer).
[18F]fluorodeoxyglucose MicroPET imaging.
Imaging was performed for measurement of insulin-stimulated glucose uptake in living mice by using a dedicated small-animal PET scanner (R4 microPET scanner; Concordes Microsystems). Following overnight fasting (∼16 h, from 1700 to 0900) with water ad libitum, mice were injected with ∼5.5 MBq of [18F]FDG (ip). Three 2-min static acquisitions were performed for each mouse as follows. The first acquisition was initiated upon injection of 2 U/kg insulin (Actrapid; Novo Nordisk) 25 min post-[18F]fluorodeoxyglucose ([18F]FDG) injection. The second and third acquisitions were carried out at 25 and 50 min post-insulin injection. During the scanning period, mice were maintained under 2% isoflurane anesthesia in oxygen, with the ambient temperature maintained at ∼30°C by an infrared lamp. Mice were returned to regular cages maintained at 37°C for recovery from the anesthesia in between each acquisition. The same procedures were performed in a staggered manner (3 min) or in additional mice (≤8 mice). An energy window of 350–700 keV and a coincidence timing window of 6 ns were used. Two-dimensional histograms by Fourier rebinning and image reconstruction by filtered back projection were used. The image data were corrected for nonuniformity of the scanner response, dead time count losses, and physical decay to the time of injection. No correction was applied for attenuation, scatter, or partial volume averaging. For quantitative image analysis, regions of interest were drawn manually over the lower hindlimbs. The counting rates in the reconstructed images were converted to standardized uptake values by a system calibration factor derived from the imaging of a mouse-size water-equivalent phantom containing 18F. Insulin-stimulated glucose uptake was calculated as percent increase of peak standardized uptake value at 50 min post-insulin injection.
Cell culture.
Atg5−/− embryonic fibroblasts were prepared from 19.5-day-old embryos following timed pregnancy. Briefly, 19.5-day pregnant mice were euthanized humanely under isoflurane-induced anesthesia by cervical dislocation. Each embryo was removed from the uterus and placed in a six-well plate with 3 ml of 1× phosphate buffered saline (PBS). The hindlimbs were finely minced and digested in 2 ml trypsin-EDTA at 37°C for 20 min with frequent shaking (every 5 min). The digested tissues were dispersed by pipetting 10–20 times, followed by centrifugation at 800 g for 3 min. The supernatant was then transferred and plated on a 35-mm plate with 3 ml of growth medium consisting of Dulbecco's modified Eagle's medium (4.5 g/l glucose, 4.0 mM glutamine, and 1.0 mM sodium pyruvate) supplemented with 10% fetal bovine serum at 37°C in 5% CO2, with medium change every other day. 3T3-L1 preadipocytes and mouse embryonic fibroblasts were maintained at 37°C in 5% CO2 in growth medium. For differentiation, confluent cells were maintained in growth medium for 2 more days before being switched to differentiation medium (growth medium + 250 nM insulin, 0.5 mM IBMX, and 1.0 μM DEX). After 2 days, the differentiation medium was replaced by maintenance medium (growth medium + 250 nM insulin), and the cells were maintained in maintenance medium with medium change every other day. To determine the impact of autophagy inhibition on adipogenic differentiation in vitro, 3T3-L1 adipocytes were treated with CQ, HCQ, PQ (all at 30 μM), or Baf (20 nM) in differentiation medium for 24 h before being switched to maintenance medium for 4 days, followed by assessment of adipogenic differentiation by Oil Red O staining and other analyses.
PPARγ stability.
To determine PPARγ stability, we incubated proliferating (in growth medium) or differentiating (24 h after being switched to differentiation medium) 3T3 cells for 0, 2, 4, 6, 8, or 10 h, followed by sample harvesting and Western blot analysis. To determine whether the effect of autophagy inhibition on PPARγ2 expression is mediated through interference with proteasome-dependent proteolysis, we treated confluent 3T3-L1 cells in differentiation medium with or without proteasome inhibitor MG132 (50 μM) for 2 h, followed by treatments with/without MG132 plus CQ, HCQ, or PQ for 24 h (all at 30 μM).
Lentivirus-mediated gene knockdown.
Two days postconfluence, 3T3-L1 preadipocytes were cultured in differentiation medium with Atg5 shRNA or nontargeting shRNA lentiviruses and 6 μg/ml polybrene. The cells were infected with the lentiviruses at MOI of 50 TU/cell. The cells were washed once with PBS and changed to maintenance medium 48 h after the infection. The cells were cultured in maintenance medium for 4 days before being harvested for further analyses.
Oil Red O staining.
Neutral lipid content in differentiated 3T3-L1 adipocytes or mouse embryonic fibroblasts (MEF) from WT and Atg5−/− mice was determined by Oil Red O staining, as described previously (23), with minor modifications. Specifically, differentiated 3T3-L1 adipocytes or MEF were washed twice with PBS, fixed in 3.7% formaldehyde for 2 h, and stained with 0.2% (wt/vol) Oil Red O solution in 60% (vol/vol) isopropanol for 3 h. Cells were then washed with water three times, and excess water was evaporated at room temperature. To determine lipid content in the cells, a certain volume of isopropanol (0.5 ml/well of a 24-well plate) was added to the plates. The extracted dye was removed by pipetting to a new 96-well plate, and the optical density was monitored spectrophotometrically at 510 nM.
Western blotting analysis.
Cells were harvested in lysis buffer containing 128 mM Tris·HCl (pH 6.8), 40 mM DTT, 2.5% SDS, 22% glycerol, 2% 2-mercaptoethanol, 0.025% bromophenol blue, and 1 tablet/10 ml of protease inhibitors. The lysates were sonicated and boiled before being loaded on SDS-PAGE. Western blotting was carried out, and detection of infrared fluorescence signal from fluorophores conjugated to the secondary antibodies was performed using the Li-COR Odyssey Imager (LI-COR Biosciences). The image quantification was carried out with Scion Image Software.
Semiquantitative RT-PCR.
Total RNA isolation, reverse transcriptional reaction, and PCR reaction were performed as described previously (44). PPARγ and GAPDH mRNA levels were quantitatively analyzed with Scion Image Software. PPARγ mRNA abundance was normalized to that of GAPDH. The PCR primers used are as follows: PPARγ forward primer 5′-TTTTCAAGGGTGCCAGTTTC-3′, PPARγ reverse primer 5′-TCTGTGACGATCTGCCTGAG-3′; GAPDH forward primer 5′-AACTTTGGCATTGTGGAAGG-3′, GAPDH reverse primer 5′-CCCTGTTGCTGTAGCCGTAT-3′. Sequential denaturing (94°C for 30 s), annealing (60°C for 30 s), and extension (72°C for 40 s) reactions were repeated 24 and 17 times for PPARγ mRNA and GAPDH mRNA, respectively.
Statistics.
The results are presented as means ± SE. Data for different treatments and time courses were analyzed using one-way ANOVA. Data for comparison between two groups were analyzed using Student's unpaired t-test (2-tailed). Data for animal studies with diet and drug interventions were analyzed using two-way ANOVA. These statistical analyses were followed by the Student-Newman-Keuls test, with P < 0.05 being statistically significant.
RESULTS
Systemic administration of CQ prevents high-fat diet-induced obesity and insulin resistance in mice.
Increased autophagy and autophagic flux in adipose tissues have been associated with obesity (21, 25, 33), and genetic inhibition of autophagy attenuates diet-induced obesity (2, 47). To further investigate autophagy function in adipogenesis in vivo and test the feasibility of targeting autophagy for prevention of obesity, we subjected mice to daily injections of CQ (60 mg/kg ip), with known inhibitory effects toward autophagy in vivo (1) during 8 wk of high-fat feeding. This effective dose that was used previously is moderately higher than that recommended for humans (∼15 mg/kg) (1). We observed that CQ injection reduced high-fat diet-induced obesity significantly, with no significant impact on food intake (Fig. 1, A–D, and Table 1). High-fat diet also resulted in a moderate but significant reduction of lean body mass, which was completely ameliorated by CQ injection (Table 1). Therefore, CQ injection is sufficient to prevent high-fat diet-induced obesity in mice. As a consequence, CQ injection significantly reduced glucose intolerance [30,095 ± 1,176 mg·dl−1·min area under the curve (AUC) for HF-SL and 24,124 ± 1,522 mg·dl−1·min AUC for HF-CQ; n = 10–12, P < 0.01; Fig. 1, E and F] and insulin resistance in skeletal muscle, as assessed by microPET analysis (Fig. 1, G and H). Therefore, CQ, an inhibitor of autophagy, can potentially be used to prevent diet-induced obesity and the consequent insulin resistance. Transmission electron microscopy analysis revealed that CQ administration also improved mitochondrial morphology (swelling and degeneration) in the liver induced by high-fat diet (Fig. 1I), suggesting that CQ may have broader impact on the metabolic syndrome other than the prevention of obesity.
Fig. 1.
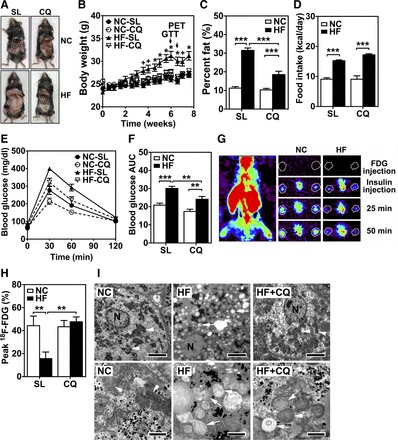
Systemic administration of chloroquine (CQ) prevents high-fat diet-induced obesity and insulin resistance in mice. Adult (12 wk of age) male wild-type mice (C57BL/6) were on normal chow (NC) or high-fat diet (HF) for 8 wk, with daily injection (ip) of normal saline (SL) or CQ (60 mg/kg). A: anterior views of mice following euthanization showing the appreciable differences in body size and visceral adipose tissues through the abdominal incision following 8 wk of diet and pharmacological intervention. B: changes in body weight during the treatments (n = 12/group). + and *, P < 0.05 and P < 0.01, respectively, vs. NC-SL for each time point. C: %body fat measured by MRI. D: daily food intake based on consumed food weight. E: blood glucose level during glucose tolerance test (GTT). F: area under the curve (AUC) of blood glucose levels during GTT (n = 12/group). G: representative microPET images of [18F]FDG radioactivity in the whole body of a mouse and in the lower hindlimb muscles (at the position indicated by a line on the whole body image) during a dynamic scan following insulin (2 U/kg) injection at 25 and 50 min post-insulin injection (ip). H and I: radioactivity in hindlimb muscles 50 min post-insulin injection in [18F]fluorodeoxyglucose ([18F]FDG) microPET analysis (n = 10–12/group) (H) and transmission electron microscopy of liver from mice on NC or HF diet with daily normal saline (HF) or CQ injections (HF + CQ) (I). High-fat-induced mitochondrial pathology (arrows point to normal mitochondria, and arrowheads point to swelling mitochondria) was significantly attenuated by CQ injection. Bars equal 5 and 1 μm at top (low magnification) and bottom (high magnification), respectively. **P < 0.01; ***P < 0.001.
Table 1.
Daily CQ injection prevents high-fat diet-induced obesity in mice
| NC-SL | NC-CQ | HF-SL | HF-CQ | |
|---|---|---|---|---|
| Food intake, kcal/day | 9.09 ± 0.48 | 9.08 ± 1.14 | 15.23 ± 0.28*** | 17.21 ± 0.36+++ |
| Body weight, g | 26.5 ± 0.5 | 26.1 ± 0.7 | 30.9 ± 0.7*** | 27.12 ± 0.5+++ |
| Fat weight, g | 2.98 ± 0.22 | 2.64 ± 0.18 | 9.84 ± 0.69*** | 5.02 ± 0.50+++,### |
| Lean body mass, g | 20.8 ± 0.5 | 20.7 ± 0.8 | 18.6 ± 0.3* | 19.4 ± 0.6 |
| Fluid, g | 1.01 ± 0.17 | 1.10 ± 0.16 | 0.50 ± 0.13 | 0.59 ± 0.17 |
| %Fat | 11.2 ± 0.8 | 10.3 ± 0.8 | 31.5 ± 1.3*** | 18.5 ± 1.8+++,### |
| %Lean body mass | 78.3 ± 0.9 | 79.1 ± 0.9 | 60.5 ± 1.2*** | 71.4 ± 1.8+++,### |
Values are means ± SE (n = 12). CQ, chloroquine; HF, high-fat; NC, normal chow; SL, normal saline. Adult (12 wk of age) male wild-type mice (C57BL/6) were on NC or HF diet for 8 wk with daily injection (ip) of SL or CQ (60 mg/kg).
P < 0.05 vs. NC-SL group;
P < 0.001 vs. NC-SL group; +++P < 0.001 vs. HF-SL group; ###P < 0.001 vs. NC-CQ group.
Adipogenic differentiation is associated with activation of autophagy.
To further investigate the potential mechanism by which inhibition of autophagy prevents obesity, we determined whether autophagy is activated in adipogenic differentiation by measuring protein levels of autophagy markers sequestosome 1 (Sqstm1 or p62) and microtubule-associated protein 1A/1B-light chain 3 (LC3 or Atg8). Within 24 h of adipogenic differentiation in 3T3-L1 preadipocytes, both p62 and the ratio of LC3-II to LC3-I were significantly reduced (Fig. 2, A and B), indicating collectively an activation of autophagy with increased flux (32). To further confirm increased autophagy in adipogenic differentiation, we measured LC3-I to LC3-II conversion (32) in cells treated with CQ (30 μM), which is known to block autophagasome-lyosome fusion and autophagy flux with accumulation of LC3-II (1). CQ treatment led to greater fold increases of LC3-II and p62 in differentiating preadipocytes (24 h into differentiation) than proliferating preadipocytes treated with CQ for the same duration (Fig. 2, C and D). As a positive control, we subjected in 3T3-L1 preadipocytes to nutrient starvation, which is known to activate autophagy (27, 40), and found that starvation resulted in reduced p62 expression and LC3-II/LC3-I ratio in 3T3-L1 preadipocytes (Fig. 2, E and F). These data collectively suggest that autophagy is activated during the early phase of adipogenic differentiation.
Fig. 2.
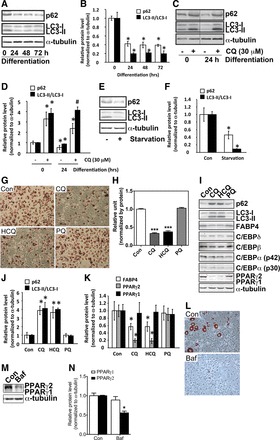
Adipogenic differentiation is associated with activation of autophagy, and autophagy inhibitor treatment prevents adipogenic differentiation. A: Western blot analysis of p62 and LC3 protein levels in 3T3-L1 preadipocytes at 0, 24, 48, and 72 h after initiation of differentiation. B: quantification of protein levels normalized by α-tubulin. *P < 0.05 vs. 0-h time point. C: Western blot analysis of p62 and LC3 in proliferating (0 h) and differentiating (24-h differentiation) 3T3-L1 preadipocytes treated with (+) or without (−) 30 μM CQ for 24 h. D: quantification of protein levels normalized by α-tubulin. *P < 0.05 vs. proliferating cells without treatment. E: Western blot analysis of p62 and LC3 in proliferating 3T3-L1 preadipocytes in growth medium (Con) or Eagle's Balanced Salt Solution without serum (starvation) for 6 h. F: quantification of protein levels normalized by α-tubulin. *P < 0.05 vs. Con. G: Oil Red O staining of differentiated 3T3-L1 adipocytes treated with CQ, hydroxychloroquine (HCQ), or primaquine (PQ) (all at 30 μM) in differentiation medium for 24 h before being switched to maintenance medium for 4 days. H: quantification of Oil Red O staining (n = 9/treatment). I: Western blot analysis of markers for autophagy, adipogenic differentiation, and transcription factors involved in adipogenic differentiation following CQ, HCQ, or PQ treatment. J and K: quantification of protein levels normalized by α-tubulin. *P < 0.05 vs. Con. L: Oil Red O staining of differentiated 3T3-L1 adipocytes treated with bafilomyscin (Baf; 20 nM) in differentiation medium for 24 h before being switched to maintenance medium for 4 days. M: Western blot analysis of PPARγ protein. N: quantification of protein levels normalized by α-tubulin. *P < 0.05 vs. Con. All drug treatment experiments were done 3 times with at least triplicate samples for each condition. *P < 0.05; ***P < 0.001 vs. Con.
CQ treatment prevents adipogenic differentiation with reduced PPARγ2 protein level.
We then sought to determine the functional role of autophagy by pharmacological interventions. We treated 3T3-L1 preadipocytes for only the first 24 h during adipogenic differentiation with CQ and two other anti-malaria drugs with similar chemical structures, HCQ and PQ. CQ and HC, but not PQ, blocked the adipogenic differentiation as assessed by Oil Red O staining (Fig. 2, G and H). To further confirm the blockage of adipogenic differentiation, we examined the protein levels of transcriptional factors that function in regulation of adipogenesis, such as C/EBPs and PPARγ, and proteins that function in mature adipocytes, such as FABP4 (aP2). CQ and HCQ, but not PQ, significantly reduced PPARγ protein level (Fig. 2, I and K). The reduction of PPARγ2 protein level was much more profound than PPARγ1, which was expressed at a low level to begin with. A trend of reduction (not statistically significant) was observed for C/EBPβ but not for C/EBPδ and C/EBPα (Fig. 2I, quantification not shown). Consistent with attenuated adipogenic differentiation, FABP4 protein level was significantly reduced by CQ and HCQ but not by PQ (Fig. 2, I and K). When we measured the impacts of these drugs on autophagy markers, CQ and HCQ, but not PQ, significantly increased p62 and LC3-II/LC3-I ratio (Fig. 2, I and J), suggesting that only CQ and HCQ were effective in inhibiting autophagy. Additionally, treatment of differentiating 3T3-L1 preadipocytes with Baf (20 nM), which blocks autophagasome-lysosome fusion, achieved similar effects as treating the cells with CQ and HCQ, with significant attenuation of adipogenesis (Fig. 2L) and reduced PPARγ2 protein level (Fig. 2, M and N). These findings are consistent with the notion that pharmacological inhibition of the formation of autolysosome prevents adipogenic differentiation, possibly by reducing PPARγ2 and C/EBPβ protein levels in preadipocytes.
Genetic inhibition of autophagy prevents adipogenic differentiation with reduced PPARγ2 protein level.
We further employed genetic interventions to determine whether increased autophagy is required for adipogenic differentiation. We first employed RNA interference to reduce the expression of the Atg5 gene, an essential gene for autophagy (27). Infection of 3T3-L1 preadipocytes with two Atg5 shRNA lentiviruses (RNAi-1 and RNAi-2) significantly inhibited adipogenic differentiation (Fig. 3, A and B), concurrent with a reduced PPARγ2 protein level, with no significant impact on C/EBPβ protein level (Fig. 3C). FABP4 protein level was also significantly reduced by Atg5 knockdown. None of these effects was observed when these cells were infected with a nontargeting shRNA lentivirus (RNAi-N) or another Atg5 shRNA lentivirus (RNAi-3), which was not effective in knocking down Atg5 (Fig. 3C). These findings are consistent with the notion that the inhibition of adipogenic differentiation was due to reduced autophagy. To further confirm the essential function of Atg5, we isolated mouse embryonic fibroblasts (MEF) from Atg5−/− mice. Significant attenuation of adipogenic differentiation and reduction of PPARγ protein level were observed in Atg5−/− MEF but not in Atg5−/+ and wild-type MEF (Fig. 3, D–F). The deletion of the Atg5 gene (Fig. 3F, arrow) had no effect on C/EBPβ protein level. These results indicate that inhibition of autophagy prevents adipogenic differentiation along with reduced PPARγ2 protein level possibly through posttranscriptional regulation.
Fig. 3.
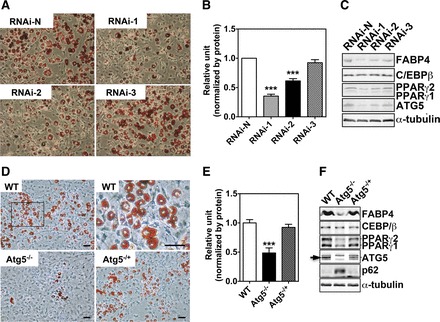
Genetic inhibition of autophagy prevents adipogenic differentiation. A: Oil Red O staining of 3T3-L1 adipocytes infected with nontarget shRNA or 1 of the 3 Atg5 shRNA lentiviruses. B: quantification of Oil Red O staining [n = 9/treatment; ***P < 0.01 vs. nontarget shRNA (RNAi-N)]. C: Western blot analysis of markers for adipogenic differentiation and transcription factors involved in adipogenic differentiation. D: Oil Red O staining of wild-type (WT), Atg5−/+, and Atg5−/− mouse embryonic fibroblasts (MEF). E: quantification of Oil Red O staining (n = 7–9/genotype; ***P < 0.001 vs. WT). F: Western blot analysis of markers for autophagy, adipogenic differentiation, and transcription factors involved in adipogenic differentiation. Please note that the band indicated by an arrow is Atg5, which is missing in Atg5−/− MEF. All images shown are representative of 3 independent experiments with triplicate samples. FABP4, fatty acid-binding protein 4.
Adipogenic differentiation enhances PPARγ2 protein stability possibly through autophagy-mediated repression of the proteasome-dependent protein degradation.
Based on the findings described above, we speculated that autophagy might control PPARγ2 protein stability. To test this, we measured PPARγ protein stability in proliferating and differentiating 3T3-L1 preadipocytes (24 h into differentiation) by treating the cells with protein synthesis inhibitor cycloheximide (CHX) and measuring PPARγ protein over time. We found that PPARγ2 protein degraded rapidly in proliferating preadipocytes but became stabilized in differentiating adipocytes, whereas PPARγ1 protein stayed relatively stable under both conditions (Fig. 4, A and B). PPARγ2 had a half-life of ∼1 h in proliferating preadipocytes and a half-life of >10 h in differentiating preadipocytes. These results indicate that adipogenic differentiation is associated with increased PPARγ2 protein stability.
Fig. 4.
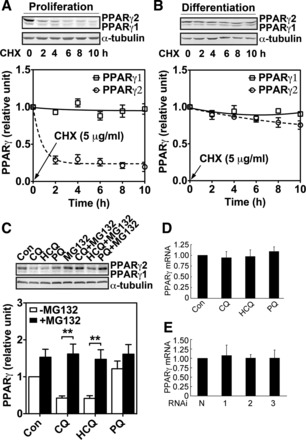
Adipogenic differentiation enhances PPARγ2 protein stability through autophagy-mediated repression of the proteasome-dependent protein degradation. A: Western blot analysis for PPARγ protein level following treatment with cycloheximide (CHX) for 0, 2, 4, 6, 8, and 10 h in proliferating 3T3-L1 preadipocytes. B: Western blot analysis for PPARγ protein level following treatment with CHX for 0, 2, 4, 6, 8, and 10 h in differentiating 3T3-L1 cells (24 h after initiation of differentiation). Since expression level of PPARγ protein in proliferating 3T3-L1 preadipocytes is significantly lower than that in differentiating cells, we overexposed the gel for the purpose of visualization and set the level before treatment as reference. C: Western blot analysis for PPARγ protein level in 3T3 preadipocytes during differentiation in the presence or absence of proteasome inhibitor MG132 with or without CQ, HCQ, and PQ (n = 9/treatment; **P < 0.01). All images shown are representative of 3 independent experiments with triplicate samples. D and E: semiquantitative PCR analysis for differentiating 3T3-L1 treated with or without (Con) 30 mM CQ, 30 mM HCQ, or 30 mM PQ for 24 h (D), followed by culturing in maintenance medium for 4 days (E). Semiquantitative PCR analysis for 3T3-L1 adipocytes infected with nontarget shRNA or one of the 3 Atg5 shRNA lentiviruses. PPARγ mRNA abundance was normalized to that of GAPDH. Data shown are the average of 3 independent experiments with triplicate samples.
We next asked whether autophagy might stabilize PPARγ2 protein. Considering the fact that PPARγ2 is degraded by the proteasome-dependent protein degradation (18, 22), we hypothesized that activation of autophagy inhibits this degradation process. To test this hypothesis, we treated differentiating 3T3-L1 preadipocytes with MG132, a proteasome inhibitor, for 2 h before exposing them to CQ or HCQ for 24 h. Consistent with our hypothesis, reduction of PPARγ2 protein level induced by inhibition of autophagy was completely prevented by MG132 (Fig. 4C), supporting the possibility that autophagy stabilizes PPARγ2 protein by interfering with the proteasome-dependent PPARγ protein degradation. The reduction of PPARγ, presumably PPARγ2, protein level by inhibition of autophagy did not occur at the transcriptional level since neither the drug treatments nor Atg5 knockdown altered PPARγ mRNA expression significantly (Fig. 4, D and E).
DISCUSSION
Obesity is a major risk factor for type 2 diabetes, cardiovascular disease, and cancer, and the prevalence of obesity is reaching a pandemic level worldwide (5, 10, 45). There is an urgent need for identifying the critical step(s) in the pathogenesis of obesity for developing effective interventions to curb the problem. Autophagy has recently been shown to be involved in lipid metabolism and adipogenesis (2, 37, 47), triggering great interests in elucidating the underlying mechanism and testing the feasibility of targeting autophagy for the prevention and treatment of obesity and related metabolic disorders. In this study, we have shown that systemic administration of CQ, an inhibitor of autophagy, is effective in preventing diet-induced obesity and its related metabolic consequences in mice and that autophagy may play an important role in the pathogenesis of obesity by regulating PPARγ2 protein stability during adipogenic differentiation.
The finding of prevention of diet-induced obesity and insulin resistance by CQ administration clearly justified further investigation of the functional role of autophagy in adipogenesis in vivo. Our finding that daily injection of CQ prevents diet-induced obesity and the onset of insulin resistance suggests the feasibility of targeting autophagy for the revention of obesity and related pathological conditions. The fact that high-fat-fed mice treated with CQ had similar food intake compared with saline-injected mice indicates that CQ treatment affects adiposity independent of calorie intake. We do not know the precise energetic mechanism by which CQ treatment leads not to reduced food intake but to reduced obesity. Potential mechanisms could be increased expenditure, reduced absorption, and/or increase discharge. Although the current results suggest that the attenuated whole body glucose intolerance and skeletal muscle insulin resistance are due to reduced obesity, a direct role of CQ in improving insulin sensitivity of peripheral tissues cannot be ruled out. Finally, CQ is not likely to specifically inhibit autophagy in adipose tissue; it may exert potent function in repressing autophagy in other metabolically important tissues such as liver and skeletal muscle. In fact, we have observed significant improvement of mitochondrial morphology by CQ injection compared with saline injection under the condition of high-fat diet. These findings suggest that either CQ injection leads to attenuation of the metabolic syndrome induced by high-fat diet, including reduced mitochondrial damage in the liver, or CQ injection has a direct positive impact on the liver with less accumulation of damaged mitochondria.
In a recent study, a low dose of CQ was used to treat apolipoprotein E−/− mice and resulted in reduced atherosclerosis and glucose intolerance in an ataxia telangiectasia mutated-dependent manner via the impact on JNK activity and lipoprotein lipase pathways in macrophages (36). They have also shown that CQ treatment is effective in reducing metabolic abnormalities in mice of genetic models of obesity, ob/ob and db/db mice (36). In light of these findings, we have provided independent confirmation in a model of diet-induced obesity and insulin resistance. These findings are in general consistent with previous findings of increased autophagy and autophagic flux in adipose tissues in obesity in humans and mice (21, 25, 33), except for one study in mice (46). Our findings in liver mitochondrial morphology are also consistent with a broad, positive impact of CQ in the whole animal model, and our findings in adipocytes in vitro by pharmacological and genetic interventions help improve our understanding of a mechanism by which inhibition of autophagy is a promosing target for prevention and treatment of obesity and metabolic disorders.
The significance of these findings is threefold. First, the findings provide novel mechanistic insights into the role of autophagy in adipogenesis. Previous studies with molecular genetic deletion have provided important clues regarding the functional role of autophagy in adipogenesis (2, 37, 47). Here, our studies provide information regarding the role of autophagy in the regulation of PPARγ2 protein stability during adipogenic differentiation. This improved understanding of the regulation of PPARγ expression will help to break the barriers that have hindered our ability to develop effective interventions. Second, our findings reveal a cross-talk between the ubiquitin-proteasome and the autophagy-lysosomal systems converging on PPARγ degradation, with a significant impact on adipogenic differentiation and the pathogenesis of obesity, although the precise mechanism of how these two systems cross-talk in this context remains to be defined. Finally, our findings provide proof-of-concept evidence that inhibition of autophagy is effective in preventing diet-induced obesity and insulin resistance in animals, although we cannot rule out the possibility that inhibition of autophagy improves insulin sensitivity under the condition of high-fat diet independent of its impact on adipogenesis.
It is well established that differentiation condition in vitro and high fat-diet feeding in vivo lead to increased PPARγ protein level (6, 43). More recent studies have revealed the importance of the regulation of ubiquitin-proteasome-mediated PPARγ protein degradation in adipogenesis (8, 22) in addition to the transcription of the gene. This degradation process appears to be linked to posttranslational modifications of PPARγ, such as phosphorylation and SUMOylation (7, 8). It has been postulated that PPARγ is degraded by the ubiquitin-proteasome system upon phosphorylation at serine residue 112 by the MEK/ERK pathway (8, 9, 20). Our findings in this study showed altered protein stability of PPARγ, specifically PPARγ2, depending on the status of cell proliferation/differentiation. These findings further demonstrate the importance of PPARγ protein stability in its biological function.
It is worthy of note that autophagy inhibition in this study selectively reduced PPARγ2 protein level and attenuated adipogenic differentiation. This is consistent with previous findings that PPARγ2 expression is adipose tissue specific (41, 42), whereas PPARγ1 is expressed at low levels in multiple tissues (42), and PPARγ2 also has greater potency than PPARγ1 in inducing adipogenesis (43). It raised an interesting question regarding how autophagy may selectively affect the degradation of PPARγ2. Since PPARγ2 differs structure-wise from PPARγ1 by only a 30-amino acid extension at the NH2 terminus, this NH2-terminal extension may contain signals that define the labile feature of PPARγ2 with autophagy dependency, which remains to be ascertained.
Interestingly, activation of PPARγ has been shown to stimulate autophagy (48). Therefore, it is possible that there is a feed-forward loop between activation of autophagy and PPARγ2 expression during adipogenic differentiation, which may be required for progression of adipogenesis. This may also explain why inhibition of autophagy exerts profound protection against adipogenesis in vitro and against obesity induced by high-fat diet in vivo.
The ubiquitin-proteasome-dependent and autophagy-lysosome-dependent protein degradation pathways have long been viewed as parallel, unrelated degradation systems. However, newly accumulated evidence suggests that there exist interactions or even cooperation between these two systems. This is particularly relevant in the degradations of neurodegenerative-related proteins (17, 30). Recent findings have implicated the functional importance of a cooperation between these two systems (24). Our findings provide an example of opposing roles of the ubiquitin-proteasome-dependent system and autophagy-lysosome-dependent system in regulating PPARγ2 stability. Specifically, our findings suggest that activation of autophagy during adipogenic differentiation leads to PPARγ2 stabilization. In other words, activation of autophagy appears to influence the ability of the ubiquitin-proteasome-dependent system to degrade PPARγ2. Although the precise action site of autophagy remains to be identified, we do not believe that this is a general action of autophagy to the proteasome degradation system, as inhibition of autophagy consistently resulted in reduced protein level of PPARγ2 but not other transcription factors that also function in adipogenic differentiation.
In summary, we have shown that adipogenic differentiation is associated with an activation of autophagy. Autophagy inhibitor treatment or genetic inhibition of autophagy potently reduces PPARγ2 protein stability and expression and blocks adipogenic differentiation. These findings reveal a novel mechanism by which the ubiquitin-proteasome-dependent system has a cross-talk with the autophagy-lysosome-dependent system in the regulation of PPARγ2 protein stability during adipogenic differentiation. We now propose a working model that, under basal or proliferating conditions, PPARγ2 protein is degraded by the ubiquitin-proteasome-dependent system. In response to adipogenic differentiation signal, the autophagy-lysosome-dependent system is activated, interfering with the proteasome-dependent PPARγ2 degradation, which stabilizes PPARγ2 protein and promotes adipogenic differentiation (Fig. 5). Our findings indicate that targeting this critical regulatory step is an effective intervention for the prevention of obesity and type 2 diabetic mice.
Fig. 5.
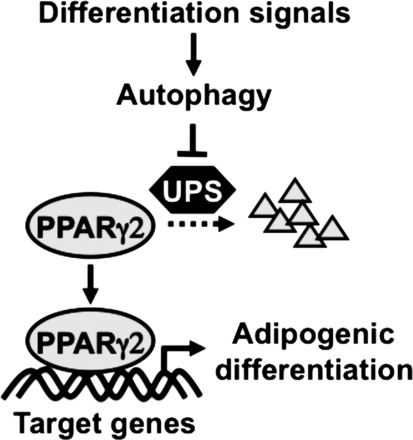
A working model for autophagy-mediated regulation of adipogenic differentiation through repression of ubiquitin-proteasome-dependent PPARγ2 protein degradation. Activation of autophagy by the differentiation signals represses PPARγ2 degradation by the ubiquitin-proteosome system (UPS) and promotes PPARγ target gene expression and adipogenic differentiation.
GRANTS
This study was in part supported by American Diabetes Association Basic Science Award 7-06-RA-165 to Z. Yan.
DISCLOSURES
No conflicts of interest, financial or otherwise, are declared by the authors.
AUTHOR CONTRIBUTIONS
C.Z., Y.H., P.C., S.Y., and Z.Y. contributed to the conception and design of the research; C.Z., Y.H., M.O., L.C.O., Y.J., L.Z., and M.Z. performed the experiments; C.Z., Y.H., M.O., L.C.O., Y.J., L.Z., P.C., S.Y., M.Z., and Z.Y. analyzed the data; C.Z., Y.H., M.O., P.C., S.Y., and Z.Y. interpreted the results of the experiments; C.Z. and Z.Y. prepared the figures; C.Z. and Z.Y. drafted the manuscript; C.Z., Y.H., and Z.Y. edited and revised the manuscript; Z.Y. approved the final version of the manuscript.
ACKNOWLEDGMENTS
We sincerely thank Dr. Noboru Mizushima (Tokyo Medical and Dental University) for the generous gift of Atg5 knockout mice, Dr. You Wen He (Duke University) for the arrangement of transfer of the mice, and Dr. Weiping Han (Singapore Imaging Consortium) for assisting in body composition analysis. We also thank Dr. Christopher B. Newgard (Duke University) for the careful review of the manuscript.
REFERENCES
- 1.Amaravadi RK, Yu D, Lum JJ, Bui T, Christophorou MA, Evan GI, Thomas-Tikhonenko A, Thompson CB. Autophagy inhibition enhances therapy-induced apoptosis in a Myc-induced model of lymphoma. J Clin Invest 117: 326–336, 2007. [DOI] [PMC free article] [PubMed] [Google Scholar]
- 2.Baerga R, Zhang Y, Chen PH, Goldman S, Jin S. Targeted deletion of autophagy-related 5 (atg5) impairs adipogenesis in a cellular model and in mice. Autophagy 5: 1118–1130, 2009. [DOI] [PMC free article] [PubMed] [Google Scholar]
- 3.Barak Y, Nelson MC, Ong ES, Jones YZ, Ruiz-Lozano P, Chien KR, Koder A, Evans RM. PPAR gamma is required for placental, cardiac, and adipose tissue development. Mol Cell 4: 585–595, 1999. [DOI] [PubMed] [Google Scholar]
- 4.Birsoy K, Chen Z, Friedman J. Transcriptional regulation of adipogenesis by KLF4. Cell Metab 7: 339–347, 2008. [DOI] [PMC free article] [PubMed] [Google Scholar]
- 5.Cameron AJ, Shaw JE, Zimmet PZ. The metabolic syndrome: prevalence in worldwide populations. Endocrinol Metab Clin North Am 33: 351–375, table of contents, 2004. [DOI] [PubMed] [Google Scholar]
- 6.Chawla A, Schwarz EJ, Dimaculangan DD, Lazar MA. Peroxisome proliferator-activated receptor (PPAR) gamma: adipose-predominant expression and induction early in adipocyte differentiation. Endocrinology 135: 798–800, 1994. [DOI] [PubMed] [Google Scholar]
- 7.Floyd ZE, Stephens JM. Control of peroxisome proliferator-activated receptor gamma2 stability and activity by SUMOylation. Obes Res 12: 921–928, 2004. [DOI] [PubMed] [Google Scholar]
- 8.Floyd ZE, Stephens JM. Interferon-gamma-mediated activation and ubiquitin-proteasome-dependent degradation of PPARgamma in adipocytes. J Biol Chem 277: 4062–4068, 2002. [DOI] [PubMed] [Google Scholar]
- 9.Font de Mora J, Porras A, Ahn N, Santos E. Mitogen-activated protein kinase activation is not necessary for, but antagonizes, 3T3-L1 adipocytic differentiation. Mol Cell Biol 17: 6068–6075, 1997. [DOI] [PMC free article] [PubMed] [Google Scholar]
- 10.Ford ES, Giles WH, Dietz WH. Prevalence of the metabolic syndrome among US adults: findings from the third National Health and Nutrition Examination Survey. JAMA 287: 356–359, 2002. [DOI] [PubMed] [Google Scholar]
- 11.Gonzalez FJ. Getting fat: two new players in molecular adipogenesis. Cell Metab 1: 85–86, 2005. [DOI] [PubMed] [Google Scholar]
- 12.González Sánchez JL, Serrano Ríos M, Fernández Perez C, Laakso M, Martínez Larrad MT. Effect of the Pro12Ala polymorphism of the peroxisome proliferator-activated receptor gamma-2 gene on adiposity, insulin sensitivity and lipid profile in the Spanish population. Eur J Endocrinol 147: 495–501, 2002. [DOI] [PubMed] [Google Scholar]
- 13.Goossens GH. The role of adipose tissue dysfunction in the pathogenesis of obesity-related insulin resistance. Physiol Behav 94: 206–218, 2008. [DOI] [PubMed] [Google Scholar]
- 14.Greenberg AS, Obin MS. Obesity and the role of adipose tissue in inflammation and metabolism. Am J Clin Nutr 83: 461S–465S, 2006. [DOI] [PubMed] [Google Scholar]
- 15.Gustavsson N, Lao Y, Maximov A, Chuang JC, Kostromina E, Repa JJ, Li C, Radda GK, Sudhof TC, Han W. Impaired insulin secretion and glucose intolerance in synaptotagmin-7 null mutant mice. Proc Natl Acad Sci USA 105: 3992–3997, 2008. [DOI] [PMC free article] [PubMed] [Google Scholar]
- 16.Hara K, Kubota N, Tobe K, Terauchi Y, Miki H, Komeda K, Tamemoto H, Yamauchi T, Hagura R, Ito C, Akanuma Y, Kadowaki T. The role of PPARgamma as a thrifty gene both in mice and humans. Br J Nutr 84, Suppl 2: S235–S239, 2000. [DOI] [PubMed] [Google Scholar]
- 17.Hara T, Nakamura K, Matsui M, Yamamoto A, Nakahara Y, Suzuki-Migishima R, Yokoyama M, Mishima K, Saito I, Okano H, Mizushima N. Suppression of basal autophagy in neural cells causes neurodegenerative disease in mice. Nature 441: 885–889, 2006. [DOI] [PubMed] [Google Scholar]
- 18.Hauser S, Adelmant G, Sarraf P, Wright HM, Mueller E, Spiegelman BM. Degradation of the peroxisome proliferator-activated receptor gamma is linked to ligand-dependent activation. J Biol Chem 275: 18527–18533, 2000. [DOI] [PubMed] [Google Scholar]
- 19.Hirsch J, Batchelor B. Adipose tissue cellularity in human obesity. Clin Endocrinol Metab 5: 299–311, 1976. [DOI] [PubMed] [Google Scholar]
- 20.Hu E, Kim JB, Sarraf P, Spiegelman BM. Inhibition of adipogenesis through MAP kinase-mediated phosphorylation of PPARgamma. Science 274: 2100–2103, 1996. [DOI] [PubMed] [Google Scholar]
- 21.Jansen HJ, van Essen P, Koenen T, Joosten LA, Netea MG, Tack CJ, Stienstra R. Autophagy activity is up-regulated in adipose tissue of obese individuals and modulates proinflammatory cytokine expression. Endocrinology 153: 5866–5874, 2012. [DOI] [PubMed] [Google Scholar]
- 22.Kilroy GE, Zhang X, Floyd ZE. PPAR-gamma AF-2 domain functions as a component of a ubiquitin-dependent degradation signal. Obesity (Silver Spring) 17: 665–673, 2009. [DOI] [PMC free article] [PubMed] [Google Scholar]
- 23.Koopman R, Schaart G, Hesselink M. Optimisation of oil red O staining permits combination with immunofluorescence and automated quantification of lipids. Histochem Cell Biol 116: 63–68, 2001. [DOI] [PubMed] [Google Scholar]
- 24.Korolchuk VI, Mansilla A, Menzies FM, Rubinsztein DC. Autophagy inhibition compromises degradation of ubiquitin-proteasome pathway substrates. Mol Cell 33: 517–527, 2009. [DOI] [PMC free article] [PubMed] [Google Scholar]
- 25.Kovsan J, Blüher M, Tarnovscki T, Klöting N, Kirshtein B, Madar L, Shai I, Golan R, Harman-Boehm I, Schön MR, Greenberg AS, Elazar Z, Bashan N, Rudich A. Altered autophagy in human adipose tissues in obesity. J Clin Endocrinol Metab 96: E268–E277, 2011. [DOI] [PubMed] [Google Scholar]
- 26.Kubota N, Terauchi Y, Miki H, Tamemoto H, Yamauchi T, Komeda K, Satoh S, Nakano R, Ishii C, Sugiyama T, Eto K, Tsubamoto Y, Okuno A, Murakami K, Sekihara H, Hasegawa G, Naito M, Toyoshima Y, Tanaka S, Shiota K, Kitamura T, Fujita T, Ezaki O, Aizawa S, Nagai R, Tobe K, Kimura S, Kadowaki T. PPAR gamma mediates high-fat diet-induced adipocyte hypertrophy and insulin resistance. Mol Cell 4: 597–609, 1999. [DOI] [PubMed] [Google Scholar]
- 27.Kuma A, Hatano M, Matsui M, Yamamoto A, Nakaya H, Yoshimori T, Ohsumi Y, Tokuhisa T, Mizushima N. The role of autophagy during the early neonatal starvation period. Nature 432: 1032–1036, 2004. [DOI] [PubMed] [Google Scholar]
- 28.Lane MD, Tang QQ. From multipotent stem cell to adipocyte. Birth Defects Res A Clin Mol Teratol 73: 476–477, 2005. [DOI] [PubMed] [Google Scholar]
- 29.Levine B, Yuan J. Autophagy in cell death: an innocent convict? J Clin Invest 115: 2679–2688, 2005. [DOI] [PMC free article] [PubMed] [Google Scholar]
- 30.Mizushima N, Hara T. Intracellular quality control by autophagy: how does autophagy prevent neurodegeneration? Autophagy 2: 302–304, 2006. [DOI] [PubMed] [Google Scholar]
- 31.Mizushima N, Levine B, Cuervo AM, Klionsky DJ. Autophagy fights disease through cellular self-digestion. Nature 451: 1069–1075, 2008. [DOI] [PMC free article] [PubMed] [Google Scholar]
- 32.Mizushima N, Yoshimori T. How to interpret LC3 immunoblotting. Autophagy 3: 542–545, 2007. [DOI] [PubMed] [Google Scholar]
- 33.Nuñez CE, Rodrigues VS, Gomes FS, de Moura RF, Victorio SC, Bombassaro B, Chaim EA, Pareja JC, Geloneze B, Velloso LA, Araujo EP. Defective regulation of adipose tissue autophagy in obesity. Int J Obes (Lond). In press. [DOI] [PubMed] [Google Scholar]
- 34.Paramsothy P, Knopp R, Bertoni AG, Tsai MY, Rue T, Heckbert SR. Combined hyperlipidemia in relation to race/ethnicity, obesity, and insulin resistance in the Multi-Ethnic Study of Atherosclerosis. Metabolism 58: 212–219, 2009. [DOI] [PMC free article] [PubMed] [Google Scholar]
- 35.Rosen ED, Sarraf P, Troy AE, Bradwin G, Moore K, Milstone DS, Spiegelman BM, Mortensen RM. PPAR gamma is required for the differentiation of adipose tissue in vivo and in vitro. Mol Cell 4: 611–617, 1999. [DOI] [PubMed] [Google Scholar]
- 36.Schneider JG, Finck BN, Ren J, Standley KN, Takagi M, Maclean KH, Bernal-Mizrachi C, Muslin AJ, Kastan MB, Semenkovich CF. ATM-dependent suppression of stress signaling reduces vascular disease in metabolic syndrome. Cell Metab 4: 377–389, 2006. [DOI] [PubMed] [Google Scholar]
- 37.Singh R, Kaushik S, Wang Y, Xiang Y, Novak I, Komatsu M, Tanaka K, Cuervo AM, Czaja MJ. Autophagy regulates lipid metabolism. Nature 458: 1131–1135, 2009. [DOI] [PMC free article] [PubMed] [Google Scholar]
- 38.Spalding KL, Arner E, Westermark PO, Bernard S, Buchholz BA, Bergmann O, Blomqvist L, Hoffstedt J, Naslund E, Britton T, Concha H, Hassan M, Ryden M, Frisen J, Arner P. Dynamics of fat cell turnover in humans. Nature 453: 783–787, 2008. [DOI] [PubMed] [Google Scholar]
- 39.Tang QQ, Otto TC, Lane MD. CCAAT/enhancer-binding protein beta is required for mitotic clonal expansion during adipogenesis. Proc Natl Acad Sci USA 100: 850–855, 2003. [DOI] [PMC free article] [PubMed] [Google Scholar]
- 40.Tassa A, Roux MP, Attaix D, Bechet DM. Class III phosphoinositide 3-kinase—Beclin1 complex mediates the amino acid-dependent regulation of autophagy in C2C12 myotubes. Biochem J 376: 577–586, 2003. [DOI] [PMC free article] [PubMed] [Google Scholar]
- 41.Tontonoz P, Graves RA, Budavari AI, Erdjument-Bromage H, Lui M, Hu E, Tempst P, Spiegelman BM. Adipocyte-specific transcription factor ARF6 is a heterodimeric complex of two nuclear hormone receptors, PPAR gamma and RXR alpha. Nucleic Acids Res 22: 5628–5634, 1994. [DOI] [PMC free article] [PubMed] [Google Scholar]
- 42.Tontonoz P, Hu E, Graves RA, Budavari AI, Spiegelman BM. mPPAR gamma 2: tissue-specific regulator of an adipocyte enhancer. Genes Dev 8: 1224–1234, 1994. [DOI] [PubMed] [Google Scholar]
- 43.Tontonoz P, Hu E, Spiegelman BM. Stimulation of adipogenesis in fibroblasts by PPAR gamma 2, a lipid-activated transcription factor. Cell 79: 1147–1156, 1994. [DOI] [PubMed] [Google Scholar]
- 44.Yan Z, Choi S, Liu X, Zhang M, Schageman JJ, Lee SY, Hart R, Lin L, Thurmond FA, Williams RS. Highly coordinated gene regulation in mouse skeletal muscle regeneration. J Biol Chem 278: 8826–8836, 2003. [DOI] [PubMed] [Google Scholar]
- 45.Yang W, Lu J, Weng J, Jia W, Ji L, Xiao J, Shan Z, Liu J, Tian H, Ji Q, Zhu D, Ge J, Lin L, Chen L, Guo X, Zhao Z, Li Q, Zhou Z, Shan G, He J; China National Diabetes and Metabolic Disorders Study Group. Prevalence of diabetes among men and women in China. N Engl J Med 362: 1090–1101, 2010. [DOI] [PubMed] [Google Scholar]
- 46.Yoshizaki T, Kusunoki C, Kondo M, Yasuda M, Kume S, Morino K, Sekine O, Ugi S, Uzu T, Nishio Y, Kashiwagi A, Maegawa H. Autophagy regulates inflammation in adipocytes. Biochem Biophys Res Commun 417: 352–357, 2012. [DOI] [PubMed] [Google Scholar]
- 47.Zhang Y, Goldman S, Baerga R, Zhao Y, Komatsu M, Jin S. Adipose-specific deletion of autophagy-related gene 7 (atg7) in mice reveals a role in adipogenesis. Proc Natl Acad Sci USA 106: 19860–19865, 2009. [DOI] [PMC free article] [PubMed] [Google Scholar]
- 48.Zhou J, Zhang W, Liang B, Casimiro MC, Whitaker-Menezes D, Wang M, Lisanti MP, Lanza-Jacoby S, Pestell RG, Wang C. PPARgamma activation induces autophagy in breast cancer cells. Int J Biochem Cell Biol 41: 2334–2342, 2009. [DOI] [PMC free article] [PubMed] [Google Scholar]