

Abstract
Obeticholic acid (OCA) is a semisynthetic bile acid (BA) analog and potent farnesoid X receptor agonist approved to treat cholestasis. We evaluated the biodistribution and metabolism of OCA administered to carbon tetrachloride‐induced cirrhotic rats. This was to ascertain if plasma and hepatic concentrations of OCA are potentially more harmful than those of endogenous BAs. After administration of OCA (30 mg/kg), we used liquid chromatography–mass spectrometry to measure OCA, its metabolites, and BAs at different timepoints in various organs and fluids. Plasma and hepatic concentrations of OCA and BAs were higher in cirrhotic rats than in controls. OCA and endogenous BAs had similar metabolic pathways in cirrhotic rats, although OCA hepatic and intestinal clearance were lower than in controls. BAs' qualitative and quantitative compositions were not modified by a single administration of OCA. In all the matrices studied, OCA concentrations were significantly lower than those of endogenous BAs, potentially much more cytotoxic.
Study Highlights
WHAT IS THE CURRENT KNOWLEDGE ON THE TOPIC?
✓ Obeticholic acid (OCA) is a potent farnesoid X receptor agonist, approved by the FDA and EMEA for treating PBC. However, it is not yet known whether it is safe in terms of serum and hepatic levels in liver impairment.
WHAT QUESTION DID THIS STUDY ADDRESS?
✓ This study evaluated whether OCA administration in liver disease leads to high levels of OCA in liver and serum, with possible damage to various organs. A single dose of 30 mg/kg was administered in a carbon‐tetrachloride‐induced (CCl4) cirrhosis rat model.
WHAT THIS STUDY ADDS TO OUR KNOWLEDGE
✓ In a rat model of cirrhosis, the metabolism of OCA was similar to that in healthy controls, and no toxic or unknown metabolites were found in the liver or intestine.
HOW THIS MIGHT CHANGE CLINICAL PHARMACOLOGY OR TRANSLATIONAL SCIENCE
✓ In cirrhosis, OCA plasma and hepatic concentrations are always lower than those of endogenous BAs. However, OCA has a longer residence time in cirrhosis than healthy conditions. Consequently, a potential OCA accumulation should be considered when planning dosage regimens for cirrhotic patients.
The liver has a network of nuclear‐receptor‐regulated pathways1 that coordinate the synthesis, hepatic uptake, and transport of bile acids (BAs), modulating BAs concentrations in the liver. The most relevant nuclear receptor is the farnesoid X receptor (FXR, NR1H4),2 which is agonistically controlled by BAs3 and which regulates a variety of target genes involved in controlling BAs, lipids, glucose, inflammation, and fibrosis.2, 4
FXR activation inhibits BA synthesis and protects against the toxic hepatic accumulation of BAs by regulating most of the BA hepatic transport proteins. It promotes detoxification of BAs via hydroxylation,5 sulfoconjugation,6 and glucuronidation.7
These mechanisms make FXR agonists a target for treating cholestatic liver diseases, such as primary biliary cholangitis (PBC), primary sclerosing cholangitis (PSC),1, 8 and nonalcoholic steatohepatitis (NASH).9, 10
OCA is a 6α‐ethyl derivative of chenodeoxycholic acid (CDCA), the natural FXR agonist BA in humans. OCA is a first‐in‐class selective FXR agonist, originally described for its anticholestatic and hepatoprotective properties.11 Addition of the 6‐ethyl group to CDCA confers an ∼100‐fold greater FXR agonistic activity.12
OCA has been successfully evaluated in clinical studies in PBC patients.13, 14 In addition, OCA enhances insulin sensitivity in patients with nonalcoholic fatty liver disease (NAFLD) and type 2 diabetes.15 It also reduces liver fibrosis in NASH patients.16 OCA was approved by the US Food and Drug Administration (FDA) for PBC treatment and is commercially available as OCALIVA (Intercept Pharmaceuticals, San Diego, CA). In healthy rats, OCA is metabolized in a similar manner to the structurally related CDCA but is more metabolically stable in terms of intestinal bacterial 7α‐dehydroxylation.17 To the best of our knowledge, there are little data on OCA metabolic profile and biodistribution in conditions of severe liver impairment.
The increased plasma concentration of BAs18 in liver disease is due to deficient liver uptake, impaired metabolism, defective bile secretion, dysbiosis in the gut microbiota,19 and a portosystemic shunt between the portal vascular system and systemic circulation. It is thus important to evaluate whether, due to its high detergency and lipophilicity, OCA occurs at high hepatic and serum levels in endstage liver disease. In particular, it is essential to assess OCA's metabolic profile in conditions of hepatic failure to determine if any uncommon and potentially toxic metabolites are formed to facilitate its excretion.
A theoretical pharmacokinetic model, previously applied to natural BAs, was recently applied to the distribution and enterohepatic recirculation of OCA. This model showed that moderate and severe hepatic impairment substantially increases the systemic exposure of OCA, but only marginally increases its hepatic concentration, suggesting that OCA plasma concentration is a marker for hepatic exposure.20 Since there are very few human studies providing data on changes to the hepatic metabolism and transport of OCA in cirrhotic liver, animal models of cirrhosis can be used as human disease counterparts.
Given that OCA is used to treat PBC, and considering the above safety issue, we report here on the metabolism and biodistribution of endogenous BAs and OCA after a single oral dose (30 mg/kg) in rats with carbon tetrachloride (CCl4)‐induced decompensated cirrhosis.21
We also studied the metabolism and biliary secretion of OCA in a bile fistula model in cirrhotic rats in the 3 h following intravenous infusion of OCA. This was to evaluate its net hepatic uptake, biotransformation, and secretion during cirrhosis progression.
The severity of CCl4‐induced cirrhosis was quantified by a total score resulting from liver histology, inflammation, and fibrosis, liver function parameters, ascites, and encephalopathy. Cirrhosis causes significant hepatic stress, with normal functional tissue replaced by scar tissue, which cannot maintain liver function. We therefore used immunohistochemistry to evaluate the disturbed localization of the canalicular and basolateral BA transporters in the cirrhotic liver.
METHODS
CCl4‐induced rat model of cirrhosis
The experiments were conducted in accordance with the UK Animals (Scientific Procedures) Act (1986) guidelines, the European Communities Council Directive (86/609/EEC),22 and National Institutes of Health Guide for the Care and Use of Laboratory Animals (NIH Publication No. 8023, revised 1978). The protocol was approved by the Ethics Committee of the University of Bologna, Protocol CES 25.57/80.
Decompensated liver cirrhosis was induced in male Wistar Han rats (Charles River Laboratories, Calco, Italy) (225–250 g) by inhalation of CCl4 for 13 weeks.23
Eighteen healthy and 18 cirrhotic rats were used for metabolism studies after a single OCA administration (30 mg/kg) by gavage; three cirrhotic rats were used without OCA administration; three healthy and nine cirrhotic rats were used for bile fistula model experiments after intravenous infusion of OCA (1 μmol/min/kg) for 1 h. For further details, see the Supplementary Information.
Decompensated cirrhosis score
The cirrhosis score was defined following parameters for histological activity and fibrosis, plasma and liver function, encephalopathy, and ascites scores. The final scores ranged from 0–30.
The liver necroinflammatory score, architectural changes, fibrosis, and cirrhosis were evaluated according to Ishak et al.,24 and Metavir25 (Supplementary Information).
Biodistribution of OCA and BA
Rats with decompensated cirrhosis were divided into seven groups (three rats each). Group 8 contained three healthy rat controls. Eight h after food withdrawal, OCA (Intercept Pharmaceuticals) suspended in 300 μl saline solution was administered by gavage (30 mg/kg).
Groups 1, 2, 3, 4, 5, and 6 were sacrificed at 1, 2, 4, 8, 24, and 48 h following OCA administration. OCA and endogenous BAs were measured in plasma, liver, kidneys, and the contents of small intestine and colon.
In Groups 5 and 6, rats were kept in metabolic cages for 24 h and 48 h. OCA was also measured in urine and stools for complete mass balance and biodistribution evaluation. The cirrhotic rats of Group 7 were placed in metabolic cages for 24 h without OCA administration. Group 8 comprised matched control healthy rats, receiving OCA with the same modalities.
After anesthesia (20 mg/kg Zoletil), blood was withdrawn in heparinized tubes. After sacrifice, liver, intestinal contents (small and large intestine), kidneys, stools, and urine were collected. We used high‐performance liquid chromatography electrospray tandem mass spectroscopy (HPLC‐ES‐MS/MS) to evaluate the qualitative and quantitative compositions of OCA and endogenous BAs.
Intravenous infusion of OCA in the bile fistula rat model
The study was performed on 12 rats: three healthy and nine cirrhotic rats (three rats/group) at 8, 10, and 13 weeks following CCl4 administration. In anesthetized rats, the bile duct was cannulated and OCA was intravenously infused at a dose of 1 μmol/min/kg over 1 h.17 Bile was collected every 15 min for 3 h. The concentrations of OCA and its metabolites in bile were measured. The bile flow was gravimetrically calculated and expressed as μL/min/kg, while the secretion rate was calculated from the bile volume and the BA concentration, and expressed as μmol/min/kg.
Bioanalytical procedures
Qualitative‐quantitative analysis of OCA, its metabolites, and endogenous BAs
We used an HPLC‐ES‐MS/MS method17 to quantify OCA, its conjugates with taurine (T‐OCA), glycine (G‐OCA), 3‐glucuronide conjugates (Glu‐OCA), and 3 oxo‐OCA. Endogenous BAs (cholic acid, muricholic acids, deoxycholic acid, chenodeoxycholic acid, ursodeoxycholic acid, litocholic acid, and their taurine conjugates) were quantified using the same method.
Samples were analyzed using an ALLIANCE 2695 HPLC (Waters, MA, USA) combined with a triple‐quadruple mass spectrometer QUATTRO‐LC (Micromass, Waters, Milford, MA) using an electrospray interface.17 Details are reported in the Supplementary Information.
Liver histology and transporter immunohistochemistry
Immunohistochemistry assays were performed to determine the location of the transport proteins within the hepatocytes and their lobular distribution in the context of control and cirrhotic tissues. The following were qualitatively analyzed (for cytoplasmic, membranous, canalicular positivity): P‐glycoprotein, the canalicular BA export pump (Bsep), the basolateral export transport systems (multidrug‐resistance‐associated proteins, mrp4), the organic solute transporters beta (Ost‐β), the ileal apical Na+‐dependent bile salt transporter (Asbt), and the Na+‐taurocholate cotransporting polypeptide (ntcp). Experimental details are reported in the Supplementary Information.
Statistical analysis
The quantitative data are presented as mean ± standard deviation (SD). A paired t‐test was used to assess specific differences between cirrhotic and healthy rats in the different matrices analyzed. The comparisons between healthy and cirrhosis groups in a specific organ/fluid were performed considering the total OCA concentrations or recoveries, intended as the sum of OCA and the quantified metabolites, at the same timepoints. The level of statistical significance was set at P < 0.10. The choice of this value as a cutoff can be considered reasonable when a small number of animals for each group is used and many biochemical data are collected.
RESULTS
Assessment and classification of decompensated liver cirrhosis
After 13 weeks of CCl4 inhalation, rats presented clinical signs of decompensated liver function. At sacrifice, the liver appearance was consistent with cirrhosis (weight ranging from 5.5–16.4 g). Enlarged spleens (0.9 ± 0.3 g in cirrhosis vs. 0.5 ± 0.2 g in controls) and ascites were always observed.
The CCl4‐treated groups showed extensive disruption of liver architecture, consistent with cirrhosis. The METAVIR score ranged from 3 to 4. Fibrosis ranged from 5 to 6 (4 in one case).
Plasma biochemical parameters and the biochemical score showed liver function impairment (total score ranging from 9 to 28, 0 for controls). For details, see the Supplementary Information.
The main BA transporters are reported in Figure 1. Bsep, Asbt, and Ost‐β showed similar cytoplasmic positivity in healthy and cirrhotic rat livers; in both groups cytoplasmic positivity for Bsep was weak (Figure 1a,b), Asbt was negative or weakly positive (c,d), and diffuse cytoplasmic positivity for Ost‐β was observed (g,h). Noticeable morphological differences were observed in the expression of Mrp4, Ntcp, and P‐glycoprotein. Mrp4 showed a perivascular positivity in normal livers (e) and scattered positive localization in hepatocytes in the periphery of regenerative nodules in cirrhosis (f). In controls, Ntcp showed a granular cytoplasmic positivity in the perivascular hepatocytes surrounding the centrilobular vein (i). In cirrhosis, this granular positivity was more diffuse, without a specific localization (j). P‐glycoprotein showed a very specific, continuous, and thin immunoreactivity along the canalicular facet of the control hepatocytes (k). In cirrhosis, the canalicular positivity was discontinuous, thicker, and rough, and a focal cytoplasmic positivity was observed (l).
Figure 1.
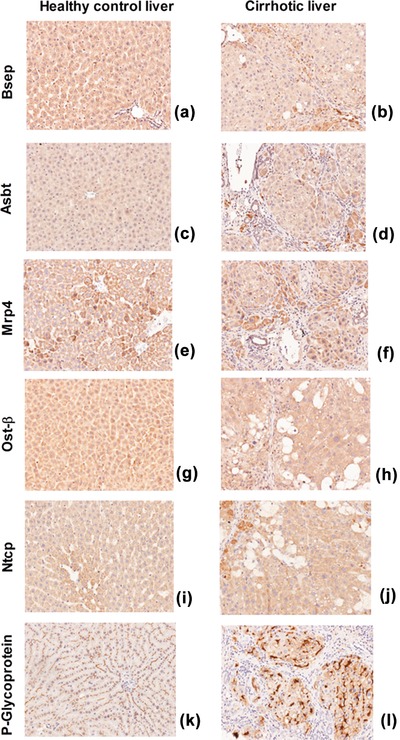
Immunohistochemistry of the studied transporters in control rats (left) and cirrhotic rats (right) (magnification 20x).
Concentrations of OCA, its metabolites, and endogenous BAs
Plasma
In cirrhosis, OCA and the main metabolite concentrations were significantly higher than in controls: mean maximum levels (28.3 ± 6.9 μmol/L) were reached 8 h after OCA administration (0.45 ± 0.07 μmol/L in controls) (P < 0.01). In cirrhosis, OCA was initially unconjugated. It then decreased with formation of T‐OCA and Glu‐OCA (Figure 2a). After 24 h, total OCA concentration was 5.1 ± 2.9 μmol/L, both free and taurine‐conjugated. After 24 h, OCA concentration in controls was significantly lower, 0.27 ± 0.04 μmol/L (P < 0.05), and mainly unconjugated (Figure 2b).
Figure 2.
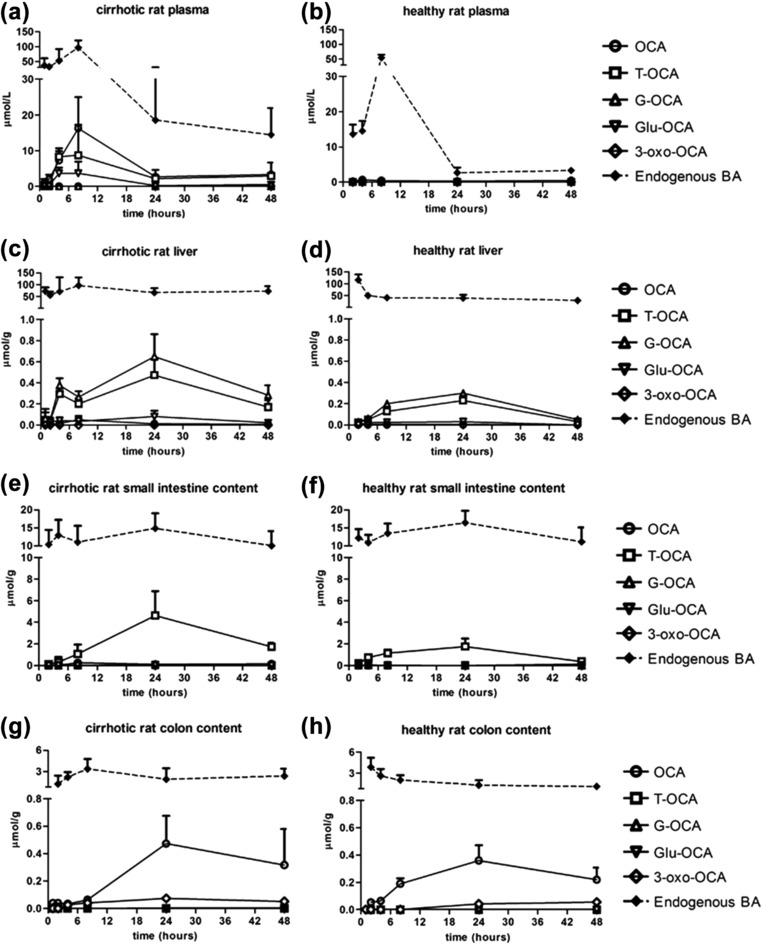
Concentrations (mean ± SD) of OCA, its metabolites, and endogenous BAs in different organs and fluids of cirrhotic and healthy rats, at different timepoints after a single oral administration of OCA (30 mg/kg). Significant differences (P < 0.10) of total concentration of OCA in plasma (after 8 h, 24 h, and 48 h) and liver (after 24 h and 48 h) between cirrhotic and healthy rats were found.
BA concentrations were higher than respective total OCA, in both cirrhotic and healthy rats. As a general trend, OCA and its metabolites concentrations were higher in rats with high endogenous BAs.
Liver
At 24 h after OCA administration, the mean hepatic total OCA concentration in cirrhotic rats was significantly higher (P < 0.10) than in controls (1.21 ± 0.43 vs. 0.56 ± 0.11 μmol/g, respectively) (Figure 2c,d). The maximum hepatic concentration in cirrhosis was reached after 24 h. However, it was still present after 48 h (0.47 ± 0.17 μmol/g), significantly higher than in controls (0.08 ± 0.02 μmol/g) (P < 0.05).
OCA was mostly conjugated with glycine (∼50%) and to a lower extent with taurine (∼30–40%). The maximum hepatic concentration of OCA in cirrhotic rats (1.2 μmol/g) was higher than in controls, but much lower than the total hepatic BAs.
Small intestine contents
At 1 h after administration, OCA was not present in the intestinal contents of either cirrhotic or control rats. It then increased progressively, reaching a maximum after 24 h (4.7 ± 2.4 in cirrhosis and 1.8 ± 0.7 μmol/g in controls) (Figure 2e,f), without significant differences between the groups (P = NS). T‐OCA was the predominant form, followed by free OCA, which increased progressively up to 8 h.
In the small intestine, the maximum BA concentration was always higher than the OCA concentration in both cirrhotic and healthy rats. BA maintained similar values, while OCA decreased over time.
Colon content
In cirrhosis, the OCA concentration in the colon increased over time, reaching a plateau after 24 h and decreasing at 48 h (0.55 ± 0.22 μmol/g and 0.37 ± 0.28 μmol/g, respectively) (Figure 2g). The OCA concentration in cirrhotic rats was similar to controls (P = NS) after both 24 h and 48 h (0.40 ± 0.10 μmol/g and 0.28 ± 0.06 μmol/g) (Figure 2h). OCA was mostly present in unmodified form, because the unabsorbed conjugated form in the small intestine underwent bacterial deconjugation. Moreover, the endogenous BAs were still higher than OCA in both groups.
Kidneys
OCA, its main metabolites, and BAs were present at very low concentrations in kidneys, at less than 0.001% of the administered dose in both cirrhotic and healthy rats (data not shown).
Biodistribution of OCA, its metabolites, and endogenous BAs in different organs
We assessed the biodistribution of OCA and endogenous BAs in different organs at 24 h and 48 h after OCA administration (Tables 1, 2, and Figure 3). We selected these timepoints because they can be reasonably considered the most relevant for a steady‐state organs biodistribution.
Table 1.
Percentage recovery of OCA and its main metabolites in the various organs and fluids 24 h and 48 h after administration (mean values ± SD)
| % Recovery after 24 h (mean ± SD) | ||||||||
|---|---|---|---|---|---|---|---|---|
| OCA | T‐OCA | G‐OCA | Glu‐OCA | 3‐oxo‐OCA | Total OCA | P‐value | ||
| Plasma | Cirrhosis | 0.12 ± 0.10 | 0.10 ± 0.07 | n.d. | n.d. | n.d. | 0.22 ± 0.15 | <0.10 |
| Healthy | 0.01 ± 0.01 | n.d. | n.d. | n.d. | n.d. | 0.01 ± 0.01 | ||
| Liver | Cirrhosis | 0.27 ± 0.10 | 14 ± 6 | 18 ± 4 | 1.6 ± 0.2 | n.d. | 34 ± 9.8 | NS |
| Healthy | 0.20 ± 0.10 | 9.0 ± 3.8 | 12 ± 4.3 | 1.3 ± 0.5 | n.d. | 22 ± 6.9 | ||
| Small intestine | Cirrhosis | 4.8 ± 3.9 | 28 ± 7 | 0.43 ± 0.33 | 0.10 ± 0.09 | n.d. | 33 ± 10.8 | NS |
| Healthy | 0.30 ± 0.2 | 48 ± 16 | n.d. | n.d. | n.d. | 48 ± 16 | ||
| Colon | Cirrhosis | 6.8 ± 1.4 | 0.06 ± 0.03 | 0.10 ± 0.04 | n.d. | 1.14 ± 0.81 | 8.1 ± 2.1 | NS |
| Healthy | 11 ± 5.1 | 0.13 ± 0.07 | 0.17 ± 0.05 | n.d. | 1.6 ± 0.05 | 13 ± 5.2 | ||
| Kidneys | Cirrhosis | n.d. | n.d. | n.d. | n.d. | n.d. | n.d. | n.c. |
| Healthy | n.d. | n.d. | n.d. | n.d. | n.d. | n.d. | ||
| Feces | Cirrhosis | 8.7 ± 2.6 | n.d. | n.d. | n.d. | 0.41 ± 0.33 | 9.1 ± 2.7 | <0.10 |
| Healthy | 2.3 ± 1.2 | n.d. | n.d. | n.d. | 0.13 ± 0.11 | 2.3 ± 1.2 | ||
| Urine | Cirrhosis | 0.03 ± 0.03 | 0.01 ± 0.01 | 0.01 ± 0.01 | 0.29 ± 0.21 | n.d. | 0.34 ± 0.22 | <0.10 |
| Healthy | n.d. | n.d. | n.d. | n.d. | n.d. | n.d. | ||
| % Recovery after 48 h (mean ± SD) | ||||||||
|---|---|---|---|---|---|---|---|---|
| OCA | T‐OCA | G‐OCA | Glu‐OCA | 3‐oxo‐OCA | Total OCA | P‐value | ||
| Plasma | Cirrhosis | 0.12 ± 0.10 | 0.14 ± 0.10 | n.d. | n.d. | n.d. | 0.26 ± 0.10 | <0.10 |
| Healthy | 0.01 ± 0.01 | n.d. | n.d. | n.d. | n.d. | 0.01 ± 0.01 | ||
| Liver | Cirrhosis | 0.25 ± 0.15 | 8.2 ± 2.6 | 13 ± 4 | 1.4 ± 0.07 | n.d. | 23 ± 6.1 | <0.10 |
| Healthy | 0.10 ± 0.10 | 1.6 ± 0.6 | 2.2 ± 1.3 | n.d. | n.d. | 3.9 ± 1.8 | ||
| Small intestine | Cirrhosis | 1.6 ± 1.5 | 25 ± 11 | 0.10 ± 0.10 | 1.1 ± 0.1 | n.d. | 28 ± 12 | <0.10 |
| Healthy | 3.0 ± 1.2 | 8.9 ± 2.1 | n.d. | 0.40 ± 0.20 | n.d. | 12 ± 3.0 | ||
| Colon | Cirrhosis | 6.8 ± 1.4 | 0.07 ± 0.01 | 0.15 ± 0.10 | n.d. | 1.2 ± 0.9 | 8.2 ± 2.1 | NS |
| Healthy | 4.0 ± 2.3 | 0.10 ± 0.05 | n.d. | n.d. | 1.3 ± 0.9 | 5.4 ± 1.9 | ||
| Kidneys | Cirrhosis | n.d. | n.d. | n.d. | n.d. | n.d. | n.d. | n.c. |
| Healthy | n.d. | n.d. | n.d. | n.d. | n.d. | n.d. | ||
| Feces | Cirrhosis | 38 ± 17 | n.d. | n.d. | n.d. | 1.1 ± 1.0 | 39.1 ± 16 | <0.10 |
| Healthy | 62 ± 15 | 0.70 ± 0.44 | n.d. | n.d. | 2.7 ± 1.2 | 65 ± 14 | ||
| Urine | Cirrhosis | n.d. | 0.04 ± 0.02 | 0.03 ± 0.02 | n.d. | n.d. | 0.07 ± 0.02 | <0.10 |
| Healthy | n.d. | n.d. | n.d. | n.d. | n.d. | n.d. | ||
P‐values refer to significant differences between cirrhotic and healthy rats in terms of total OCA recovery. Significant level set at P < 0.10. n.d., not detected; n.c., not calculated; NS, not significant.
Table 2.
Concentration of free, taurine‐conjugated, and total endogenous BAs 24 h and 48 h after administration of OCA in cirrhotic and control rats, expressed as μmol/L or μmol/g (mean values ± SD)
| Free endogenous BAs ± SD | |||||||
|---|---|---|---|---|---|---|---|
| Cirrhotic rats 24 h | Healthy rats 24 h | P‐value 24 h | Cirrhotic rats 48 h | Healthy rats 48 h | P‐value 48 h | Cirrhotic rats 24 h no OCA | |
| Plasma | 12.6 ± 7.1 | 0.9 ± 0.5 | <0.10 | 8.1 ± 5.2 | 2.4 ± 0.8 | NS | 17 ± 15 |
| Liver | 4.1 ± 2.8 | 3.8 ± 1.3 | NS | 6.1 ± 2.6 | 3.9 ± 1.8 | NS | 18 ± 16 |
| Small intestine | 1.5 ± 1.1 | 0.4 ± 0.3 | NS | 1.2 ± 0.4 | 4.4 ± 1.4 | <0.10 | 4.8 ± 4.1 |
| Colon | 1.9 ± 1.1 | 1.3 ± 0.6 | NS | 2.4 ± 0.9 | 1.1 ± 0.3 | <0.10 | 0.55 ± 0.32 |
| Feces | 1.3 ± 0.5 | 1.4 ± 0.3 | NS | 4.8 ± 2.1 | 1.5 ± 0.7 | <0.10 | 0.51 ± 0.12 |
| Urine | 3.4 ± 1.4 | 0.17 ± 0.08 | <0.10 | 4.2 ± 1.7 | 0.8 ± 0.3 | <0.10 | 4.2 ± 3.6 |
| Taurine‐conjugated endogenous BAs ± SD | |||||||
|---|---|---|---|---|---|---|---|
| Plasma | 5.3 ± 4.2 | 1.8 ± 1.1 | NS | 6.2 ± 2.2 | 0.8 ± 0.3 | <0.10 | 10 ± 5.3 |
| Liver | 54 ± 20 | 36 ± 14 | NS | 66 ± 27 | 26 ± 7.6 | <0.10 | 54 ± 20 |
| Small intestine | 13.3 ± 4.5 | 16 ± 8.3 | NS | 8.9 ± 3.3 | 6.8 ± 2.6 | NS | 0.50 ± 0.31 |
| Colon | n.d. | n.d. | n.c. | n.d. | n.d. | n.c. | n.d. |
| Feces | n.d. | n.d. | n.c. | n.d. | n.d. | n.c. | n.d. |
| Urine | 1.8 ± 1.1 | 0.07 ± 0.03 | <0.10 | 2.0 ± 0.6 | 2.1 ± 1.5 | NS | 1.4 ± 1.1 |
| Total endogenous BAs ± SD | |||||||
|---|---|---|---|---|---|---|---|
| Plasma | 18 ± 9.8 | 2.7 ± 1.2 | <0.10 | 14 ± 6.1 | 3.2 ± 0.7 | <0.10 | 27 ± 17 |
| Liver | 58 ± 17 | 40 ± 12 | NS | 72 ± 25 | 30 ± 6.5 | <0.10 | 72 ± 30 |
| Small intestine | 14.8 ± 3.6 | 16.4 ± 7.2 | NS | 10.1 ± 2.8 | 11.2 ± 3.1 | NS | 5.3 ± 4.1 |
| Colon | 1.9 ± 1.1 | 1.3 ± 0.6 | NS | 2.4 ± 0.9 | 1.1 ± 0.3 | <0.10 | 0.55 ± 0.32 |
| Feces | 1.3 ± 0.5 | 1.4 ± 0.3 | NS | 4.8 ± 2.8 | 1.5 ± 0.7 | NS | 0.51 ± 0.12 |
| Urine | 5.2 ± 2.5 | 0.24 ± 0.09 | <0.10 | 6.2 ± 2.2 | 2.9 ± 1.5 | <0.10 | 5.6 ± 4.1 |
P‐values refer to the comparison between cirrhotic and healthy rats. Significance level set at P < 0.10. n.d., not detected; n.c., not calculated; NS, not significant.
Figure 3.
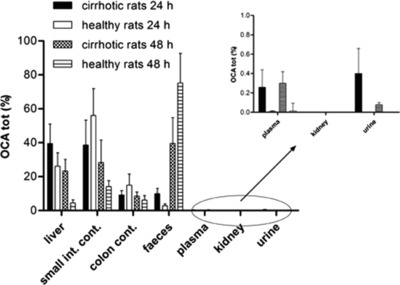
Percentage biodistribution (mean ± SD) of total OCA recovered at 24 h and 48 h after a single oral administration of OCA (30 mg/kg) in decompensated cirrhotic rats and healthy controls. There were significant differences (P < 0.10) between cirrhotic and healthy groups in plasma, stools, and urine (after 24 h and 48 h), and in liver (after 48 h).
Plasma
OCA and its metabolites reached higher concentrations in cirrhosis than controls. However, this represented only 0.3 ± 0.2% and 0.3 ± 0.3% of the recovered dose, at 24 h and 48 h, respectively, showing a lack of major compartmentalization in peripheral blood (Figure 3). These values are higher (P < 0.10) than controls (Table 1) and consistent with the different biodistribution of the endogenous BAs, as commonly observed in cholestasis. The total BA plasma concentration was significantly higher in cirrhotic rats than in controls (Table 2). Total BA concentrations were similar in cirrhosis treated with OCA and in untreated cirrhosis (P = NS).
Liver
Cirrhotic and healthy rats showed differences in the biodistribution of OCA and its metabolites. At 24 h after administration, there was no significant difference (P = NS) in the recovered OCA doses between cirrhotic and healthy rats (40 ± 12% and 26 ± 8%, respectively). However, 48 h after administration, significant differences (P < 0.01) were found (23 ± 7% in cirrhotic rats and 4 ± 2% in controls) (Figure 3). In cirrhotic rats, BAs were always higher than OCA with no significant difference at 24 h and 48 h after administration (P = NS) (Table 2).
Intestine
There was no significant difference (P = NS) between cirrhotic and controls rats in terms of OCA and metabolites recovery in small intestine and colon 24 h after administration. Here, they represented 48 ± 14% of the recovered dose in cirrhotic and 71 ± 20% in control rats (Figure 3). Similarly, 48 h after administration, comparable OCA amounts were recovered in intestinal contents of cirrhotic (37 ± 12%) and control rats (24 ± 6%) (P = NS).
Stools and urine
At 24 h after administration, total excretion of OCA in stools was relatively low in both cirrhotic and control rats (10 ± 3% and 3 ± 1% of the recovered dose, respectively) (Figure 3). This shows that OCA presents a relatively long biological half‐life. At 24 h after administration, excretion of OCA in stools was significantly higher in cirrhotic rats than in controls (P < 0.05). At 48 h, however, OCA was significantly lower in cirrhotic rats (40 ± 15%) than in controls (72 ± 17%, P < 0.10).
OCA urinary excretion was determined in cirrhotic rats only: the recovered dose at 24 h and 48 h after administration was 0.36 ± 0.17% and 0.08 ± 0.02%, respectively. In healthy rats, the OCA concentration in urine was under the limit of quantitation (LOQ).
At both 24 h and 48 h, fecal BAs were similarly present in unconjugated form in control and cirrhotic rats. No significant differences (P = NS) in stool excretion were observed between cirrhotic and control rats (Table 2). There were higher urinary concentrations of free and tauro‐conjugated BAs in cirrhotic rats than in control rats (P < 0.10) (Table 2).
Total OCA recoveries at 24 h and 48 h were 85 ± 12% and 98 ± 15% in cirrhotic rats, respectively, and 86 ± 14% and 87 ± 16% in controls (Table 1). This means that OCA was not metabolized into uncommon or unidentified compounds, and was almost entirely recovered in the expected organs and fluids.
In addition, 24 h and 48 h after administration of OCA there were no differences in the distribution of BAs in the various tissues. The main differences were found between cirrhotic and healthy rats, but these differences were not influenced by administration of OCA.
OCA and endogenous BA composition
In both cirrhotic and control rats, T‐OCA was the main OCA metabolite recovered in the different organs. Other minor metabolites were also formed, including the glycine conjugate (limited to the liver), the 3‐glucuronide, and the 3‐oxo metabolite (limited to the colon).
After OCA administration, glycine conjugation was activated after endogenous hepatic taurine pool depletion.23 G‐OCA was present exclusively in the liver but not in plasma, while the 3‐glucuronide and the 3‐oxo derivatives were mainly present in the intestinal contents and in stools. Taurine conjugation predominated in the liver and small intestine.
Hepatic metabolism and biliary secretion of OCA in the bile fistula rat model
OCA was administered by intravenous infusion to cirrhotic rats (after 8, 10, and 13 weeks of CCl4 inhalation). Using this model, we evaluated the hepatic uptake, transport, and secretion of OCA into bile, independently of portosystemic shunt.
After 13 weeks of CCl4‐induced liver damage, bile flow had significantly and progressively decreased from 60 ± 6 μL/min/kg (in healthy animals) to less than 20 ± 2 μL/min/kg (P < 0.01) (Figure 4). Similarly, between week 8 and week 13 of CCl4 exposure, biliary secretion of OCA (entirely as T‐OCA) progressively decreased. The maximum secretion rate of OCA in control rats decreased from 0.80 ± 0.10 μmol/min/kg, to 0.40 ± 0.05, 0.20 ± 0.03, and then to less than 0.05 ± 0.01 μmol/min/kg as cirrhosis progressed (Figure 5) (P < 0.01). Similarly, endogenous BA secretion decreased as cirrhosis progressed, as outlined in Figure 5, which reports the data for TCA and TmuCA, the most representative endogenous BAs of the bile composition. The hepatic clearance of OCA and BAs thus decreases as cirrhosis progresses.
Figure 4.
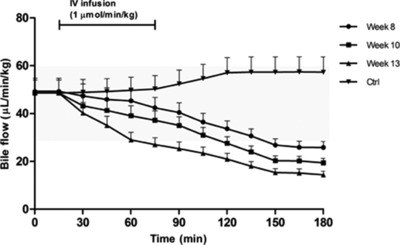
Bile flow during femoral infusion of OCA at a dose of 1 μmol/min/kg for 1 hour in rats after 0 (control, Ctrl), 8, 10, and 13 weeks of CCl4 inhalation. Bile was collected every 15 min for 3 h. The bile flow is expressed as μL/min/kg (mean ± SD). The gray area represents the normal range of bile flow variation. Significant differences (P < 0.10) in terms of bile flow were observed between controls and cirrhotic rats at different stages of disease.
Figure 5.
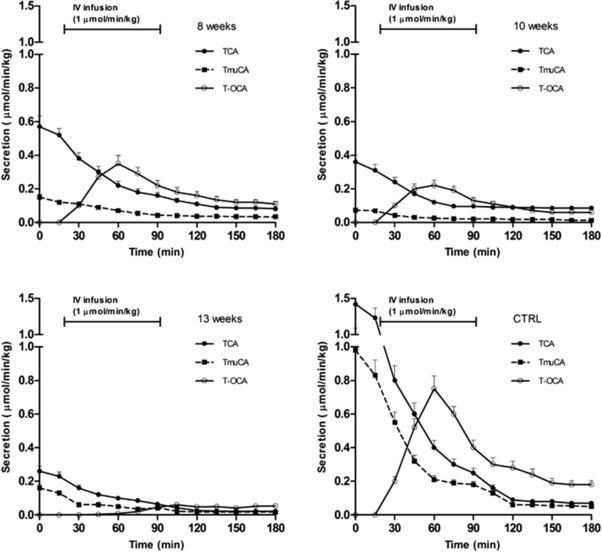
Secretion rates during femoral infusion of OCA at a dose of 1 μmol/min/kg for 1 h after 0 (control, CTRL), 8, 10, and 13 weeks of CCl4 inhalation. Bile was collected every 15 min for 3 h. The secretion rate is expressed as μmol/min/kg (mean ± SD). Significant differences (P < 0.10) in terms of secretion rate of OCA and BA were observed between controls and cirrhotic rats at different stages of disease.
DISCUSSION
In decompensated cirrhosis, OCA metabolism and biodistribution in liver, plasma, and intestine are similar to endogenous BAs.
There was no formation of unexpected phase 1 or 2 hepatic metabolites of OCA, suggesting a lack of hepatotoxicity, even when OCA is present at higher liver concentrations compared with controls. OCA is efficiently conjugated with taurine and glycine and promptly secreted into bile. The maximum concentration of OCA in the liver of cirrhotic rats was about two times higher than in controls. However, the total hepatic concentration of endogenous BAs was at least 100 times (50–80 μmol/g) higher. In particular, the liver concentration of endogenous BAs in cirrhotic rats was about two times higher than in healthy rats. This result is in agreement with Fischer et al.,26 who showed that hepatic concentration of BAs in cirrhosis is about 1.8 times higher than in healthy subjects.
Therefore, after a single oral administration of 30 mg/kg, the OCA concentration in the liver reflects the altered biodistribution of BAs in decompensated cirrhosis, as recently reported.20 OCA is always present at significantly lower concentrations than BAs, which are potentially much more cytotoxic.
OCA is almost completely recovered (85% after 24 h, and 98% after 48 h), showing that it does not remain in nontarget tissues, with potential undesirable effects.
Two points have been clarified by the results of the bile fistula rat experiments following intravenous infusion of OCA. First, as liver damage increases, there is a progressive decrease in biliary flow and biliary secretion of OCA and BAs. This is independent of portal hypertension. This decrease can partially be explained by the altered hepatocellular and lobular localization of import and export proteins. Second, the biliary excretion for OCA and BAs becomes less effective with disease progression.
In cirrhotic rats, endogenous BA were present in plasma, both free and conjugated with taurine. Free BA concentration was considerably higher in cirrhotic rats, which is due to bacterial translocation and portosystemic shunt.
In normal rats, OCA is metabolized in a similar way to CDCA in terms of hepatic uptake, metabolism, transport, secretion, and intestinal absorption.17 In order to be secreted into bile, OCA requires taurine conjugation in rats or glycine/taurine in humans. This is due to its moderate lipophilicity. In decompensated cirrhosis, OCA is still efficiently metabolized to more hydrophilic T‐OCA, G‐OCA, and Glu‐OCA, and excreted into bile. The possible mechanism for increased glycine conjugation in the liver is uncommon for the rat and is particularly interesting. Taurine conjugation depends on the balance of amino acids and the free taurine content in the liver. When the OCA concentration exceeds taurine bioavailability, glycine conjugation occurs. After administration, the large amount of OCA reaching the liver is conjugated, first with taurine and then with glycine, in order to be secreted into bile. In the intestine, T‐OCA and G‐OCA are deconjugated by intestinal bacteria and OCA is passively reabsorbed. There is then less recycling of OCA to the liver, with taurine synthesis supporting its concentration in the liver. This affords a more efficient taurine conjugation over time.
OCA reaches the hepatocytes via the portal vein by intestinal passive absorption, sharing hepatic uptake systems with BAs. At 24 h and 48 h after administration, OCA biodistribution is similar to BAs'. This accounts for the similar pharmacokinetics, without any difference in metabolic pathways (except for the lack of 7α‐dehydroxylation), leading to higher conservation of the OCA pool.
OCA biodistribution is in agreement with a report about the absorption, distribution, metabolism, and excretion of OCA in healthy and cirrhotic patients.20 This report applied a theoretical pharmacokinetic model for CDCA27 to OCA. In healthy volunteers, 90% of total OCA mass was found in the gut and the gallbladder, 8% in the liver, and 1% in the systemic circulation. Similarly, in subjects with Child–Pugh C hepatic impairment, 79% of the total OCA mass was found in the gut and the gallbladder, 10% in the liver, and 10% in the systemic circulation. Therefore, exposure of OCA in the cirrhotic liver was only marginally increased with respect to controls.
In cholestasis,28 uptake and efflux transporters adapt their response to reduce the intracellular concentration of BAs and protect against further injury. However, there is no information about endstage liver disease. In decompensated cirrhosis, changes were observed for Ntcp and Mrp4, which lost a specific granular localization at the perivascular hepatocytes surrounding the centrilobular vein. P‐glycoprotein, the canalicular export pump, lost its typical continuous and thin immunoreactivity along the canalicular facet of control liver hepatocytes. It showed a discontinuous canalicular positivity and focal cytoplasmic positivity. Therefore, in endstage cirrhosis, there is altered localization of import transporters at the basolateral membrane, and of export transporters at the sinusoidal membrane of hepatocytes. This perpetuates the disease29, 30 and does not protect the liver from the toxic effects of BA accumulation.31
These results show the potential therapeutic role of FXR agonists. FXR activation reduces the intracellular load of BAs in target tissues by repressing BA import transporters, inducing BA export pumps, and suppressing BA synthesis.32 OCA, and its taurine and glycine conjugates, can activate FXR33 signaling to inhibit BA import transporters and induce BA export pumps. These metabolites and OCA bind FXR with a similar affinity because they share the same 6α‐ethyl group moiety.
The acute administration of OCA is not sufficient to evaluate the FXR agonistic effect of OCA in terms of depression of BA synthesis, modification of the endogenous BA pool, and activation/depression of BA transport proteins.
In conclusion, OCA and endogenous BAs share a similar metabolism and biodistribution in both normal and liver disease conditions. In cirrhotic rats, a single‐dose administration of OCA did not alter the qualitative or quantitative compositions of BAs or their biliary secretion. The biliary secretion of BAs and OCA progressively decrease as liver damage and loss of hepatic architecture progress. OCA presents a longer residence time in the cirrhotic liver compared with healthy rats, suggesting that clinicians should carefully consider the potential accumulation of OCA.
Supporting information
Table S1. Liver histology score according to Ishak. Staging: architectural changes, fibrosis and cirrhosis.
Table S2. Staging: architectural changes, fibrosis and cirrhosis.
Table S3. Fibrosis score and comparison between Ishak and Metavir.
Table S4. Histologic score for activity and fibrosis according to Ishak and METAVIR.
Table S5. Plasma biochemical parameters for the cirrhotic rats (groups 1–7) at sacrifice.
Table S6. Plasma biochemical score for the cirrhotic rats (groups 1–7) at sacrifice.
Table S7. Total score in decompensated cirrhotic rats during the pharmacokinetics study. The scores (ranging from 0 to 30) included the histological parameters, biochemical plasma parameters, ascites and encephalopathy at sacrifice.
Acknowledgments
The authors thank Grace Fox for editing and proofreading the article, and Intercept Pharmaceuticals for supplying OCA.
Author Contributions
A.R., R.A., and L.A. wrote the article; A.R., R.A., and L.A. designed the research; S.S., C.C., P.F., M.C., A.D., F.V., A.D., and L.M. performed the research; A.R., R.A., L.A., S.S., C.C., P.F., M.C., A.D., F.V., A.D., and L.M. analyzed the data.
Conflict of Interest
Dr Adorini reports personal fees from Intercept Pharmaceuticals, unrelated to the submitted work. The other authors have nothing to disclose.
References
- 1. Halilbasic, E. , Claudel, T. & Trauner, M. Bile acid transporters and regulatory nuclear receptors in the liver and beyond. J. Hepatol. 58, 155–168 (2013). [DOI] [PMC free article] [PubMed] [Google Scholar]
- 2. Lefebvre, P. , Cariou, B. , Lien, F. , Kuipers, F. & Staels, B. Role of bile acids and bile acid receptors in metabolic regulation. Physiol. Rev. 89, 147–191 (2009). [DOI] [PubMed] [Google Scholar]
- 3. Trauner, M. & Halilbasic, E. Nuclear receptors as new perspective for the management of liver diseases. Gastroenterology. 140, 1120–1125 (2011). [DOI] [PubMed] [Google Scholar]
- 4. Modica, S. , Gadaleta, R.M. & Moschetta, A. Deciphering the nuclear bile acid receptor FXR paradigm. Nucl. Receptor Signal 8, 1–28 (2010). [DOI] [PMC free article] [PubMed] [Google Scholar]
- 5. Gnerre, C. , Blättler, S. , Kaufmann, M.R. , Looser, R. & Meyer, U.A. Regulation of CYP3A4 by the bile acid receptor FXR: evidence for functional binding sites in the CYP3A4 gene. Pharmacogenetics 14, 635–645 (2004). [DOI] [PubMed] [Google Scholar]
- 6. Song W.C. Biochemistry and reproductive endocrinology of estrogen sulfotransferase. Ann. N. Y. Acad. Sci. 948, 43–50 (2001). [DOI] [PubMed] [Google Scholar]
- 7. Barbier, O. et al FXR induces the UGT2B4 enzyme in hepatocytes: a potential mechanism of negative feedback control of FXR activity. Gastroenterology 124, 1926–1940 (2003). [DOI] [PubMed] [Google Scholar]
- 8. Zollner, G. , Wagner, M. & Trauner, M. Nuclear receptors as drug targets in cholestasis and drug‐induced hepatotoxicity. Pharmacol. Ther. 126, 228–243 (2010). [DOI] [PubMed] [Google Scholar]
- 9. Adorini, L. , Pruzanski, M. & Shapiro, D. Farnesoid X receptor targeting to treat nonalcoholic steatohepatitis. Drug Discov. 17, 988–997 (2012). [DOI] [PubMed] [Google Scholar]
- 10. Fuchs, M. Non‐alcoholic fatty liver disease: the bile acid‐activated farnesoid X receptor as an emerging treatment target. J. Lipids 2012, 1–8 (2012). [DOI] [PMC free article] [PubMed] [Google Scholar]
- 11. Pellicciari, R. et al 6α‐Ethyl‐chenodeoxycholic acid (6‐ECDCA), a potent and selective FXR agonist endowed with anticholestatic activity. J. Med. Chem. 45, 3569–3572 (2002). [DOI] [PubMed] [Google Scholar]
- 12. Pellicciari, R. et al Bile acid derivatives as ligands of the farnesoid X receptor. Synthesis, evaluation, and structure‐activity relationship of a series of body and side chain modified analogs of chenodeoxycholic acid. J. Med. Chem. 47, 4559–4569 (2004). [DOI] [PubMed] [Google Scholar]
- 13. Hirschfield, G.M. et al Efficacy of obeticholic acid in patients with primary biliary cirrhosis and inadequate response to ursodeoxycholic acid. Gastroenterology 148, 751–761 (2015). [DOI] [PubMed] [Google Scholar]
- 14. Nevens, F. et al A placebo‐controlled trial of obeticholic acid in primary biliary cholangitis. N. Engl. J. Med. 375, 631–643 (2016). [DOI] [PubMed] [Google Scholar]
- 15. Mudaliar, S. et al Efficacy and safety of the farnesoid X receptor agonist obeticholic acid in patients with type 2 diabetes and nonalcoholic fatty liver disease. Gastroenterology 145, 574–582 (2013). [DOI] [PubMed] [Google Scholar]
- 16. Neuschwander‐Tetri B.A. et al Farnesoid X nuclear receptor ligand obeticholic acid for non‐cirrhotic, non‐alcoholic steatohepatitis (FLINT): a multicentre, randomised, placebo‐controlled trial. Lancet 385, 956–965 (2015). [DOI] [PMC free article] [PubMed] [Google Scholar]
- 17. Roda, A. et al Semisynthetic bile acid FXR and TGR5 agonists: physicochemical properties, pharmacokinetics, and metabolism in the rat. J. Pharmacol. Exp. Ther. 350, 56–68 (2014). [DOI] [PubMed] [Google Scholar]
- 18. Mannes, M.D. et al Prognostic significance of serum bile acids in cirrhosis. Hepatology. 6, 50–53 (1986). [DOI] [PubMed] [Google Scholar]
- 19. Usami, M. , Miyoshi, M. & Yamashita, H. Gut microbiota and host metabolism in liver cirrhosis. World J. Gastroenterol. 21, 11597–11608 (2015). [DOI] [PMC free article] [PubMed] [Google Scholar]
- 20. Edwards, J.E. et al Modeling and experimental studies of obeticholic acid exposure and the impact of cirrhosis stage. Clin.Transl. Sci. 9, 328–336 (2016). [DOI] [PMC free article] [PubMed] [Google Scholar]
- 21. Domenicali, M. et al A novel model of CCl4‐induced cirrhosis with ascites in the mouse. J. Hepatol. 5, 1991–1999 (2009). [DOI] [PubMed] [Google Scholar]
- 22. Kilkenny, C. , Browne, W. , Cuthill, I.C. , Emerson, M. & Altman, D.G. National Centre for the Replacement, Refinement and Reduction of Animals in Research. Animal research: reporting in vivo experiments—the ARRIVE guidelines. J. Cereb. Blood Flow Metab. 31, 991–993 (2011). [DOI] [PMC free article] [PubMed] [Google Scholar]
- 23. Jiménez, W. , Clària, J. , Arroyo, V. & Rodés, J. Carbon tetrachloride induced cirrhosis in rats: a useful tool for investigating the pathogenesis of ascites in chronic liver disease. J. Gastroenterol. Hepatol. 7, 90–97 (1992). [DOI] [PubMed] [Google Scholar]
- 24. Ishak, K. et al Histological grading and staging of chronic hepatitis. J. Hepatol. 22, 696–699 (1995). [DOI] [PubMed] [Google Scholar]
- 25. Shiha, G. & Zalata, K. Ishak Versus METAVIR: Terminology, Convertibility and Correlation with Laboratory Changes in Chronic Hepatitis C 1st edn (INTECH, Croatia, 2011). [Google Scholar]
- 26. Fischer, S. , Beuers, U. , Spengler, U. , Zwiebel, F.M. , & Koebe, H.G. Hepatic levels of bile acids in end‐stage chronic cholestatic liver disease. ClinicaChimicaActa 251, 173–186 (1996). [DOI] [PubMed] [Google Scholar]
- 27. Molino, G. , Hofmann, A.F. , Cravetto, C. , Belforte, G. & Bona, B. Simulation of the metabolism and enterohepatic circulation of endogenous chenodeoxycholic acid in man using a physiological pharmacokinetic model. Eur. J. Clin. Invest. 16, 397–414 (1986). [DOI] [PubMed] [Google Scholar]
- 28. Slitt, A.L. et al Regulation of transporter expression in mouse liver, kidney, and intestine during extrahepatic cholestasis. Biochim. Biophys. Acta Biomembranes. 1768, 637–647 (2007). [DOI] [PubMed] [Google Scholar]
- 29. Kojima, H. et al Changes in the expression and localization of hepatocellular transporters and radixin in primary biliary cirrhosis. J. Hepatol. 39, 693–702 (2003). [DOI] [PubMed] [Google Scholar]
- 30. Kojima, H. et al Disturbed colocalization of multidrug resistance protein 2 and radixin in human cholestatic liver diseases. J. Gastroenterol. Hepatol. 23, 120–128 (2008). [DOI] [PubMed] [Google Scholar]
- 31. Wagner, M. , Zollner, G. & Trauner, M. New molecular insights into the mechanisms of cholestasis. J. Hepatol. 51, 565–580 (2009). [DOI] [PubMed] [Google Scholar]
- 32. Wagner, M. & Trauner, M. Recent advances in understanding and managing cholestasis. F1000 Res. 5, 1–10 (2016). [DOI] [PMC free article] [PubMed] [Google Scholar]
- 33. Pellicciari, R. , Fiorucci, S. & Pruzanski, M. Bile acid derivatives as FXR ligands for the prevention or treatment of FXR‐mediated diseases or conditions. U.S. Patent No. 7,858,608, (2010).
Associated Data
This section collects any data citations, data availability statements, or supplementary materials included in this article.
Supplementary Materials
Table S1. Liver histology score according to Ishak. Staging: architectural changes, fibrosis and cirrhosis.
Table S2. Staging: architectural changes, fibrosis and cirrhosis.
Table S3. Fibrosis score and comparison between Ishak and Metavir.
Table S4. Histologic score for activity and fibrosis according to Ishak and METAVIR.
Table S5. Plasma biochemical parameters for the cirrhotic rats (groups 1–7) at sacrifice.
Table S6. Plasma biochemical score for the cirrhotic rats (groups 1–7) at sacrifice.
Table S7. Total score in decompensated cirrhotic rats during the pharmacokinetics study. The scores (ranging from 0 to 30) included the histological parameters, biochemical plasma parameters, ascites and encephalopathy at sacrifice.