

Abstract
The aim of this study was to evaluate the curves of cardiorespiratory variables during cardiopulmonary exercise testing (CPET) in soccer players who had acute alterations in the glomerular filtration rate (GFR) after performing the pre-season training protocol. Sixteen male professional soccer players (25 ± 3 years; 179 ± 2 cm; and 77 ± 6 kg) were evaluated for oxygen uptake (VO2), heart rate (HR) and pulse relative oxygen (relative O2 Pulse) curves with intervals corresponding to 10% of the total duration of CPET. Athletes were grouped according to the GFR and classified as decreased GFR (dGFR; n = 8) and normal GFR (nGFR; n = 8). Athletes from the dGFR group exhibited lower VO2 values (p < 0.05) when 90% (dGFR 49.8 ± 4.0 vs. nGFR 54.4 ± 6.1 ml·kg-1·min-1) and 100% (dGFR 52.6 ± 4.1 vs. nGFR 57.4 ± 5.9 ml·kg-1·min-1) of the test was complete; HR high values (p < 0.05) when 90% (dGFR 183.7 ± 5.1 vs. nGFR 176.6 ± 4.8 bpm-1) and 100% (dGFR 188.1 ± 5.0 vs. nGFR 180.8 ± 4.8 bpm-1) of the test was complete; and lower relative O2 Pulse values (p < 0.05) when 70% (dGFR 25.6 ± 8.4 vs. nGFR 27.9 ± 9.7 ml·beat-1·kg-1), 80% (dGFR 26.6 ± 8.8 vs. nGFR 29.1 ± 10.0 ml·beat-1·kg-1), 90% (dGFR 27.1 ± 9.0 vs. nGFR 30.8 ± 10.6 ml·beat-1·kg-1) and 100% (dGFR 28 ± 9.2 vs. nGFR 31.8 ± 10.9 ml·beat-1·kg-1) of the test was complete. A correlation was found (r = −0.66, R2 = 0.44, p = 0.00) between lower VO2 peak and elevated levels of urinary protein excretion. In conclusion, soccer players with reduced kidney function after performing the pre-season training protocol also presented alterations in cardiopulmonary variables. We suggest that monitoring of renal function may be used to identify less conditioned soccer players.
Key words: kidney, glomerular filtration rate, athletes, exercise test, treadmill
Introduction
Physical training involves all the planning of overload handling and rest that must be applied to the athlete. The stimulus-rest interaction is an important component inserted in planning of soccer training for the athlete to reach the best technical/physical performance during the entire season. However, this component can be influenced by several factors that are often empirically controlled by experience and perception of each multidisciplinary team professional involved (Urhausen et al., 1995). The prescription and monitoring of physical training and all its intervening variables are extremely important so that the athlete does not enter the state of subtraining in a condition known as “overtraining” (Angeli et al., 2004; Michailidis, 2014). In this sense, among the markers that have been used to monitor training, we can highlight the measurement of plasma ammonia (Bassini-Cameron et al., 2008), lactate (Devlin et al., 2014), glutamine (Bassini-Cameron et al., 2008), hormones (Shkurnikov et al., 2008), lactate dehydrogenase (Hammouda et al., 2012), creatine kinase (Koch et al., 2014), and myoglobin (Clarkson et al., 2006; Yamamoto et al., 2008). In addition, the measurements of metabolites in other body fluids such as sweat and saliva (Moreira et al., 2008) and analysis of heart rate (HR) variability (Morales et al., 2014) have been postulated. Despite all these advances, there is still no consensus on which marker is the most “sensitive” to monitor the physical condition of the athlete. Based on this information, the evaluation of the levels of renal function has not been studied extensively as a potential indicator identifying less conditioned athletes by cardiopulmonary variables. Therefore, the use of this indicator in the soccer pre-season can assist conditioning coaches to individualize training and reduce athetes’ individual heterogeneity of cardiopulmonary conditioning.
The assessment of renal function is determined by measuring the glomerular filtration rate (GFR), urinary protein, urinary protein excretion, or serum cystatin C (Mingels et al., 2009). Creatinine clearance (Ccr) and other reference procedures, such as clearance of inulin, 125I-iothlamate, 51Cr-EDTA, or iohexol, are used to determine the GFR (Garasto et al., 2014). An ~50% reduction in the GFR (<60 mL/min) is considered as impaired renal function (KDIGO, 2013). During exercise, a renal blood flow is reduced and redistributed to the muscles involved in the exercise, providing an increase of oxygen demand (Mueller et al., 1998; Padilla et al., 2011). Poortmans (1990) observed that during exercise with an increasing load above 50% of maximum oxygen uptake (VO2max), there is a 60% reduction of the GFR compared to rest. Farquhar and Kenney (1999) observed that the implementation of treadmill exercise (57% VO2peak) for 60 min in an environment with high temperature caused an acute reduction of the GFR and renal blood flow in healthy elderly subjects. According to the Frank-Starling mechanism (Turkevich et al., 1988), the HR is increased in response to the reduction in stroke volume (SV) caused by a lower GFR. Thus, the relationship between VO2 peak and the HR defines the relative oxygen pulse (relative O2 pulse), which according to the Fick equation is numerically equal to the SV and arteriovenous oxygen difference [c(A-V)O2] (Oliveira et al., 2009; Whipp et al., 1996).
Previous studies conducted with athletes (Shavandi et al., 2012; Tian et al., 2011) and healthy subjects (Machado et al., 2012) verified that acute changes in the GFR occurred after exercise, although the results of cardiopulmonary variables (VO2, HR and relative O2 pulse) during the performance were not considered.
Therefore, levels of the GFR can be a potential indicator to identify alterations in cardiopulmonary variables in athletes. In this scenario, the objective of this study was to evaluate the curves of cardiorespiratory variables during cardiopulmonary exercise testing (CPET) in soccer players who had acute alterations in the GFR after performing the pre-season training protocol.
Material and Methods
Subjects
Sixteen male professional soccer players (age: 25 ± 3 years, body height: 179 ± 2 cm, body mass 77 ± 6 kg) from a first-division club in Brazil participated in the study as volunteers. The athletes who were members of an affiliated team from the State Federation of Rio de Janeiro and the coaching commission had been previously informed about the procedures that they would be submitted to. The athletes included in this study were evaluated 2 weeks after the beginning of the pre-season training period. The training protocol was unique for all athletes and independent of their initial physical fitness. After this training period, all athletes were evaluated for the GFR and cardiopulmonary variables. The athletes were grouped according to the GFR and classified according to cutoff points for chronic kidney disease (CKD) (KDIGO, 2013). Eight of the 16 athletes were classified as having a decreased GFR (<89 mL/min/1.73 m2; dGFR) and 8 as having a normal GFR (> 90 mL/min/1.73 m2; nGFR). We excluded athletes (a) with muscle injuries and joint pains or (b) those that used medications that could affect physiological responses. All subjects were notified about the research procedures, requirements, benefits, and risks before providing written informed consent. The protocol (692.573/2014) was approved by the Scientific and Ethics Committee of the Veiga de Almeida University, Brazil.
Cardiopulmonary exercise testing (CPET)
Two weeks after the beginning of the pre-season training period, the subjects arrived at the laboratory fasted (8 h overnight fast). A morning blood sample was collected 30 min before a standardized breakfast consisting of bread (~50 g), Minas cheese (~20 g), and orange juice (200 mL). After breakfast (10 min), all athletes were assessed using the same ramp protocol on a treadmill (ATL/Inbramed, Porto Alegre, Brazil) programmed to achieve the maximum duration of 8 to 14 min. After a 1 min walk at 5.5 km/h, the velocity was rapidly increased to 6 km/h and then increased by 0.14 km/h every 7.5 s (1.12 km/h every minute) without changing treadmill inclination (Perim et al., 2011). The adopted criteria to ensure a maximal exercise test were (a) achievement of maximum voluntary exhaustion, despite verbal encouragement, accompanied by a maximum effort sensation (a grade of 10 on the Borg scale) (Perim et al., 2011) and (b) a respiratory exchange ratio greater than 1.10.
Cardiopulmonary variables measurements
Data for cardiopulmonary variables were collected starting at the second minute of CPET. The HR was measured every 10 s from a continuous recording on third derivations (using MC5, V2, and AVF) measured by a digital electrocardiograph ErgoMet (HeartWare, Belo Horizonte, Brazil) with the ErgoMet software version 1.0.3.2 (HeartWare, Belo Horizonte, Brazil). Ventilatory expired gas was collected with a preVent® pneumotachograph (MedGraphics, St. Paul, MN, USA) with the aid of a neoprene mask and was analyzed by VO2000 (MedGraphics, St. Paul, MN, USA), which was calibrated before and after CPET. Cardiopulmonary variables (VO2, HR, and relative O2 pulse) were evaluated at intervals equal to 10% of the maximum time of execution of CPET for each athlete. The relative O2 pulse was calculated by dividing VO2 by the HR obtained every 10 s during CPET. In order to eliminate the influence of body mass on O2 pulse values, an effect that occurs with VO2, the values were also expressed by dividing the absolute O2 pulse (ml·beat-1) by the subject’s body mass (kg). To facilitate reading of the data, the relative O2 pulse values were multiplied by 100 (ml·beat-1·kg-1) (Perim et al., 2011). Perim et al. (2011) observed that the reduction of O2 pulse was associated with a decrease of left ventricular efficiency during the effort. When an increase of the absolute values and the inclination occurred, it seemed that there was an improvement in left ventricular efficiency (Belardinelli et al., 2003). It was shown that ventricular efficiency could be considered an excellent indicator to evaluate athletes’ performance.
Pre-season training protocol
The athletes performed five sessions per week for a total of 2 weeks before the experiment. The training protocol consisted of (a) recovery training (i.e., 30 min of continuous running at intensity between 60% and 75% of the maximal cardiac frequency), (b) aerobic training (i.e., 60 min of continuous running at intensity between 70% and 90% of the maximal cardiac frequency), (c) specific speed training (i.e., 35 min of maximal efforts between 10 and 40 m with and without the ball), (d) tactical training (i.e., 25 min of activities according to the tactical scheme proposed), (e) technical training (i.e., 50 min of attack vs. defense on reduced fields), and (f) recreational training (i.e., 60 min of athletes playing at positions different from the usual ones during collective training) (Figure 1).
Figure 1.

Experimental design: two weeks training protocol with measures acquisition
Blood collection and analysis
Subjects provided blood samples in a seated position. Blood was collected from the antecubital vein (5 ml) and transferred into plain evacuated tubes after an 8 h overnight fast before CPET. Immediately after collection, blood samples were centrifuged at 1500×g for 15 min. Creatinine and total protein were measured using a colorimetric assay (In Vitro-Human, Minas Gerais, Brazil). The analyses were made in triplicate in TP Analyser Basic (Thermoplate, Jilin, China).
Urine collection and analysis
Before CPET, a 24 h urine sample was collected in 3000 mL purpose bottles. Bottles were kept cold during the collection period. Immediately after the return of the bottles, 50 ml of each whole urine sample was collected and stored at −70°C before analysis for creatinine and total protein. Creatinine and total protein were determined by a validated semiautomated colorimetric assay on a diagnostic autoanalyzer TP Analyser Basic (Thermoplate, Jilin, China). Ccr was calculated from the serum and urine creatinine concentrations and the volume of the 24 h urine collection. The following formula was used: Ccr (mL/min/1.73 m2) = (UCr×V)/(SCr×1440) × (1.73/BSA), where UCr is urinary creatinine, V is total urine volume in the 24 h or 1440 min period, SCr is serum creatinine, and BSA is a body surface area (Bakońska-Pacoń, 2006).
Statistical Analyses
All data are presented as mean ± SD unless specified. The Shapiro-Wilk test was used to verify data normality, while a non-paired Student’s t test was used in the following variables: demographic characteristics and renal function. A Cohen’s d effect size was calculated to quantify the differences in renal function between the dGFR and nGFR groups. A two-way analysis of variance (Group×Time) with a post hoc Bonferroni test was used to compare differences among groups as a function of percentage time during CPET. Linear regression and Pearson correlation coefficient were used between relative VO2 peak (i.e., point corresponding to 100% of the total time in performing CPET) and urinary protein excretion. The level of significance was set at p < 0.05. Statistical analysis was performed using SPSS 19.0 software for statistical analyses (SPSS, Inc., Chicago, IL, USA).
Results
The demographic characteristics and renal function groups (dGFR and nGFR) are presented in Table 1. There was no significant difference (p > 0.05) in values for age, body mass, body height, and body mass index between dGFR and nGFR groups. There was a significant difference (p < 0.05) in values for the GFR (mL/min/1.73 m2), urine creatinine (mg/dL), and urine total protein (mg/dL) between dGFR and nGFR groups.
Table 1.
Demographic characteristics and renal function
| Variables | dGFR (n = 8) | nGFR (n = 8) | p* | Cohen’s d effect size |
|---|---|---|---|---|
| Demographic characteristics | ||||
| Age (yrs) | 27.8 ± 4.5 | 25.3 ± 3.1 | 0.11 | - |
| Body mass (kg) | 77.6 ± 6.0 | 75.1 ± 6.6 | 0.22 | - |
| Body height (cm) | 178.5 ± 6.0 | 179.2 ± 2.9 | 0.06 | - |
| Body mass index (kg/m2) | 24.3 ± 1.3 | 23.3 ± 1.7 | 0.11 | - |
| Renal function | ||||
| GFR (mL/min/1.73m2) | 55.0 ± 19.2 | 97.4 ± 8.8 | 0.00* | -2.84 |
| Serum creatinine (mg⋅dL-1) | 1.3 ± 0.2 | 1.3 ± 0.1 | 0.39 | 0.00 |
| Urine creatinine (mg⋅dL-1) | 112.4 ± 56.7 | 224.1 ± 80.2 | 0.00* | -1.61 |
| Serum total protein (mg⋅dL-1) | 5.8 ± 0.9 | 5.8 ± 0.6 | 0.48 | 0.00 |
| Urine total protein (mg⋅dL-1) | 14.74 ± 2.2 | 11.26 ± 3.1 | 0.01* | 1.29 |
| Urinary protein excretion (mg/24 hours) | 221.4 ± 212.2 | 126.7 ± 81.1 | 0.12 | 0.59 |
Values are means ± SD. Decreased GFR (dGFR). Normal GFR (nGFR).
Denotes differences from nGFR group (p < 0.05).
On average, ventilatory threshold was reached at intensities corresponding to 83% and 82.9% of VO2 peak by dGFR and nGFR groups, respectively. Figures 2a and 2b show the relative VO2 and HR curves as a function of percentage time during CPET. Differences were found in VO2 between groups in 90% (dGFR 49.8 ± 4.0 vs. nGFR 54.4 ± 6.1 ml·kg-1·min-1) and 100% (dGFR 52.6 ± 4.1 vs. nGFR 57.4 ± 5.9 ml·kg-1·min-1) of the CPET time duration (p < 0.05). Differences were also found in th HR between groups in 90% (dGFR 183.7 ± 5.1 vs. nGFR 176.6 ± 4.8 bpm-1) and 100% (dGFR 188.1 ± 5.0 vs. nGFR 180.8 ± 4.8 bpm-1) of the CPET time duration (p < 0.05). Furthermore, we observed differences in relative O2 pulse (x100) between groups in 70% (dGFR 25.6 ± 8.4 vs. nGFR 27.9 ± 9.7 ml·beat-1·kg-1), 80% (dGFR 26.6 ± 8.8 vs. nGFR 29.1 ± 10.0 ml·beat-1·kg-1), 90% (dGFR 27.1 ± 9.0 vs. nGFR 30.8 ± 10.6 ml·beat-1·kg-1), and 100% (dGFR 28 ± 9.2 vs. nGFR 31.8 ± 10.9 ml·beat-1·kg-1) of the CPET time duration (p < 0.05) (Figure 2c).
Figure 2.

a) Oxygen uptake, b) heart rate, and c) oxygen relative pulse curves during maximal cardiopulmonary exercise testing (CPET). Decreased GFR (dGFR). Normal GFR (nGFR). *Denotes differences from nGFR group (p < 0.05).
Linear regression with a negative correlation between lower levels of VO2 peak and high levels of urinary protein excretion (r = −0.66, R2 = 0.44, p = 0.00) is presented in Figure 3.
Figure 3.
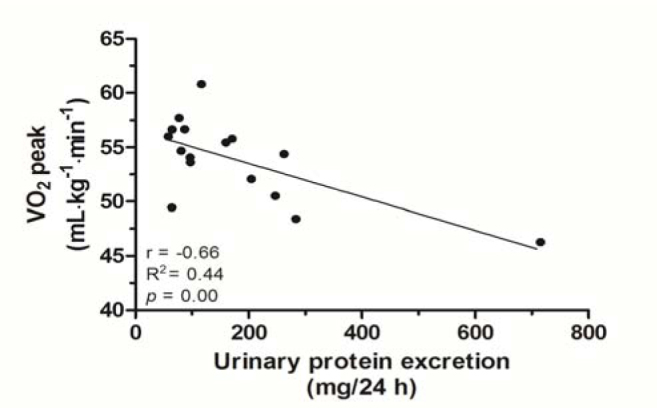
Linear regression between VO2 peak and levels of urinary protein excretion
Discussion
The results of this study showed that soccer players with reduced kidney function also presented alterations in cardiopulmonary variables involved in performance such as an increased HR and reduction of VO2 and relative O2 pulse according to the percentage time during CPET after the pre-season training protocol (Figures 2a-c).
Corroborating our findings, Leikis et al. (2006) observed a strong relationship between renal function and VO2 peak in subjects with moderate chronic kidney dysfunction (r = 0.61, p = 0.03). According to the authors, at least moderate renal dysfunction is required before this relationship can be observed. Similarly, Clyne et al. (1994) found a correlation between a reduced GFR (<30 mL/min) and maximal exercise capacity (VO2 peak: r = 0.61, p = 0.03). González-Alonso et al. (2008) and Verberne et al. (2012) explained that the indication of cardiopulmonary alterations may be related to low cardiac output, increased redistribution of the renal blood flow (i.e., producing a low GFR), and reduction of maximum volume of systolic ejection.
What is not clear is how physical performance changes over time as renal function deteriorates. In patients with CKD, there is an independent association with exercise performance across a wide range of renal function that can be improved significantly after renal transplantation (Painter et al., 1987). However, despite good kidney function and exercise training programs, the level of exercise performance does not return to expected “normal” values up to 1 year after transplantation (Painter et al., 2002).
In the present study, these renal function acute alterations could not be explained by differences in age, body height, body mass or body mass index. However, other authors observed in longitudinal studies alterations influenced by age (Danziger et al., 1990; Lindeman et al., 1985). Thus, the physical stress caused by training seems to be responsible for acute alterations in renal function. Touchberry et al. (2004) demonstrated that, regardless of kidney disease, several physiological adjustments including training periods with high intensity and high volumes (i.e., typical case of the pre-season training period) may induce acute increases in protein excretion in urine in individuals with lower tolerance to variations of training loads. Corroborating these findings, Kohanpour et al. (2011) stated that athletes with lower cardiopulmonary conditioning status could tolerate less training load variation and increase the appearance of total protein in urine.
The present study also found a negative correlation between lower levels of VO2 peak and high levels of urinary protein excretion (r = −0.66, R2 = 0.44, p = 0.00) (Figure 3). This result could be explained by an impaired endothelial function that results in lower integrity of nephrons of less physically conditioned individuals (Green, 2009).
However, it has been postulated that athletes who obtained a reduced GFR and increased urine total protein (p < 0.05) (Table 1) were those whose training load was superior to the physiological adaptation threshold. With the intention to confirm these reports, this study observed a decline in the VO2 curve and an increase in the HR curve at the point that corresponded to 90% of the total CPET time (p < 0.05) (Figures 2a and 2b). Regarding the curve related to relative O2 pulse, the decline was observed after the 70% point (p < 0.05) (Figure 2c).
The relative O2 pulse is the analysis of the VO2 ratio with HR (VO2/HR) and can infer SV. As VO2 is directly proportional to cardiac output multiplied by c(A-V)O2 (Vella and Robergs, 2005), we can consider that c(A-V)O2 rises hyperbolically without major deviations and that VO2 becomes dependent on cardiac output (VO2 = VS × HR). Thus, it is believed that the decline in the relative O2 pulse curve (Figure 2c) observed in the dGFR group may be associated with the SV reduction mechanism (Belardinelli et al., 2003). This explanation was confirmed by Perim et al. (2011), who evaluated 180 soccer players and observed that, at the point that corresponded to 40% of the total time of CPET, there was a significant reduction (p < 0.05) in relative O2 pulse levels in the group that showed high HR levels. These authors also reported that the highest values of the HR were directed to maintain cardiac output as a result of the reduction in SV during exercise.
It is believed that the most significant alterations found in cardiopulmonary variables evaluated in the dGFR group after the pre-season training protocol can be demonstrated by lower tolerance of these individuals to bear constant variations in loads during CPET. Thus, it is evident that monitoring of the variables of kidney function in athletes during the pre-season training period can lead to the identification of the fitness status regarding cardiopulmonary variables.
In conclusion, soccer players with reduced kidney function after the pre-season training protocol presented alterations in cardiopulmonary variables involved in performance, such as increased cardiac frequency and reduction of oxygen uptake and relative O2 pulse, showing lower tolerance of these individuals in supporting the final moments of the maximal exercise test. The response of renal function was different among athletes submitted to the same intensity / volume of training. The practical application of this study may suggest that the analysis of renal function during training may be a useful physiological stress marker added to routine biochemical tests.
Acknowledgements
The authors thank FAPERJ for financial support and Macaé Sport Soccer Club.
Authors submitted their contribution to the article to the editorial board.
References
- Angeli A, Minetto M, Dovio A, Paccotti P. The overtraining syndrome in athletes: a stress-related disorder. J Endocrinol Invest. 2004;27:603–612. doi: 10.1007/BF03347487. [DOI] [PubMed] [Google Scholar]
- Bakońska-Pacoń E. Creatinine clearance and 24-hour creatinine excretion profile in the urine of people after physical exercises. Biol Sport. 2006;23:157–170. [Google Scholar]
- Bassini-Cameron A, Monteiro A, Gomes A, Werneck-de-Castro JP, Cameron L. Glutamine protects against increases in blood ammonia in football players in an exercise intensity-dependent way. Br J Sports Med. 2008;42:260–266. doi: 10.1136/bjsm.2007.040378. [DOI] [PubMed] [Google Scholar]
- Belardinelli R, Lacalaprice F, Carle F, Minnucci A, Cianci G, Perna G, D’Eusanio G. Exercise-induced myocardial ischaemia detected by cardiopulmonary exercise testing. Eur Heart J. 2003;24:1304–1313. doi: 10.1016/s0195-668x(03)00210-0. [DOI] [PubMed] [Google Scholar]
- Clarkson PM, Kearns AK, Rouzier P, Rubin R, Thompson PD. Serum creatine kinase levels and renal function measures in exertional muscle damage. Med Sci Sports Exerc. 2006;38:623–627. doi: 10.1249/01.mss.0000210192.49210.fc. [DOI] [PubMed] [Google Scholar]
- Clyne N, Jogestrand T, Lins LE, Pehrsson SK. Progressive decline in renal function induces a gradual decrease in total hemoglobin and exercise capacity. Nephron. 1994;67:322–326. doi: 10.1159/000187987. [DOI] [PubMed] [Google Scholar]
- Danziger RS, Tobin JD, Becker LC, Lakatta EE, Fleg JL. The age-associated decline in glomerular filtration in healthy normotensive volunteers. Lack of relationship to cardiovascular performance. J Am Geriatr Soc. 1990;38:1127–1132. doi: 10.1111/j.1532-5415.1990.tb01376.x. [DOI] [PubMed] [Google Scholar]
- Devlin J, Paton B, Poole L, Sun W, Ferguson C, Wilson J, Kemi OJ. Blood lactate clearance after maximal exercise depends on active recovery intensity. J Sports Med Phys Fitness. 2014;54:271–278. [PubMed] [Google Scholar]
- Farquhar WB, Kenney WL. Age and renal prostaglandin inhibition during exercise and heat stress. J Appl Physiol. 1999;86:1936–1943. doi: 10.1152/jappl.1999.86.6.1936. [DOI] [PubMed] [Google Scholar]
- Garasto S, Fusco S, Corica F, Rosignuolo M, Marino A, Montesanto A, Rango F, Maggio M, Mari V, Corsonello A, Lattanzio F. Estimating Glomerular Filtration Rate in Older People. Biomed Res Int. 2014;916542:01–12. doi: 10.1155/2014/916542. [DOI] [PMC free article] [PubMed] [Google Scholar]
- González-Alonso J, Crandall CG, Johnson JM. The cardiovascular challenge of exercising in the heat. J Physiol. 2008;1:45–53. doi: 10.1113/jphysiol.2007.142158. [DOI] [PMC free article] [PubMed] [Google Scholar]
- Green DJ. Exercise training as vascular medicine: direct impacts on the vasculature in humans. Exerc Sport Sci Rev. 2009;37:196–202. doi: 10.1097/JES.0b013e3181b7b6e3. [DOI] [PubMed] [Google Scholar]
- Hammouda O, Chtourou H, Chaouachi A, Chahed H, Ferchichi S, Kallel C, Chamari K, Souissi N. Effect of short-term maximal exercise on biochemical markers of muscle damage, total antioxidant status, and homocysteine levels in football players. Asian J Sports Med. 2012;3:239–246. doi: 10.5812/asjsm.34544. [DOI] [PMC free article] [PubMed] [Google Scholar]
- Kidney Disease Improving Global Outcomes 2012 (KDIGO) Clinical practice guideline for the evaluation and management of chronic kidney disease. Kidney Int Suppl. 2013;3:1–150. [Google Scholar]
- Koch AJ, Pereira R, Machado M. The creatine kinase response to resistance exercise. J Musculoskelet Neuronal Interact. 2014;14:68–77. [PubMed] [Google Scholar]
- Kohanpour MA, Maryam V, Fateme Z, Maghsoud P, Mona M, Zonreh M, Nasirzade A, Khanmohammadi S. The effect of different intensities of sub maximal aerobic exercise on proteinuria in young football players. Res J Biol Sci. 2011;6:590–596. [Google Scholar]
- Leikis MJ, McKenna MJ, Petersen AC, Kent AB, Murphy KT, Leppik JA, Gong X, McMahon LP. Exercise performance falls over time in patients with chronic kidney disease despite maintenance of hemoglobin concentration. Clin J Am Soc Nephrol. 2006;1:488–495. doi: 10.2215/CJN.01501005. [DOI] [PubMed] [Google Scholar]
- Lindeman RD, Tobin J, Shock NW. Longitudinal studies on the rate of decline in renal function with age. J Am Geriatr Soc. 1985;33:278–85. doi: 10.1111/j.1532-5415.1985.tb07117.x. [DOI] [PubMed] [Google Scholar]
- Machado M, Zini EM, Valadão SD, Amorim MZ, Barroso TZ, De Oliveira W. Relationship of glomerular filtration rate and serum CK activity after resistance exercise in women. Int Urol Nephrol. 2012;44:515–521. doi: 10.1007/s11255-011-9963-4. [DOI] [PubMed] [Google Scholar]
- Michailidis Y. Stress hormonal analysis in elite soccer players during a season. J Sport Health Sci. 2014;3:279–283. [Google Scholar]
- Mingels A, Jacobs L, Kleijnen V, Wodzig W, Dieijen-Visser Mv. Cystatin C a marker for renal function after exercise. Int J Sports Med. 2009;30:668–671. doi: 10.1055/s-0029-1220733. [DOI] [PubMed] [Google Scholar]
- Morales AP, Sampaio-Jorge F, Rangel LFC, Coe1ho GMO, Leite TC, Ribeiro BG. Heart rate variability responses in vertical jump performance of basketball players. Int J Sports Sci. 2014;4:72–78. [Google Scholar]
- Moreira A, Arsati F, Cury PR, Franciscon C, Simões AC, Oliveira PR, de Araújo VC. The impact of a 17-day training period for an international championship on mucosal immune parameters in top-level basketball players and staff members. Eur J Oral Sci. 2008;116:431–437. doi: 10.1111/j.1600-0722.2008.00558.x. [DOI] [PubMed] [Google Scholar]
- Mueller PJ, O’Hagan KP, Skogg KA, Buckwalter JB, Clifford PS. Renal hemodynamic responses to dynamic exercise in rabbits. J Appl Physiol. 1998;85:1605–1614. doi: 10.1152/jappl.1998.85.5.1605. [DOI] [PubMed] [Google Scholar]
- Oliveira RB, Myers J, Araújo CG, Abella J, Mandic S, Froelicher V. Maximal exercise oxygen pulse as a predictor of mortality among male veterans referred for exercise testing. Eur J Cardiovasc Prev Rehabil. 2009;16:358–364. doi: 10.1097/HJR.0b013e3283292fe8. [DOI] [PubMed] [Google Scholar]
- Padilla J, Simmons GH, Bender SB, Arce-Esquivel AA, Whyte JJ, Laughlin MH. Vascular effects of exercise: endothelial adaptations beyond active muscle beds. Physiology (Bethesda) 2011;26:132–145. doi: 10.1152/physiol.00052.2010. [DOI] [PMC free article] [PubMed] [Google Scholar]
- Painter P, Hanson P, Messer-Rehak D, Zimmerman SW, Glass NR. Exercise tolerance changes following renal transplantation. Am J Kidney Dis. 1987;10:452–456. doi: 10.1016/s0272-6386(87)80192-0. [DOI] [PubMed] [Google Scholar]
- Painter PL, Hector L, Ray K, Lynes L, Dibble S, Paul SM, Tomlanovich SL, Ascher NL. A randomized trial of exercise training after renal transplantation. Transplantation. 2002;74:42–48. doi: 10.1097/00007890-200207150-00008. [DOI] [PubMed] [Google Scholar]
- Perim RR, Signorelli GR, Myers J, Arena R, de Araújo CG. The slope of the oxygen pulse curve does not depend on the maximal heart rate in elite soccer players. Clinics. 2011;66:829–835. doi: 10.1590/S1807-59322011000500020. [DOI] [PMC free article] [PubMed] [Google Scholar]
- Poortmans JR. Postexercise proteinuria in normal and diseased humans. Jap J Constit Med. 1990;54:8–18. [Google Scholar]
- Shavandi N, Samiei A, Afshar R, Saremi A, Sheikhhoseini R. The effect of exercise on urinary gamma-glutamyltransferase and protein levels in elite female karate athletes. Asian J Sports Med. 2012;3:41–46. doi: 10.5812/asjsm.34724. [DOI] [PMC free article] [PubMed] [Google Scholar]
- Shkurnikov MU, Donnikov AE, Akimov EB, Sakharov DA, Tonevitsky AG. Free testosterone as marker of adaptation to medium-intensive exercise. Bull Exp Biol Med. 2008;146:354–357. doi: 10.1007/s10517-008-0292-2. [DOI] [PubMed] [Google Scholar]
- Tian Y, Tong TK, Lippi G, Huang C, Shi Q, Nie J. Renal function parameters during early and late recovery periods following an all-out 21-km run in trained adolescent runners. Clin Chem Lab Med. 2011;49:993–997. doi: 10.1515/CCLM.2011.172. [DOI] [PubMed] [Google Scholar]
- Touchberry CD, Ernsting M, Haff G, Kilgore JL. Training alterations in elite cyclists may cause transient changes in glomerular filtration rate. J Sports Sci Med. 2004;1:28–36. [PMC free article] [PubMed] [Google Scholar]
- Turkevich D, Micco A, Reeves JT. Noninvasive measurement of the decrease in left ventricular filling time during maximal exercise in normal subjects. Am J Cardiol. 1988;62:650–652. doi: 10.1016/0002-9149(88)90676-5. [DOI] [PubMed] [Google Scholar]
- Urhausen A, Gabriel H, Kindermann W. Blood hormones as markers of training stress and overtraining. Sports Med. 1995;20:251–276. doi: 10.2165/00007256-199520040-00004. [DOI] [PubMed] [Google Scholar]
- Vella CA, Robergs RA. Non-linear relationships between central cardiovascular variables and VO2 during incremental cycling exercise in endurance-trained individuals. J Sports Med Phys Fitness. 2005;45:452–459. [PubMed] [Google Scholar]
- Verberne HJ, van der Spank A, Bresser P, Somsen GA. The prognostic value of estimated glomerular filtration rate, amino-terminal portion of the pro-hormone B-type natriuretic peptide and parameters of cardiopulmonary exercise testing in patients with chronic heart failure. Heart Int. 2012;5(7):e13. doi: 10.4081/hi.2012.e13. [DOI] [PMC free article] [PubMed] [Google Scholar]
- Whipp BJ, Higgenbotham MB, Cobb FC. Estimating exercise stroke volume from asymptotic oxygen pulse in humans. J Appl Physiol. 1996;81:2674–2679. doi: 10.1152/jappl.1996.81.6.2674. [DOI] [PubMed] [Google Scholar]
- Yamamoto LM, Judelson DA, Farrell MJ, Lee EC, Armstrong LE, Casa DJ, Kraemer WJ, Volek JS, Maresh CM. Effects of hydration state and resistance exercise on markers of muscle damage. J Strength Cond Res. 2008;22:1387–1393. doi: 10.1519/JSC.0b013e3181739403. [DOI] [PubMed] [Google Scholar]