

Abstract
To examine DNA methylation profiles in breast tumors of women with a strong breast cancer family history, we measured methylation by bisulfite sequencing in 40 genes in 40 breast tumor tissues from women in the Breast Cancer Family Registry. We selected candidate genes from analysis of the Cancer Genome Atlas project (TCGA) breast data. Compared to TCGA breast cancer, BCFR cases are younger and more likely to be ER-negative. Overall, we found that many of the methylation differences between BCFR tumor and normal adjacent tissues were smaller than that in TCGA samples. We found only 32% of tested genes were hypermethylated in BCFR; the largest difference was 36.1% for SEPW1, and the smallest difference was 10% for RYR2. These data suggest the importance of examining breast cancer cases including familial cases enriched with early-onset cancers to identify methylation markers that can be examined in blood as biomarkers for early detection.
Keywords: Breast cancer, DNA methylation, epigenetics, promoter DNA methylation, TCGA
Studies examining the associations between whole-genome DNA methylation and breast cancer classification found that there were distinct methylation patterns by hormone receptor status (1, 2) and by BRCA mutation state (3). In addition, DNA methylation profiles can also identify a cluster of breast cancers that are not classified by current expression subtypes (4). Only few studies have examined breast tumor tissues on DNA methylation in selected genes in familial breast cancer (5–7). Examining methylation in the promoter region of 10 selected genes in both inherited and non-inherited breast cancer, Esteller et al. (5) suggested that hereditary breast cancers have methylation levels similar to that of sporadic tumors in these genes. However, another study reported that the median cumulative methylation index calculated as the sum of the percentage methylation for 11 genes was significantly lower in BRCA1-related breast cancers than in sporadic breast cancers (6).
Recent data from The Cancer Genome Atlas (TCGA) has dramatically expanded the number of genes identified as aberrantly methylated in breast cancer (8). The aim of the current study was to examine the methylation values in selected genes that are highly methylated in TCGA breast tumor tissues in breast cancer tissues from high-risk women. By analyzing data of Illumina HumanMethylation450 array in breast cancer in TCGA Network, we first selected 40 genes that are hypermethylated in breast tumor than adjacent non-tumor tissues. We then compared DNA methylation levels of these 40 genes using high throughput targeted bisulfite sequencing in 40 breast tumor and non-tumor tissue pairs from high-risk women from the New York site of the Breast Cancer Family Registry (BCFR). We also examined the relationship of methylation in each loci with estrogen receptor (ER) status and age at cancer diagnosis.
Materials and Methods
Study participants
We selected breast cancer cases from families participating in the New York site of the BCFR (9, 10). We recruited high risk breast and/or ovarian cancer families from clinical and community settings within the Metropolitan New York area who were eligible to participate if they met one of the following criteria: i) have a female relative with breast or ovarian cancer diagnosed before age 45 years, ii) have a female relative with both breast and ovarian cancer regardless of age at diagnosis, iii) have two or more relatives with breast or ovarian cancer diagnosed after age 45 years, iv) be a male with breast cancer diagnosed at any age, or v) have a family member with a known BRCA mutation. The study was approved by Columbia University’s Institutional Review Board; written informed consent was obtained from all subjects, and strict quality controls and safeguards were used to protect confidentiality. For DNA methylation analysis, we analyzed 40 formaldehyde-fixed paraffin embedded (FFPE) breast tumors and adjacent non-tumor tissues from breast cancer cases who have family history of breast cancer, including 19 ER-negative and 21 ER-positive tumors.
DNA extraction and bisulfite treatment
With the H&E-stained slide used as a guide, the pathologist (Dr. Hibshoosh) circled the region of breast carcinoma on the corresponding unstained slide for macrodissection. Non-tumor tissue from outside the circled area was also removed. Tissues were de-paraffinized before DNA extraction. We used two 10-μm sections per case to extracted DNA by a standard phenol-chloroform protocol. Aliquots of DNA (1 μg) were bisulfite-treated with Epitect kit (Qiagen) as per the manufacturer’s instructions. The DNA was resuspended in 20 μL of distilled water and stored at –20°C until use.
TCGA data analysis for selection of genes
To identify breast-specific DNA methylation markers, we downloaded Illumina Infinium Human Methylation450 data (Level 3 data) for tumor tissues and adjacent non-tumor tissues and clinical annotation tables for 96 breast invasive carcinomas from TCGA data portal (https://tcgadata.nci.nih.gov/tcga/tcgaHome2.jsp) (5/20/2014). We used paired sample t-test with Bonferroni’s correction for multiple testing to identify CpG sites that were differentially methylated between tumor and adjacent tissues. A statistically significant difference was defined as sites with a Bonferroni-corrected p-value <0.0005; a total of 84,584 CpG sites were identified. We then selected candidate genes (Table I) based on the criteria for selecting driver methylation changes (11) from TCGA breast cancer data; they are: 1) effect size, with >20% higher methylation in tumor tissues, 3) genomic location, with CpG sites located in the CpG Island, 4) excluding any CpG sites with SNPs on the array probe. Among those 5,762 CpG sites, we selected the top 40 CpG sites with largest difference in methylation. The difference in beta value between tumor and adjacent nontumor tissues in these CpG sites range from 0.40 to 0.54.
Table I.
Clinical characteristics of breast cancer patients in the Breast Cancer Family Registry (BCRF) and The Cancer Genome Atlas (TCGA).
| BCFR | TCGA | |
|---|---|---|
| Age at diagnosis (Mean, SD), years | 46.4 (11.4) | 57.2 (15.4) |
| Race, % | ||
| White | 77.5 | 93.3 |
| Hispanics | 7.5 | 0.0 |
| Black | 5.0 | 4.4 |
| Others | 10.0 | 2.3 |
| Menopausal status, % | ||
| Pre | 37.5 | 26.7 |
| Post | 50.0 | 54.4 |
| Indeterminate/others | 12.5 | 18.9 |
| ER Status, % | ||
| Negative | 47.5 | 16.7 |
| Positive | 52.5 | 71.1 |
| Unknown | 0.0 | 12.2 |
Bisulfite DNA sequencing for measuring DNA methylation in candidate genes
DNA methylation was measured using an Illumina MiSEQ instrument as per the manufacturer’s instructions. We designed 40 pairs of oligonucleotide primers to cover the target CpG site region using MethPrimer with default parameters (12). The number of CpG sites per amplicon ranges from 4 to 34. We trimmed the Fastq files generated by sequencing (http://www.bioinformatics.babraham.ac.uk/projects/trim_galore/) for both adapters and for a quality cut off of 30 using trimmed galore. Sequencing alignment and methylation calls was done via Bismark (13) and bowtie2 (14) and the methylation status and methylation level of each analyzed CpG-sites were then determined. The methylation level for each gene was assigned by averaging the methylation level of all CpG sites in the gene for each sample. Primers are available on requesting from the authors.
Statistical methods
We used paired-t-test to determine the differences in methylation between breast tumor and adjacent nontumor tissues of BCFR samples. We used Wilcoxon Rank Sum test to examine methylation by ER status (positive vs. negative) and age at cancer diagnosis (<50 vs. ≥50 years of age) among tumor tissues. We used SAS software 9.3 (SAS Institute, Cary, NC, USA) for the analyses.
Results
Table I presents the distributions of selected characteristics in BCFR cases and TCGA breast cancer cases. BCFR breast cases were younger than TCGA cases. The mean age of breast cancer diagnosis was 46.4±11.4 for BCFR cases and 57.2±15.4 for TCGA cases. Sixty-five percent of BCFR breast cases were diagnosed with breast cancer before the age of 50, while only 33% of TCGA breast cases were early onset cases. Most breast cancer cases (71%) in TCGA were ER positive and 53% cases in the BCFR were ER positive.
The overall methylation levels for each locus in tumor and adjacent tissues in BCFR tissue samples and corresponding methylation difference in TCGA breast and adjacent non-tumor tissues are given in Table II. Overall, the methylation levels for most of genes were higher in tumor samples than in adjacent tissues in BCFR tissue samples. Seven genes (SEPW1, PCDHGA4, CCDC36, C1orf14, RPTOR, C1orf114, and ZNF454) had methylation levels in tumors at least 20% higher than in adjacent tissues. The largest difference was 36.1% for SEPW1. A total of 13 genes (SEPW1 (74.4 vs. 38.6%), PCDHGA4 (46.0 vs. 17.9 %), CCDC36 (42.7 vs. 16.2%), C1orf14 (55.7 vs. 29.3%), RPTOR (53.2 vs. 28.9%), C1orf114 (54.6 vs. 31.0%), ZNF454 (32.9 vs. 10.1%), USP44 (40.1 vs. 22.4%), CSMD3 (29.1 vs. 12.1%), PRKAR1B (61.1 vs. 48.6%), SLC7A14 (32.9 vs. 21.0%), SOX2OT (32.1 vs. 20.6%) and RYR2 (24.0 vs. 14.0%)) showed significantly higher methylation in breast tumor compared to adjacent non-tumor tissues. Although the technologies for DNA methylation measurement are different between our and TCGA, the methylation levels in TCGA breast tumor were higher than that in BCFR tumor samples, while the methylation levels in TCGA adjacent samples were lower than that in BCFR adjacent samples (Figure 1).
Table II.
Distribution of DNA methylation levels in 40 loci in breast tumor and adjacent non-tumor tissues from the New York site of Breast Cancer Family Registry by bisulfite sequencing and in The Cancer Genome Atlas by IIlumina 450k array.
| Breast tumor | Non-tumor breast |
TCGA 450K data |
|||
|---|---|---|---|---|---|
| Gene | Mean (SD), % |
Mean (SD), % |
Difference | p-Value | Difference, beta |
| SEPW1 | 74.7 (22.6) | 38.6 (30.4) | 36.1 | <0.0001 | 0.45 |
| PCDHGA4 | 46.0 (34.7) | 17.9 (15.4) | 28.1 | 0.02 | 0.45 |
| CCDC36 | 42.7 (30.7) | 16.2 (10.6) | 26.5 | 0.03 | 0.48 |
| C1orf14 | 55.7 (24.6) | 29.3 (25.6) | 26.4 | 0.01 | 0.45 |
| RPTOR | 53.2 (29.2) | 28.9 (26.9) | 24.3 | 0.01 | 0.46 |
| C1orf114 | 54.6 (33.4) | 31.0 (31.5) | 23.7 | 0.03 | 0.47 |
| ZNF454 | 32.9 (29.2) | 10.1 (12.5) | 22.8 | <0.001 | 0.44 |
| DBX1 | 27.4 (26.3) | 9.7 (5.2) | 17.7 | 0.06 | 0.43 |
| USP44 | 40.1 (28.7) | 22.4 (23.1) | 17.7 | 0.04 | 0.54 |
| CSMD3 | 29.1 (20.8) | 12.1 (9.6) | 17.0 | 0.01 | 0.46 |
| MACF1 | 62.5 (15.9) | 46.0 (20.7) | 16.5 | 0.06 | 0.45 |
| FOXA2 | 40.4 (23.1) | 24.0 (17.3) | 16.4 | 0.08 | 0.43 |
| SCRT2 | 44.2 (31.7) | 28.6 (29.1) | 15.6 | 0.23 | 0.44 |
| OTX2OS1 | 36.7 (31.0) | 22.7 (18.7) | 14.0 | 0.08 | 0.54 |
| C12orf68 | 46.6 (30.1) | 32.9 (28.7) | 13.7 | 0.05 | 0.45 |
| CPXM1 | 27.6 (31.6) | 14.7 (24.9) | 12.8 | 0.08 | 0.46 |
| ZNF177 | 25.7 (27.6) | 13.2 (11.5) | 12.6 | 0.06 | 0.43 |
| PRKAR1B | 61.1 (20.2) | 48.6 (25.8) | 12.5 | 0.04 | 0.45 |
| TBR1 | 30.4 (32.2) | 18.3 (9.7) | 12.1 | 0.30 | 0.45 |
| TNR | 57.1 (32.3) | 45.2 (35.2) | 12.0 | 0.16 | 0.43 |
| SLC7A14 | 32.9 (18.4) | 21.0 (19.1) | 11.9 | <0.001 | 0.46 |
| SOX2OT | 32.1 (28.0) | 20.6 (21.0) | 11.5 | 0.03 | 0.46 |
| GRM1 | 34.8 (24.8) | 23.7 (20.6) | 11.1 | 0.09 | 0.40 |
| RYR2 | 24.0 (15.6) | 14.0 (13.8) | 10.0 | 0.01 | 0.48 |
| PTPRN | 30.8 (25.1) | 21.6 (30.7) | 9.2 | 0.43 | 0.48 |
| PAX6 | 22.0 (22.8) | 14.5 (14.3) | 7.5 | 0.10 | 0.47 |
| C1orf94 | 34.5 (23.0) | 27.2 (21.1) | 7.3 | 0.31 | 0.43 |
| SST | 27.8 (24.9) | 20.8 (21.5) | 7.0 | 0.27 | 0.42 |
| TLX1 | 23.1 (28.8) | 16.5 (22.3) | 6.6 | 0.18 | 0.48 |
| H2AFY | 28.6 (21.3) | 23.5 (20.7) | 5.1 | 0.44 | 0.48 |
| GPRC5B | 9.3 (15.8) | 5.4 (13.2) | 3.9 | 0.31 | 0.46 |
| ALX1 | 42.4 (28.5) | 39.3 (27.6) | 3.1 | 0.67 | 0.41 |
| GAL3ST3 | 23.6 (20.6) | 22.3 (24.9) | 1.3 | 0.84 | 0.46 |
| VAX1 | 14.1 (15.5) | 13.1 (15.5) | 1.0 | 0.76 | 0.44 |
| GRASP | 39.7 (36.9) | 39.7 (30.0) | 1.0 | 0.95 | 0.49 |
| TTBK1 | 17.4 (13.5) | 18.5 (21.8) | –1.0 | 0.84 | 0.49 |
| TULP1 | 31.3 (18.3) | 32.6 (20.1) | –1.3 | 0.72 | 0.50 |
| FEZF2 | 25.2 (25.3) | 26.9 (18.7) | –1.7 | 0.82 | 0.43 |
| L1TD1 | 42.7 (27.7) | 45.3 (26.0) | –2.6 | 0.82 | 0.42 |
| KLHDC7B | 56.7 (31.9) | 60.1 (29.7) | –3.4 | 0.72 | 0.41 |
Figure 1.
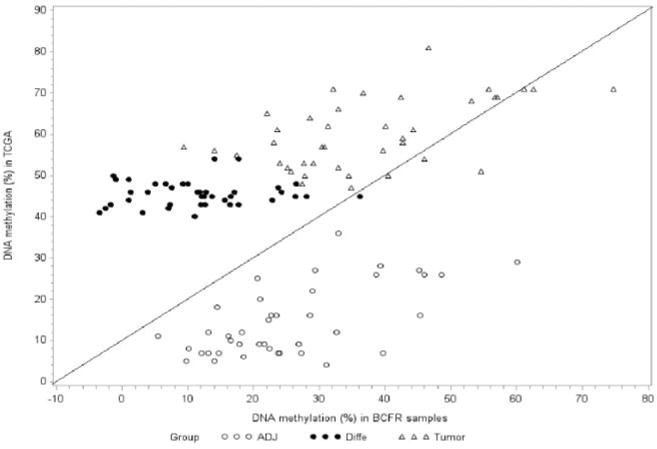
DNA Methylation in tumor and adjacent tissues and the difference in DNA methylation between tumor and adjacent tissues by samples from the New York site of the BCFR and from The Cancer Genome Atlas.
We also examined the methylation of these genes by ER status and age at cancer diagnosis in BCFR samples and TCGA breast tumor data. In TCGA breast tumor, methylation in C1orf14, ZNF454, GPRC5B and KLHDC7B were higher, while methylation in GRM1, VAX1, TULP1, and L1TD1 were lower in ER positive than ER negative (Table III). The methylation levels in 3 genes were higher in older cases of TCGA samples (Table III). We did not observe any different by ER status or age in BCFR tumor samples.
Table III.
Distribution of DNA methylation levels by estrogen receptor (ER) status (A) and by age at breast cancer diagnosis (B) in breast tumors from the New York site of the BCFR by bisulfite sequencing and from The Cancer Genome Atlas Illumina 450k array.
| BCFR
|
TCGA
|
|||||
|---|---|---|---|---|---|---|
| Gene | ER Positive Mean (SD),% |
ER Negative Mean (SD),% |
p-Value | ER Positive Mean (SD), Beta |
ER Negative Mean (SD), Beta |
p-Value |
| C1orf14 | 58.5 (27.7) | 52.0 (24.3) | 0.54 | 0.74 (0.22) | 0.56 (0.38) | 0.01 |
| ZNF454 | 37.8 (33.7) | 23.4 (27.0) | 0.28 | 0.57 (0.25) | 0.37 (0.29) | 0.01 |
| GRM1 | 40.1 (30.6) | 39.6 (26.8) | 0.96 | 0.39 (0.25) | 0.68 (0.16) | <0.0001 |
| GPRC5B | 13.9 (21.0) | 7.3 (15.2) | 0.31 | 0.62 (0.26) | 0.32 (0.30) | 0.0002 |
| VAX1 | 13.8 (14.6) | 15.0 (15.8) | 0.82 | 0.53 (0.17) | 0.64 (0.12) | 0.03 |
| TULP1 | 33.6 (16.6) | 29.3 (27.5) | 0.65 | 0.59 (0.24) | 0.76 (0.15) | 0.01 |
| L1TD1 | 55.6 (28.0) | 33.5 (27.2) | 0.08 | 0.55 (0.21) | 0.68 (0.14) | 0.03 |
| KLHDC7B | 61.9 (33.6) | 61.4 (30.1) | 0.97 | 0.73 (0.20) | 0.59 (0.30) | 0.03 |
|
| ||||||
| <50 yrs of age | >50 yrs of age | <50 yrs of age | >50 yrs of age | |||
|
| ||||||
| RPTOR | 46.0 (28.1) | 63.7 (27.5) | 0.09 | 0.59 (0.24) | 0.72 (0.15) | 0.0002 |
| TBR1 | 37.8 (37.6) | 14.0 (10.3) | 0.41 | 0.47 (0.27) | 0.62 (0.28) | 0.02 |
| TTBK1 | 21.7 (17.8) | 21.0 (23.1) | 0.92 | 0.40 (0.33) | 0.64 (0.33) | 0.002 |
Discussion
In this study, we examined DNA methylation profiles in breast tumor tissues from women at high risk. Among 40 tested genes that are hypermethylated in TCGA breast tumor tissues, we found that only 13 of them were highly methylated in our sample of high-risk women. Consistent with the TCGA breast data, methylation levels in SEPW1, PCDHGA4, CCDC36, C1orf14, RPTOR, C1orf114, ZNF454, USP44, CSMD3, PRKAR1B, SLC7A14, SOX2OT and RYR2 were significantly higher in the breast tumor than in adjacent histologically normal tissues. The difference in methylation between tumor and adjacent tissues ranged from 10.0% for RYR2 to 36.1% for SEPW1. Compared to data from TCGA breast tissues that are from mainly sporadic breast cancer cases, the methylation levels were lower in our BCFR tumor samples, however, the levels were higher in our adjacent samples then in TCGA adjacent tissues.
Differences in the technologies for DNA methylation measurement between our study (bisulfite sequencing) and TCGA (Illumina arrays) cannot explain the observation of smaller differences in DNA methylation between breast tumor and adjacent non-tumor tissues in our study than in TCGA data, as we compared methylation difference between tumor and non-tumor tissues within the same platform. The TCGA was not enriched for women at very high risk (e.g., strong family history of breast cancer) and young cancer cases (33% in TCGA vs. 65% in BCFR samples). Clinical observations and molecular studies suggest biology of early-onset breast cancer is different from that of late-onset cancer (15). In contrast to later-onset cancer, early-onset breast cancer is enriched with ER-negative tumor (16). We did not see any methylation difference by ER status, but we found that methylation status of 11 genes differed by either ER status or age of cancer diagnosis in TCGA samples. As we only examined a small fraction (<1%) of hypermethylated genes in TCGA breast data, to better characterize DNA methylation profiles in familial breast cancer, studies examining a large-scale of DNA methylation profiles in breast tumor tissues with detail family history of breast cancer are needed.
Examining epigenome-wide DNA methylation profiles in breast tumors, several studies have identified a number of alternately methylated genes including SEPW1, PCDHGA4, CCDC36, C1orf14, RPTOR, C1orf114, ZNF454, USP44, CSMD3, PRKAR1B, SLC7A14, SOX2OT, and RYR2 (8, 17). Comparing DNA methylation profiles between healthy breast tissue and ductal carcinoma in situ using HumanMethylation450 microarrays, Fleischer et al. (17) found a total 16,949 CpGs were differentially methylated, representing 5,659 genes including SEPW1, PCDHGA4, CCDC36, C1orf114, CSMD3, SLC7A14, RYR2, and RPTOR, suggesting hypermethylation of these selected genes occurs early in breast cancer development including familial breast cancer. Hypermethylation in the promoter regions of key genes might allow for clonal selection and growth of tumor cells (18).
Using whole-exome sequencing in breast tumor tissue, mutations in RYR2, C1orf14, SLC7A14, and RPTOR have been identified (8, 19–21). The observation of hypermethylation of these genes in breast cancer suggests that epigenetic silencing via methylation is another important mechanism for inactivating these genes in breast cancer tumorigenesis. Genome-wide DNA methylation studies have supported the correlation of CpG island DNA hypermethylation and gene expression (4, 22–24). Using MEXPRESS (25) (http://mexpress.be/) to visualize and examine DNA methylation and expression data from data in TCGA breast tumor, methylation was significantly associated with gene expression in SEPW11 (person correlation coefficient r=–0.11), PCDHGA4 (r=–0.21), CCDC36 (r=0.42), RPTOR (r=0.24), ZNF454 (r=–0.60), USP44 (r=0.63), CSMD3 (r=0.01), PRKAR1B (r=0.39), SLC7A14 (r=–0.32), and RYR2 (r=–0.19). Further studies are need to better understand the role of DNA methylation alterations in these genes involved in breast tumorigenesis.
In summary, we found that the genes we selected from TCGA breast data, because they were dysregulated in DNA methylation were not all dysregulated in breast tumor tissues from women with a strong breast cancer family history. As accumulating data suggest the importance of DNA methylation alternations for cancer risk, a more comprehensive set of breast cancer cases including familial cases enriched with early-onset cancers need to be studied in order to identify methylation changes in genes that can be examined in the peripheral blood as biomarkers for early detection.
Acknowledgments
The Authors thank the Epigenetics Shared Resource of the Herbert Irving Comprehensive Cancer Center for performing the targeted bisulfite sequencing. We would like to gratefully acknowledge all of the families that participate in the New York site of the BCFR. The Breast Cancer Family Registry (BCFR) was supported by grant UM1 CA164920 from the USA National Cancer Institute. The content of this manuscript does not necessarily reflect the views or policies of the National Cancer Institute or any of the collaborating centers in the BCFR, nor does mention of trade names, commercial products, or organizations imply endorsement by the USA Government or the BCFR.
Footnotes
This article is freely accessible online.
Conflicts of Interest
There is no conflict for all authors.
References
- 1.Fackler MJ, Umbricht CB, Williams D, Argani P, Cruz L-A, Merino VF, Teo WW, Zhang Z, Huang P, Visvananthan K, Marks J, Ethier S, Gray JW, Wolff AC, Cope LM, Sukumar S. Genome-wide methylation analysis identifies genes specific to breast cancer hormone receptor status and risk of recurrence. Cancer Res. 2011;71(19):6195–6207. doi: 10.1158/0008-5472.CAN-11-1630. [DOI] [PMC free article] [PubMed] [Google Scholar]
- 2.Widschwendter M, Siegmund KD, Müller HM, Fiegl H, Marth C, Müller-Holzner E, Jones PA, Laird PW. Association of breast cancer DNA methylation profiles with hormone receptor status and response to tamoxifen. Cancer Res. 2004;64(11):3807–3813. doi: 10.1158/0008-5472.CAN-03-3852. [DOI] [PubMed] [Google Scholar]
- 3.Flanagan JM, Cocciardi S, Waddell N, Johnstone CN, Marsh A, Henderson S, Simpson P, da Silva L, Khanna K, Lakhani S, Boshoff C, Chenevix-Trench G. DNA methylome of familial breast cancer identifies distinct profiles defined by mutation status. The American J Hum Genet. 2010;86(3):420–433. doi: 10.1016/j.ajhg.2010.02.008. [DOI] [PMC free article] [PubMed] [Google Scholar]
- 4.Dedeurwaerder S, Desmedt C, Calonne E, Singhal SK, Haibe-Kains B, Defrance M, Michiels S, Volkmar M, Deplus R, Luciani J, Lallemand F, Larsimont D, Toussaint J, Haussy S, Rothé F, Rouas G, Metzger O, Majjaj S, Saini K, Putmans P, Hames G, van Baren N, Coulie PG, Piccart M, Sotiriou C, Fuks F. DNA methylation profiling reveals a predominant immune component in breast cancers. EMBO Mol Med. 2011;3(12):726–741. doi: 10.1002/emmm.201100801. [DOI] [PMC free article] [PubMed] [Google Scholar]
- 5.Esteller M, Fraga MF, Guo M, Garcia-Foncillas J, Hedenfalk I, Godwin AK, Trojan J, Vaurs-Barrière C, Bignon Y-J, Ramus S, Benitez J, Caldes T, Akiyama Y, Yuasa Y, Launonen V, Canal MJ, Rodriguez R, Capella G, Peinado MA, Borg A, Aaltonen LA, Ponder BA, Baylin SB, Herman JG. DNA methylation patterns in hereditary human cancers mimic sporadic tumorigenesis. Hum Mol Genet. 2001;10(26):3001–3007. doi: 10.1093/hmg/10.26.3001. [DOI] [PubMed] [Google Scholar]
- 6.Suijkerbuijk KPM, Fackler MJ, Sukumar S, van Gils CH, van Laar T, van der Wall E, Vooijs M, van Diest PJ. Methylation is less abundant in brca1-associated compared with sporadic breast cancer. Ann Oncol. 2008;19(11):1870–1874. doi: 10.1093/annonc/mdn409. [DOI] [PMC free article] [PubMed] [Google Scholar]
- 7.Dite G, Makalic E, Schmidt D, Giles G, Hopper J, Southey M. Tumour morphology of early-onset breast cancers predicts breast cancer risk for first-degree relatives: The australian breast cancer family registry. Breast Cancer Res. 2012;14(4):R122. doi: 10.1186/bcr3248. [DOI] [PMC free article] [PubMed] [Google Scholar]
- 8.Network TCGA. Comprehensive molecular portraits of human breast tumours. Nature. 2012;490(7418):61–70. doi: 10.1038/nature11412. [DOI] [PMC free article] [PubMed] [Google Scholar]
- 9.Wu H-C, Delgado-Cruzata L, Flom JD, Perrin M, Liao Y, Ferris JS, Santella RM, Terry MB. Repetitive element DNA methylation levels in white blood cell DNA from sisters discordant for breast cancer from the new york site of the breast cancer family registry. Carcinogenesis. 2012;33(10):1946–1952. doi: 10.1093/carcin/bgs201. [DOI] [PMC free article] [PubMed] [Google Scholar]
- 10.Wu H-C, Delgado-Cruzata L, Machella N, Wang Q, Santella R, Terry M. DNA double-strand break repair genotype and phenotype and breast cancer risk within sisters from the new york site of the breast cancer family registry (bcfr) Cancer Causes Control. 2013;24(12):2157–2168. doi: 10.1007/s10552-013-0292-z. [DOI] [PMC free article] [PubMed] [Google Scholar]
- 11.Michels KB, Binder AM, Dedeurwaerder S, Epstein CB, Greally JM, Gut I, Houseman EA, Izzi B, Kelsey KT, Meissner A, Milosavljevic A, Siegmund KD, Bock C, Irizarry RA. Recommendations for the design and analysis of epigenome-wide association studies. Nat Meth. 2013;10(10):949–955. doi: 10.1038/nmeth.2632. [DOI] [PubMed] [Google Scholar]
- 12.Li LC, Dahiya R. Methprimer: Designing primers for methylation pcrs. Bioinformatics. 2002;18(11):1427–1431. doi: 10.1093/bioinformatics/18.11.1427. [DOI] [PubMed] [Google Scholar]
- 13.Krueger F, Andrews SR. Bismark: A flexible aligner and methylation caller for bisulfite-seq applications. Bioinformatics. 2011;27(11):1571–1572. doi: 10.1093/bioinformatics/btr167. [DOI] [PMC free article] [PubMed] [Google Scholar]
- 14.Langmead B, Salzberg SL. Fast gapped-read alignment with bowtie 2. Nat Methods. 2012;9(4):357–359. doi: 10.1038/nmeth.1923. [DOI] [PMC free article] [PubMed] [Google Scholar]
- 15.Azim HA, Partridge AH. Biology of breast cancer in young women. Breast Cancer Res. 2014;16(4):427. doi: 10.1186/s13058-014-0427-5. [DOI] [PMC free article] [PubMed] [Google Scholar]
- 16.Anderson WF, Pfeiffer RM, Dores GM, Sherman ME. Comparison of age distribution patterns for different histopathologic types of breast carcinoma. Cancer Epidemiol Biomarkers Prev. 2006;15(10):1899–1905. doi: 10.1158/1055-9965.EPI-06-0191. [DOI] [PubMed] [Google Scholar]
- 17.Fleischer T, Frigessi A, Johnson K, Edvardsen H, Touleimat N, Klajic J, Riis M, Haakensen V, Warnberg F, Naume B, Helland A, Borresen-Dale A-L, Tost J, Christensen B, Kristensen V. Genome-wide DNA methylation profiles in progression to in situ and invasive carcinoma of the breast with impact on gene transcription and prognosis. Genome Biol. 2014;15(8):435. doi: 10.1186/s13059-014-0435-x. [DOI] [PMC free article] [PubMed] [Google Scholar]
- 18.Widschwendter M, Jones P. DNA methylation and breast carcinogenesis. Oncogene. 2002;21:5462–5482. doi: 10.1038/sj.onc.1205606. [DOI] [PubMed] [Google Scholar]
- 19.Banerji S, Cibulskis K, Rangel-Escareno C, Brown KK, Carter SL, Frederick AM, Lawrence MS, Sivachenko AY, Sougnez C, Zou L, Cortes ML, Fernandez-Lopez JC, Peng S, Ardlie KG, Auclair D, Bautista-Pina V, Duke F, Francis J, Jung J, Maffuz-Aziz A, Onofrio RC, Parkin M, Pho NH, Quintanar-Jurado V, Ramos AH, Rebollar-Vega R, Rodriguez-Cuevas S, Romero-Cordoba SL, Schumacher SE, Stransky N, Thompson KM, Uribe-Figueroa L, Baselga J, Beroukhim R, Polyak K, Sgroi DC, Richardson AL, Jimenez-Sanchez G, Lander ES, Gabriel SB, Garraway LA, Golub TR, Melendez-Zajgla J, Toker A, Getz G, Hidalgo-Miranda A, Meyerson M. Sequence analysis of mutations and translocations across breast cancer subtypes. Nature. 2012;486(7403):405–409. doi: 10.1038/nature11154. [DOI] [PMC free article] [PubMed] [Google Scholar]
- 20.Goncalves R, Warner W, Luo J, Ellis M. New concepts in breast cancer genomics and genetics. Breast Cancer Res. 2014;16(5):460. doi: 10.1186/s13058-014-0460-4. [DOI] [PMC free article] [PubMed] [Google Scholar]
- 21.Yost SE, Smith EN, Schwab RB, Bao L, Jung H, Wang X, Voest E, Pierce JP, Messer K, Parker BA, Harismendy O, Frazer KA. Identification of high-confidence somatic mutations in whole genome sequence of formalin-fixed breast cancer specimens. Nucleic Acids Res. 2012;40(14):e107. doi: 10.1093/nar/gks299. [DOI] [PMC free article] [PubMed] [Google Scholar]
- 22.Li J, Gao F, Li N, Li S, Yin G, Tian G, Jia S, Wang K, Zhang X, Yang H, Nielsen A, Bolund L. An improved method for genome wide DNA methylation profiling correlated to transcription and genomic instability in two breast cancer cell lines. BMC Genom. 2009;10(1):223. doi: 10.1186/1471-2164-10-223. [DOI] [PMC free article] [PubMed] [Google Scholar]
- 23.Van der Auwera I, Yu W, Suo L, Van Neste L, van Dam P, Van Marck EA, Pauwels P, Vermeulen PB, Dirix LY, Van Laere SJ. Array-based DNA methylation profiling for breast cancer subtype discrimination. PLoS ONE. 2010;5(9):e12616. doi: 10.1371/journal.pone.0012616. [DOI] [PMC free article] [PubMed] [Google Scholar]
- 24.Kamalakaran S, Varadan V, Giercksky Russnes HE, Levy D, Kendall J, Janevski A, Riggs M, Banerjee N, Synnestvedt M, Schlichting E, Kåresen R, Shama Prasada K, Rotti H, Rao R, Rao L, Eric Tang M-H, Satyamoorthy K, Lucito R, Wigler M, Dimitrova N, Naume B, Borresen-Dale A-L, Hicks JB. DNA methylation patterns in luminal breast cancers differ from non-luminal subtypes and can identify relapse risk independent of other clinical variables. Mol Oncol. 2011;5(1):77–92. doi: 10.1016/j.molonc.2010.11.002. [DOI] [PMC free article] [PubMed] [Google Scholar]
- 25.Koch A, De Meyer T, Jeschke J, Van Criekinge W. Mexpress: Visualizing expression, DNA methylation and clinical tcga data. BMC Genom. 2015;16(1):1–6. doi: 10.1186/s12864-015-1847-z. [DOI] [PMC free article] [PubMed] [Google Scholar]