

Abstract
Obesity is a major risk factor for colorectal cancer and can accelerate Lgr5+ intestinal stem cell (ISC)-derived tumorigenesis following inactivation of Apc. However, whether non-canonical pathways involving PI3K-Akt signaling in ISCs can lead to tumor formation, and if this can be further exacerbated by obesity is unknown. Despite the synergy between Pten and Apc inactivation in epithelial cells on intestinal tumor formation, their combined role in Lgr5+-ISCs, which are the most rapidly dividing ISC population in the intestine, is unknown. Lgr5+-GFP mice were provided low-fat diet (LFD) or high-fat diet (HFD) for 8 mo and the transcriptome was evaluated in Lgr5+-ISCs. For tumor studies, Lgr5+-GFP and Lgr5+-GFP Ptenflox/flox mice were tamoxifen treated to inactivate Pten in ISCs and provided LFD or HFD until 14–15 mo of age. Finally, various combinations of Lgr5+-ISC specific, Apc and Pten-deleted mice were generated, and evaluated for histopathology and survival. HFD did not overtly alter Akt signaling in ISCs, but did increase other metabolic pathways. Pten deficiency, but not HFD, increased BrdU positive cells in the small intestine (P<0.05). However, combining Pten and Apc deficiency synergistically increased proliferative markers, tumor pathology and mortality, in a dose-dependent fashion (P<0.05). In summary, we show that HFD alone fails to drive Akt signaling in ISCs and that Pten deficiency, is dispensable as a tumor suppressor in Lgr5+-ISCs. However, combining Pten and Apc deficiency in ISCs synergistically increases proliferation, tumor formation, and mortality. Thus, aberrant Wnt/β-catenin, rather than PI3K-Akt signaling, is requisite for obesity to drive Lgr5+ISC-derived tumorigenesis.
Keywords: colon cancer, Pten, Obesity, Lgr5, Apc
Introduction
Evidence suggests that intestinal stem cell (ISC) populations can serve as the origin of tumor development. Indeed, increased Wnt/β-catenin signaling in Lgr5+, Bmi1+, or Lrig1+ ISCs, as well as Ah-cre cells in the transit amplifying (TA) compartment, have been shown to rapidly promote tumorigenesis (Barker, et al. 2009; Powell, et al. 2014; Sangiorgi and Capecchi 2008). The phosphoinositide-3-kinase (PI3K)-Akt pathway, which is commonly deregulated in human colorectal cancer, has been causally linked to tumor development in rodents, independent of canonical Wnt signaling, via PIK3CA mutations (Leystra, et al. 2012) or Pten inactivation in the intestinal epithelium (Byun, et al. 2011). Furthermore, constitutive activation of PI3K or loss of Pten in the intestinal epithelium can synergize with Apc inactivation to dramatically increase intestinal tumor development (Deming, et al. 2014; Langlois, et al. 2009; Marsh, et al. 2008; Shao, et al. 2007). In small intestine, Pten is most robustly expressed in the villus, but levels are also detectable in the crypt base, where Lgr5+-ISCs reside (Byun et al. 2011). However, to what extent the PI3K-Akt pathway may be involved in driving Lgr5+-ISC-derived tumorigenesis, either independently, or in cooperation with dysregulated Wnt/β-catenin signaling, is unknown.
Obesity and diet are also strong regulators of CRC risk and progression in humans (Bardou, et al. 2013; Cheskin and Prosser 2007; Giovannucci and Michaud 2007; Kim, et al. 2006; Pischon, et al. 2006; Schlesinger, et al. 2015), and intestinal tumor development in rodent models (Beyaz, et al. 2016; Day, et al. 2013; Gravaghi, et al. 2008; Hata, et al. 2011; Huffman, et al. 2013; Pettan-Brewer, et al. 2011). Even prior to tumor initiation, obesity appears to ‘prime’ the normal intestinal epithelium toward tumor development, by promoting proliferation of ISCs and hypertrophy of the epithelium (Mao, et al. 2013), while also altering the epigenomic landscape of the colonic epithelium in a manner resembling cancer progression (Li, et al. 2014). Obesity has also been shown to alter the systemic and local microenvironment in the gut, including the microbiome (Cani, et al. 2008), which can create a pro-inflammatory environment in the colon to increase oxidative stress, genome instability, and potential risk of CRC (O’Callaghan, et al. 2009; Pendyala, et al. 2011). More recently, diet-induced obesity was found to increase the number and function of Lgr5+ ISCs, while also promoting stemness and tumorigenicity of progenitor cells after inactivation of Apc (Beyaz et al. 2016). Although obesity can clearly instigate processes related to increase tumor risk, as well as accelerate intestinal tumorigenesis following loss of Apc in ISCs and epithelium (Beyaz et al. 2016; Day et al. 2013; Gravaghi et al. 2008; Hata et al. 2011; Huffman et al. 2013; Pettan-Brewer et al. 2011), whether obesity can promote Lgr5+-ISC-derived tumorigenesis via non-canonical mechanisms involving PI3K signaling (Huang and Chen 2009; Vucenik and Stains 2012), has not been investigated. Here we demonstrate that while obesity can modify the transcriptome of Lgr5+-ISCs and expression of specific metabolic pathways, it fails to alter genes related to the Akt signaling and other proliferative pathways in Lgr5+-ISCs. Further, inactivation of Pten in Lgr5+ ISCs, either alone, or in combination with obesity, is insufficient to drive intestinal pathology and adenoma development in mice. However, we show Pten deletion in Lgr5+-ISCs can synergize with Apc loss to increase tumor multiplicity and worsen survival, demonstrating a previously unappreciated role for enhanced Akt-PI3K signaling, in cooperation with Apc deficiency, to drive Lgr5+-ISC-derived tumorigenesis.
Materials and Methods
Animals
C57BL6/J.129S4-Ptentm1Hwu/J mice (Ptenflox/− stock#006440), C57BL6/J.129P2-Lgr5 tm1(cre/ERT2)Cle/J mice (Lgr5+-GFP; stock#008875) and C57BL6;129S6-Gt(Rosa)26Sor tm14(CAG-tdTomato)Hze mice (Rosa26RFP; stock#007914) were all obtained from Jackson Laboratories (Bar Harbor, ME). Apc580S/580S mice on a C57BL/6 background were a kind gift of Dr. Leonard Augenlicht (Peregrina, et al. 2015). To generate Pten deficiency and/or Apc deficiency in Lgr5+ ISCs, Lgr5+-GFP–Apc580S/−–Ptenflox/− mice were bred with Apc580S/−–Ptenflox/− animals to generate Lgr5+-GFP (Control), Lgr5+-GFP–Apc580S/− (Apc Het), Lgr5+-GFP Ptenflox/flox (Pten KO), Lgr5+-GFP–Apc580S/−–Ptenflox/flox (Apc het–Pten KO), Lgr5+-GFP–Apc580S/580S (Apc KO), and Lgr5+-GFP–Apc580S/580S–Ptenflox/flox (Apc KO–Pten KO) mice. Mice were genotyped as described (Barker et al. 2009; Byun et al. 2011; Peregrina et al. 2015), and males were weaned at 3 wks of age and provided a purified low fat diet (D12450H; Research Diets Inc, New Brunswick, NJ). Animals were maintained under standard temperature and photoperiod as described (Huffman et al. 2013). All experimental procedures were approved by the Einstein Institutional Animal Care and Use Committee.
Experiment 1: Obesity and Lgr5+ intestinal stem cells
At weaning, male Lgr5+-GFP mice were placed on a defined, purified ingredient LFD (3.85Kcal/gm; D12450H). At 7–8 wks of age, animals were randomized to remain on LFD (n=6) or switched to a more energy dense sucrose-matched HFD feeding (n=6) consisting of 45% Kcal from fat with lard as the predominant fat source in lieu of corn starch and maltodextrin, but all other components remained constant (4.73Kcal/gm; D12451; Research Diets Inc, New Brunswick, NJ) until ~ 8 mo of age. At the end of the study, body weight was recorded and animals were sacrificed following a brief 3–4 hr fast for blood collection, and isolation of Lgr5+-ISCs from the small intestine by FACS, as described below, for RNA sequencing analysis.
Experiment 2: Pten deficiency and obesity
In order to determine the role of Pten deficiency on Lgr5+-ISC-derived tumorigenesis under low fat or high fat-fed conditions, 3 mo old male Lgr5+-GFP (Control) and Lgr5+-GFP–Ptenflox/flox (Pten KO) mice were injected intraperitoneally (i.p.) with 1mg tamoxifen (TAM) on two consecutive days in order to induce Cre recombinase in Lgr5+-ISCs. The efficacy of the TAM protocol to induce Cre recombination was confirmed in Lgr5+-GFP–Rosa-reporter mice, as shown in Supplementary Figure S2A–B. Animals were then placed on either a purified LFD or sucrose-matched HFD and monitored for up to 12 mo after injection (15 mo of age) for specimen collection and histopathology.
Experiment 3: Pten and Apc deficiency
It was reported that complete inactivation of Apc in Lgr5+-ISCs led to rapid onset of intestinal adenomas and related mortality (Holik, et al. 2014), while heterozygous deletion of Apc in Lgr5+ ISCs leads to significant pathology within 6 mo of induction (Peregrina et al. 2015). In order to determine if Pten loss in Lgr5+-ISCs can synergize with Apc inactivation, six groups of mice were generated [Lgr5+-GFP (Control), Lgr5+-GFP–Apc580S/− (Apc Het), Lgr5+-GFP Ptenflox/flox (Pten KO), Lgr5+-GFP–Apc580S/−–Ptenflox/flox (Apc het–Pten KO) Lgr5+-GFP–Apc580S/580S(Apc KO), Lgr5+-GFP–Apc580S/580S– Ptenflox/flox (Apc KO–Pten KO)]. Animals were injected with 1mg TAM on two consecutive days at 3–5 mo of age as described above and immediately placed on a purified diet (D12450H). Animals were then monitored for up to 4 mo prior to sacrifice, for tissue collection and histopathology (n=4–13/group) and/or survival (n=9–13/group). Mice were removed prior to 4 mo post-induction if >25% weight loss was observed within a 1 wk period, combined with signs of sickness and lethargy that suggested the animal was unlikely to survive an additional 24–48 hrs longer and this was considered the time of death pending necropsy.
Plasma Insulin and glucose determination
Whole blood was collected from Lgr5+-GFP mice on LFD or HFD following a 3–4 hr fast into K2-EDTA collection tubes (Sarstedt AG & Co; Numbrect, Germany), and immediately centrifuged (1500 × g; 4°C, 15 min) to separate plasma from red blood cells. Plasma Insulin levels were measured by a rat/mouse ELISA (EMD Millipore, Inc) with rat insulin standards using a spectrophotometer (Biorad iMark platereader) following the manufacturer’s instructions. Plasma glucose was determined via the glucose oxidase method with an Analox GM7 analyzer (Analox Inst., USA Inc, Lunenberg, MA), as described (Einstein, et al. 2010; Huffman, et al. 2016; Muzumdar, et al. 2009).
Intestinal histopathology
For evaluation of epithelial cell proliferation and migration in the small intestine, random mice were injected i.p. with 100 mg/kg BrdU (Sigma, St. Louis, MO) 24 hrs prior to sacrifice. At necropsy, the entire intestine was quickly excised, surrounding mesenteric fat removed, and the gut divided into duodenum, jejunum, ileum and colon, as previously described (Huffman et al. 2013). Each segment was opened longitudinally, rinsed in ice-cold phosphate-buffered saline, and carefully flattened for examination of tumor multiplicity with the aid of a dissecting magnifying lens. Macroadenomas (~>0.5mm diameter) when present, were counted in each segment of intestinal tissue and recorded. Tissue was subsequently rolled and fixed overnight in 10% neutral-buffered formalin at 4°C for staging as a swiss roll. Specimens were then processed through a series of alcohols and xylenes, and embedded in paraffin. Hematoxylin & Eosin (H&E) stained sections (5 μm) from each segment of small intestine, capturing the entire proximal to distal length, were subsequently evaluated by a pathologist (A.P.B.), who was blinded to the experimental groups, for histological changes following consensus recommendations for assessing intestinal pathology and tumors in rodents (Boivin, et al. 2003).
3D Organoid Assay
Crypts were isolated from the small intestine of LFD and HFD-fed mice (n=4 group) as described elsewhere (Yilmaz, et al. 2012). Isolated crypts were washed with ADF medium, centrifuged at 800 rpm for 5 min, resuspended in ADF medium, and counted on a hemocytometer. Approximately 250 crypts were then resuspended in 25uL of matrigel, transferred to a 48-well plate to solidify at 37°C for 30 min, and overlaid with 250ul crypt culture medium (ADF 1x, Pen/Strep 1x, HEPES 1x, Glutamax 1x, N2 1x, B27 1x, N-acetyl-L-cysteine 1μM, Noggin 100ng/ml, EGF 50ng/ml, Rock inhibitor 10μM, and R-Spondin 500ng/ml) and maintained at 37°C. Fresh medium was applied every 3 days and the number and area of budding crypts on day 5 and organoid formation on day 9 were assessed with a light microscope and normalized to the beginning number of counted crypts and expressed as organoids per crypt.
Immunohistochemistry
Immunostaining was performed similar to previously described (Huffman, et al. 2007; Huffman, et al. 2008). In brief, intestinal sections were subjected to antigen retrieval (Citrate buffer pH 6) using a pressure cooker on high steam for 10 min. Following rehydration, slides were treated with 3.0% H2O2 for 5 min to quench endogenous peroxidase activity, subjected to an avidin-biotin blocking step (Vector Labs SP-2001), and subsequently blocked with preimmune goat or rabbit serum (1%) for 20 min. Sections were then incubated with an antibody against Ki67 (1:400; cat#12202) pAktSer473 (1:50; cat#4060), phospho- (Ser/Thr) Akt Substrate (1:500; cat#9611), β-catenin (1:100; cat#8480), and anti-BrdU antibody (1:200; cat#5292) from Cell Signaling. A negative control was included in the same run using a subset of slides by omitting primary antibody from the staining procedure. Sections were then incubated with the appropriate biotinylated secondary antibody for 20 min, followed by a streptavidin-HRP detection system (Vector) and application of 3,3′-diaminobenzidine (DAB) for visualization of the antigen-antibody complex (Scytek). Digital files of all slides were then acquired with a PerkinElmer P250 High Capacity Slide Scanner and positive stained cells were analyzed using QuantCenter Software.
Flow cytometry
Lgr5+-GFPHi expressing cells were isolated from LFD and HFD-fed mice (n=6 group) following established methods (36, 76). In brief, cells from isolated crypts were disassociated and subjected to Flow Cytometry (BD™ LSR II flow cytometer, Becton Dickinson Inc) and analyzed with FlowJo software (Tree Star). Cells were gated to select for only Lgr5+-GFPHi expressing ISCs and were sorted directly into Trizol LS to ensure good RNA quality, prior to phenol/chloroform extraction. We routinely isolated ~200,000–300,000 Lgr5-GFPHi expressing ISCs per animal, and purity was confirmed by gene expression of Lgr5 in GFPHi expressing cells versus GFPneg cells using established primers (Munoz, et al. 2012).
Total RNA library preparation and sequencing
RNA sequencing libraries were prepared using the KAPA Stranded RNA-Seq Kit with RiboErase (kapabiosystems) in accordance with the manufacturer’s instructions. Briefly, 100ng of total RNA was used for ribosomal depletion and fragmentation. Depleted RNA underwent first and second strand cDNA synthesis and cDNA was adenylated, ligated to Illumina sequencing adapters, and amplified by PCR (10 cycles). Final libraries were evaluated using fluorescent-based assays, including PicoGreen (Life Technologies), Qubit Fluorometer (invitrogen) and Fragment Analyzer (Advanced Analytics) or BioAnalyzer (Agilent 2100). Deep sequencing (~70M reads) was then performed on samples using an Illumina HiSeq2500 sequencer (v4 chemistry, v2 chemistry for Rapid Run) using 2 × 50bp cycles.
Expression Analysis
Reads were aligned to the Mouse reference mm10 using STAR aligner (v2.4.2a) (Dobin, et al. 2013). Quantification of genes annotated in Gencode vM5 were performed using featureCounts (v1.4.3) and quantification of transcripts using Kalisto (doi:10.1038/nbt.3519). QC was collected with Picard (v1.83) and RSeQC (Wang, et al. 2012) (http://broadinstitute.github.io/picard/). Normalization of feature counts was done using the DESeq2 package, version 1.10.1. (doi:10.1101/002832). Gene set enrichment was performed on genes found differentially expressed between HFD and LFD with a (false discovery rate (FDR) of 5%. Traditional gene set enrichment analysis does not take into account the physical characteristics of the gene and has been shown to be biased by factors such as the length of the gene (Geeleher, et al. 2013). To address this, we used the Bioconductor package GoSeq (Young, et al. 2010) developed to control for variability of length of genes to assess enriched pathways based on the KEGG database (Kyoto Encyclopedia of Genes and Genome). In addition, one sample from the LFD group was determined to be a statistical outlier by PCA and was excluded from the analysis.
Statistics
Parametric data were analyzed by independent sample t-tests or two-way ANOVA, and longitudinal measures were assessed by repeated-measures ANOVA and planned contrasts were performed with Bonferroni adjustment when appropriate. Data were log transformed when necessary to ensure normality of distribution. Non-parametric data were analyzed by the Kruskal-Wallis test and followed up with Mann-Whitney U tests when appropriate. Survival analysis was performed using the Kaplan-Meier procedure and log rank test. All analyses were performed using SPSS (SPSS Inc, Chicago, IL). Experiments were designed to achieve 80% power to detect a mean difference of −1.8 (n=6) to −1.5 (n=8 per group) with a standard deviation of 1.0 and alpha=0.05. For RNAseq, the average expression and standard deviation for each group with n=5–6 samples per group for LFD and HFD respectively, enabled >80% power to detect at least one group expression difference > 2 fold-change at an FDR = 0.05. A P≤0.05 was considered statistically significant for all analyses.
Results
HFD upregulates fatty acid metabolism, but not Akt pathway genes in Lgr5+-ISCs
It was previously established that Akt-related genes are upregulated in the colonic mucosa in obese, tumor-prone mice (Pfalzer, et al. 2016). In order to determine if the Akt pathway is upregulated in Lgr5+-ISCs with obesity in normal mice, we performed RNAseq on isolated Lgr5+ ISCs from LFD and HFD-fed animals. HFD mice were nearly 50% heavier than LFD mice (Fig. 1A; P<0.01), were hyperinsulinemic (Fig. 1B; P<0.01), and hyperglycemic (Fig. 1C; P<0.001). However, employing an ex vivo 3D intestinal organoid assay, previously used to demonstrate increased ISC proliferation by caloric restriction, rapamycin (Yilmaz et al. 2012), as well as obesity (Beyaz et al. 2016), we failed to observe any effect of HFD on ISC proliferation, as compared to LFD controls (Fig. 1D). Lgr5+-ISCs were next isolated by FACS and purity was confirmed by qPCR (Fig. 1D–E). Transcriptome analysis by RNAseq on Lgr5+-ISCs detected 798 differentially-regulated genes between LFD and HFD (adjusted P-value≤0.05; Supp Table S1 Fig. 1F–G). However, the magnitude of differences between differentially-regulated genes between LFD and HFD were mostly limited, and predominantly downregulated in HFD animals (Fig. 1G). To further characterize the overlap between our genes of interest and the Akt pathway, we ran a supervised analysis looking at level of expression and distribution of p values in our samples for genes annotated as part of the Akt pathway in KEGG database (Fig. 1H). Enrichment for a low p value will indicate correlation between diet and Akt Pathway. Enrichment was quantified using the π1 statistic (Storey and Tibshirani 2003). Both, the clustering approach and the π1 statistic confirmed the lack of enrichment for Akt pathway with a π1 score equal to 0 and a random clustering of the samples (Fig. 1H). Likewise, no difference was observed for cancer, MAPK or Wnt pathways between groups (Fig. S1). However, the unbiased analysis implicated several other pathways as differentially regulated, including an upregulation in fatty acid metabolism and PPAR signaling (Fig. 1I), with the latter consistent with a recent report (Beyaz et al. 2016).
Figure 1.

Characterization of the effect of high fat versus low fat diet on Lgr5+-ISC function and gene expression. (A) High fat-fed mice weighed significantly more (P<0.01), (B) and had elevated plasma insulin (P<0.01) and glucose levels (P<0.001) as compared to their low fat-fed counterparts (n=8 per group). (C) Crypts isolated from high fat and low fat-fed mice small intestine did not demonstrate a significant difference in organoid formation at day-9 (n=4 per group), which is expressed as counted organoids, normalized to the starting number of seeded crypts. (D) Lgr5+-GFPHi ISCs were isolated from LFD (n=5) and HFD-fed mice (n=6) by FACS and, (E) expression of Lgr5 in the sorted cells were confirmed by qPCR (P<0.01, n=6 per group). (F) A total of 798 genes were differentially expressed when RNAseq analysis was performed on Lgr5+-ISC isolated from HFD and LFD fed mice (P<0.05). (G) Of the differentially expressed genes between HFD and LFD, most were predominantly downregulated with HFD, as demonstrated by the volcano plot. (H) Akt pathway enrichment was studied using GoSeq and KEGG database, and no significant effect of diet was observed on the enrichment of Akt-related genes between HFD and LFD in isolated Lgr5+-ISCs. (I) Overall analysis showing the dominant differentially regulated pathways in Lgr5+-ISCs of low and high fat fed mice. Interestingly, these pathways were all upregulated with HFD. Bars represent mean±SE. Significantly different as compared to controls, †P<0.01, ‡P<0.01.
Pten inactivation alone, or combined with obesity, is insufficient to drive Lgr5+-ISC-derived tumorigenesis
We next attempted to determine whether Pten serves as an obligate tumor suppressor in Lgr5+-ISCs, and if tumorigenesis could be further augmented by obesity in Pten KO mice. Control and Pten KO male animals were i.p. injected with TAM at 3 mo of age and placed on either a purified sucrose-matched LFD or a 45% HFD and monitored for up to 12 mo after injection (14–15 mo of age). As expected, Control and KO mice on HFD were heavier than their LFD-fed counterparts (Fig. 2A; P<0.001), while Pten deficiency in ISCs per se had no effect on body weight. Intestinal histopathology analysis in these mice revealed that neither HFD nor Pten deficiency per se in Lgr5+-ISCs profoundly altered gut pathology (Table 1). Of note, a reduction in multifocal crypt hyperplasia was observed in Pten KO mice on HFD (P<0.05), but the pathologic relevance of this alteration is unknown as this histologic change was unrelated to the atypical form commonly linked to dysplasia and pre-neoplastic lesions. Sporadic dysplastic foci in the small intestine were identified in 2 LFD and HFD Pten KO mice, respectively, along with one instance of carcinoma and colonic dysplasia in a HFD-fed KO animal. However the frequency of these alterations did not reach significance, while no macroadenomas were observed in these mice. Further, analysis of BrdU labeling in duodenum revealed a significant effect of Pten KO (P<0.001) and diet (P<0.05) on proliferation, but no significant Pten × diet interaction was observed (Fig. 2B). Elsewhere, a main effect for Pten KO was observed in jejunum (P<0.01) and ileum (P<0.001), but diet had no effect on the number of BrdU positive cells. An analysis of pAkt positive staining revealed a significant main effect for Pten inactivation only in duodenum (P=0.05), but no effect of diet or its interaction was observed, nor was any effect observed in other intestinal segments (Fig. 2C).
Figure 2.
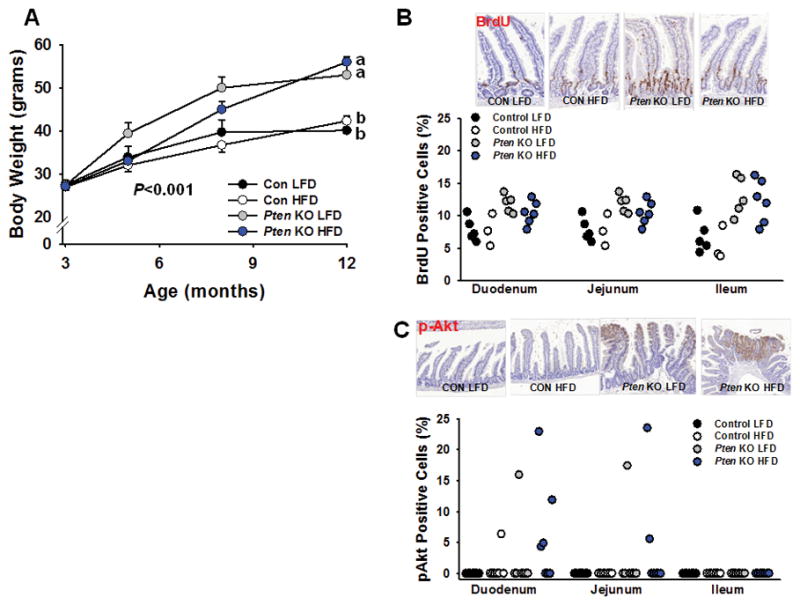
Effect of Pten deletion in Lgr5+-ISCs and obesity on ISC proliferation and Akt signaling in intestine. (A) Mice fed a high fat diet gained significantly more body weight as compared to their low fat-fed counterparts (P<0.001) [Con LFD (n=8), Pten KO LFD (n=9), Con HFD (n=14), Pten KO HFD (n=17)]. Paraffin-embedded sections of small intestine from all 4 groups were immunostained for BrdU after a 24-hour pulse. (B) Two-way ANOVA in duodenum revealed a significant main effect for Pten KO (P<0.001) and diet (P<0.05), but no significant interaction. Similarly, a main effect for Pten KO was observed in jejunum (P<0.01) and ileum (P<0.001), but no effect of diet or its interaction was observed [Con LFD (n=7), Pten KO LFD (n=5), Con HFD (n=3), Pten KO HFD (n=6)](C) Two-way ANOVA for pAkt positive staining revealed a significant main effect for Pten KO only in duodenum (P=0.05), but no effect of diet or its interaction was observed on immunostaining for p-Akt positive cells. [Con LFD (n=7), Pten KO LFD (n=7), Con HFD (n=7), Pten KO HFD (n=7)]. Slides were scanned at 20× and histologic analysis was performed on 250 crypt-villi units in jejunum and ileum, and 100 crypt-villi units in duodenum, per sample in each independent experiment. Different letters denote a significant difference between groups, P<0.01.
Table 1.
Histopathology of the gastrointestinal tract in control and Lgr5+ stem cell specific Pten knockout mice fed either a low fat or high-fat diet
| Low-fat diet | High-fat diet | |||
|---|---|---|---|---|
| Control (n=8) | Pten KO (n=9) | Control (n=14) | Pten KO (n=17) | |
| Hyperplasia, crypt epithelial (Focal)† | 0±0 | 0±0 | 0.14±0.14 | 0.29±0.20 |
| Hyperplasia, crypt epithelial (Multifocal)† | 1.28±0.18a | 1.27±0.25a | 1.07±0.47a | 0.47±0.12b |
| Dysplastic foci‡ | 0±0 | 0.11±0.11 | 0.28±0.13 | 0.29±0.19 |
| Macroadenomas# | 0±0 | 0±0 | 0±0 | 0±0 |
| Carcinomas‡ | 0±0 | 0±0 | 0±0 | 0.06±0.06 |
| Dysplasia, Colon | 0±0 | 0±0 | 0±0 | 0.11±0.08 |
Data are means±SE. Non-parametric data were analyzed by the Kruskal-Wallis non-parametric test planned contrast performed by Mann-Whitney U. A significant effect was observed for multifocal crypt hyperplasia (chi-square=10.2; P=0.017), with a significant reduction in Pten KO mice on HFD. Different letters denote a significant difference between groups, P<0.05.
Value based upon post-mortem analysis of total tumor multiplicity throughout the intestinal tract. Also shown in Fig. 2A.
Value based on the pathologic severity using a 1–4 scale, with 4 being most severe.
Value indicates the number of identified dysplastic foci per section.
Pten deficiency synergizes with Apc inactivation in Lgr5+ ISCs to drive tumorigenesis
Despite the inability of Pten inactivation per se to drive ISC-derived tumorigenesis, Pten inactivation appears to impact ISC proliferation rates. Thus, we next determined if Pten inactivation can have additive or synergistic effects with Apc deficiency on ISC-derived tumor development. To test this possibility, 6 unique models were generated and all animals were TAM treated at 3–5 mo of age and followed for up to 4 mo for effects on tumor development and survival. Pten inactivation or Apc haploinsufficiency alone did not result in the development of pathology within 4 mo (Table 1), while Apc Het–Pten KO mice developed a synergistic rise in dysplastic foci (P<0.05) and macroadenoma formation (Fig. 3A; Table 2). While mild pathology was observed in Apc KO mice, tumor multiplicity and pathology was markedly increased in Apc KO–Pten KO animals (Fig. 3A, Table 2; P<0.05), with significant range in tumor multiplicity, which is a typical observation of aggressive, Apc-deficient tumor models (Gravaghi et al. 2008; Huffman et al. 2013; Taketo and Edelmann 2009). Furthermore, no deaths were observed in WT, Pten KO, Apc Het or Apc KO mice over 16 wks, with the latter observation contrary to prior reports of rapid mortality in Lgr5+ specific, Apc KO mice (Holik et al. 2014). Meanwhile, approximately 40% of Apc Het–Pten KO mice did not survive to 16 wks, while 100% of Apc KO–Pten KO mice did not survive beyond 13 wks after TAM induction.
Figure 3.
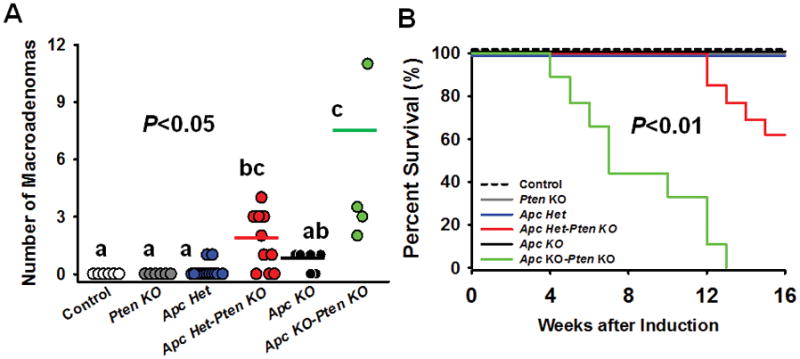
Pten deletion synergizes with Apc deficiency in Lgr5+-ISCs to promote tumorigenesis and worsen survival. Two-way ANOVA for tumor multiplicity revealed a significant main effect for Pten (P<0.001), Apc Het (P<0.01), Apc KO (P<0.01), Pten × Apc Het (P=0.01), and Pten × Apc KO interaction (P=0.001). At necropsy, macroadenoma formation in the small intestine was absent in Control and Pten KO mice while a modest number of tumors were observed in Apc Het and Apc KO animals. However, post hoc analyses confirmed that tumor multiplicity was significantly increased when combining Apc and Pten deficiency in a dose-dependent manner, such thatApc Het–Pten KO mice had increased tumor number, with the greatest evidence of tumor formation in Apc KO–Pten KO animals (P<0.05) [Con (n=6), Pten KO (n=8), Apc het (n=13), Apc Het–Pten KO (n=11) Apc KO (n=6), Apc KO–Pten KO (n=4)] (a). Likewise, while no death was observed in Apc Het or Apc KO mice, significant death began to be observed in Apc Het–Pten KO animals within 3 mo (60% survival to 4 mo), while a severe increase in mortality was observed in Apc KO–PTEN KO within 1 mo, leading to 100% mortality within 3 mo of TAM injection (n=9–13 group; P<0.01) [Con (n=6), Pten KO (n=9), Apc het (n=15), Apc Het–Pten KO (n=13) Apc KO (n=10), Apc KO–Pten KO (n=9)] (b). For macroadenomas, different letters denote a significant difference between groups with Bonferonni adjustment (P<0.05).
Table 2.
Histopathology of the gastrointestinal tract in control and Lgr5+ stem cell specific Apc and Pten inactivation
| Control (n=6) | Pten KO (n=8) | Apc Het (n=13) | Apc Het-Pten KO (n=11) | Apc KO (n=6) | Apc KO-Pten KO (n=4) | |
|---|---|---|---|---|---|---|
| Hyperplasia, crypt epithelial (Focal)† | 0±0 | 0.38±0.38 | 0.23±0.21 | 0.29±0.20 | 1.50±0.50 | 0±0 |
| Hyperplasia, crypt epithelial (Multifocal)† | 0.67±0.18b | 0.50±0.27b | 0.61±0.17b | 0±0a | 0.67±0.49b | 2.5±0.65c |
| Dysplasic foci ‡ | 0±0a | 0±0a | 0±0a | 0.83±0.15b | 1.00±0.21ab | 4.25±1.10c |
| Macroadenomas# | 0±0a | 0±0a | 0.13±0.13a | 0.38±0.15a | 0±0a | 2.0±0.4b |
| Carcinomas‡ | 0±0 | 0±0 | 0±0 | 0.38±0.15 | 0±0 | 0.25±0.25 |
| Dysplasia, Colon | 0±0 | 0±0 | 0.08±0.08 | 0.13±0.10 | 0±0 | 0±0 |
Data are means±SE. Non-parametric data were analyzed by the Kruskal-Wallis non-parametric test planned contrast performed by Mann-Whitney U. A significant effect was observed for multifocal crypt hyperplasia (chi-square=17.8; P=0.003), dysplastic foci (chi-square=16.7; P=0.005) and macroadenoma (chi-square=27.8; P<0.001), Different letters denote a significant difference between groups, P<0.05.
Value based upon post-mortem analysis of total tumor multiplicity throughout the intestinal tract. Also shown in Fig. 2A.
Value based on the pathologic severity using a 1–4 scale, with 4 being most severe.
Value indicates the number of identified dysplastic foci per section.
Pten and Apc deficiency selectively increase proliferative markers in intestine
In order to determine the independent and combined effect of Apc and Pten inactivation in ISCs on proliferative markers in the intestine, we next stained for Ki67, β-catenin, and pAkt. In duodenum, a significant main effect of Apc deletion on Ki-67 positive cells was found (P<0.05), while in Ileum, a main effect for Pten KO (P<0.01), Apc KO (P<0.01), and Pten × Apc Het interaction (P<0.05) was observed, but no difference was observed between groups (Fig. 4A). Nuclear β-catenin localization, which is an indicator of dysregulated Wnt signaling, was unaffected by Pten or Apc inactivation alone, but was significantly augmented by combined Pten and Apc deficiency in duodenum and jejunum (Fig. 4B; P<0.05). Consistent with Experiment 2, Pten deletion alone did not significantly increase cytoplasmic pAkt staining in intestine, nor was Akt activation affected by Apc loss per se, but staining was augmented when Pten inactivation was combined with Apc haploinsufficiency or deficiency in duodenum and jejunum (Fig. 4C; P<0.05). This was confirmed by immunostaining for Akt substrate in intestinal segments, which was lower in controls, but strong staining was present in Apc Het–Pten KO and Apc KO–Pten KO mice (Supplementary Figure S3; n=3 per group).
Figure 4.
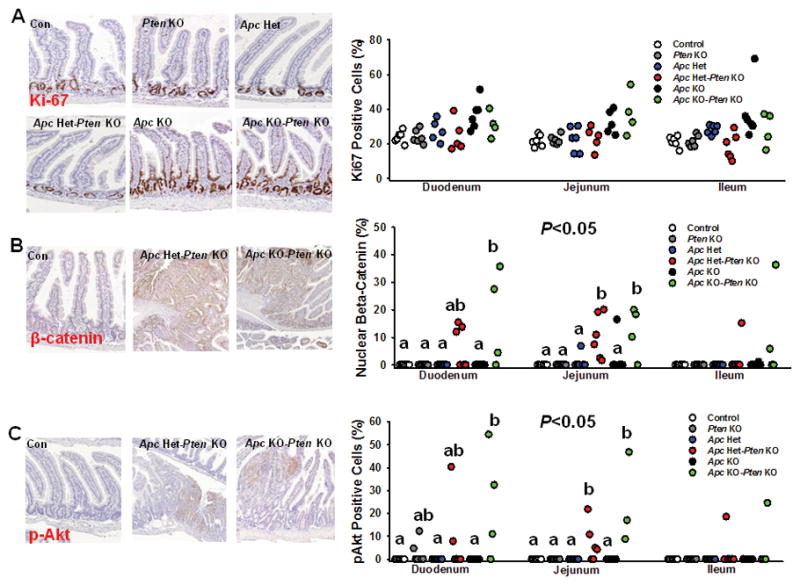
The effect of Pten and/or Apc deficiency in Lgr5+-ISCs on intestinal proliferative markers. Paraffin-embedded sections of small intestine in all 6 groups [Con (n=6), Pten KO (n=6), Apc het (n=5–6), Apc Het–Pten KO (n=5–6) Apc KO (n=6), Apc KO–Pten KO (n=4)] were immunostained for markers of Akt signaling and proliferation. (A) In duodenum, a significant a main effect of Apc deletion on Ki-67 positive cells was observed for Apc KO (P<0.05), while in Ileum, a main effect for Pten KO (P<0.01), Apc KO (P<0.01), and Pten × Apc Het interaction (P<0.05) was observed, but no significant difference among groups was found (B) Nuclear β-catenin localization, which is an indicator of dysregulated Wnt signaling, was significantly higher with combined Pten and Apc deficiency in duodenum and jejunum, but not with Apc or Pten inactivation per se [Duodenum main effect for Pten KO (P<0.01), Apc KO (P<0.01) and Pten × Apc KO interaction (P<0.05); Jejunum main effect for Pten KO (P<0.001), Apc Het (P<0.01), Apc KO (P<0.01), Pten × Apc Het (P<0.05), and Pten × Apc KO interaction (P<0.05). (C) Pten deletion alone failed to significantly increase cytoplasmic pAkt staining, but staining was augmented when combined with Apc haploinsufficiency or deficiency in duodenum and jejunum (Duodenum main effect for Pten KO (P<0.01), Apc KO (P<0.05) and Pten × Apc KO interaction (P<0.05); Jejunum main effect for Pten KO (P<0.001), Apc Het (P<0.05), Apc KO (P<0.01), Pten × Apc Het (P<0.05), and Pten × Apc KO interaction (P<0.05). Slides were scanned at 20× and histologic analysis was performed on 250 crypt-villi units in jejunum and ileum, and 100 crypt-villi units in duodenum, per sample in each independent experiment. Different letters denote a significant difference within an intestinal segment after Bonferonni adjustment, P<0.05.
Discussion
There has been an intense interest in both the origin and natural history of colorectal cancer onset and progression. Loss of Apc has been viewed as an important initiating, and often required event in disease pathogenesis, with additional mutations in p53, Kras, and the PI3K-Akt pathway among others, as necessary to promoting advanced disease (Huels and Sansom 2015). Further, studies have demonstrated that Apc inactivation in several ISC populations can give rise to tumors (Barker et al. 2009; Powell et al. 2014; Sangiorgi and Capecchi 2008), supporting the ‘bottom-up’ model of tumorigenesis, whereby dysplastic cells originate from ISCs in the crypt base rather than the villus. However, to what extent mutations affecting non-canonical signaling pathways such as the PI3K-Akt pathway in Lgr5+-ISCs, can accelerate disease pathogenesis, has not been studied.
Here we demonstrate that in the absence of Apc mutations, inactivation of Pten per se in Lgr5+-ISCs, either alone, or in combination with obesity, does not substantially alter intestinal homeostasis and is insufficient to drive tumorigenesis, suggesting that Pten is dispensable as a tumor suppressor in these cells. This is in partial agreement with another report showing that Kras activation per se in Lgr5+-ISCs could result in hyperplasia, but failed to induce dysplasia or adenoma development (Feng, et al. 2011). Given that Pten knockout animals were not examined until 14–15 mo of age, nearly 12 mo after Cre induction, it is unlikely that the lack of observed transformation in these mice was confounded by the reportedly long latency of disease onset in Pten-deficient animals (Knobbe, et al. 2008). Likewise, RNAseq confirmed high expression of Pten in Lgr5+-ISCs (not shown) while Insulin receptor, IGF-1 receptor expression, as well as insulin receptor substrates 1 and 2 were also present in these cells, suggesting that the insulin/IGF-1 signaling pathway and Pten may be integral to cellular function in Lgr5+-ISCs.
Genetic and epigenetic alterations that lead to dysregulated PI3K-Akt signaling, including those affecting Pten function, have been reported in human colon cancers (Liao, et al. 2012; Ogino, et al. 2014). However, in animal models, the effect of Pten inactivation in intestinal homeostasis has been somewhat controversial. Some reports observed that loss of Pten in the gut (Byun et al. 2011; He, et al. 2007; Yu, et al. 2014) or whole body (Di Cristofano, et al. 1998), is sufficient to drive intestinal pathology and tumorigenesis, but others have failed to observe any such effect of Pten loss alone on disease pathogenesis (Langlois et al. 2009; Marsh et al. 2008). The reason for these discrepant reports involving Pten-inactivating mutations is not entirely clear, but may involve the diversity in promoters (Rosa, Ah-cre, Vil-cre, Vil-cre/ERT2), genetic backgrounds, and time of follow up (5 days, 50 days, 1 year) used. For instance, using the Vil-cre mouse to delete Pten throughout the gut epithelium with 1 year follow up (Langlois et al. 2009), resulted in hypertrophy and proliferation of the mucosa, but in contrast to prior reports (Di Cristofano et al. 1998), no evidence of tumors were detected. This contrary finding was speculated to potentially involve Pten deletion being restricted to the epithelium, and not the stroma. However, a later report using the same Vil-cre promoter and follow-up period, but different genetic background, reported intestinal tumors in 19% of mice (Byun et al. 2011). If intestinal tumors can in fact arise from ISCs following an inactivation mutation in Pten, our results suggest that Lgr5+ ISCs are unlikely to be the site of origin. However, we cannot rule out an effect of Pten loss in other epithelial cells, stromal cells, as well as other ISC populations (Bmi1+, Lrig1+) or progenitor cells (TA cells) to instigate tumorigenesis.
Obesity per se has also been shown to increase intestinal proliferation (Mao et al. 2013), and data from our lab and others have shown that HFD can exacerbate tumorigenesis in several Apc models (Day et al. 2013; Gravaghi et al. 2008; Hata et al. 2011; Huffman et al. 2013; Pettan-Brewer et al. 2011), including Apc-deficient Lgr5+-ISCs (Beyaz et al. 2016). However, even when combined with obesity, Pten deficiency per se in Lgr5-ISCs, in the absence of Apc mutations, is insufficient to drive adenoma formation in these mice, even up to 15 mo of age. Because spontaneous intestinal tumor development in normal mice is exceedingly rare, these data by no means suggest that obesity per se is not a risk factor for tumor development, but rather that additional mutations besides Pten (i.e. Apc) in ISCs are required for obesity-induced transformation and tumor progression in mice. Indeed, overwhelming evidence in humans has implicated obesity, and particularly visceral obesity, as strong regulators of CRC risk and progression in humans (Bardou et al. 2013; Cheskin and Prosser 2007; Giovannucci and Michaud 2007; Kim et al. 2006; Pischon et al. 2006; Schlesinger et al. 2015), including greater risk of CRC-related mortality (Calle, et al. 2003).
Interestingly, in contrast to prior reports (Beyaz et al. 2016; Mao et al. 2013), we surprisingly did not observe any increase in ISC proliferation by obesity, as determined by intestinal organoid assay or BrdU labeling studies, although caution should be exercised for results involving the latter assay, due to a limited sample size for control HFD mice. In addition, a transcriptome analysis of Lgr5+ ISCs from LFD and HFD-fed mice did not detect any effect on growth and proliferation-related pathways (Akt, MAPK, Cancer, Wnt). Instead, the major pathways affected by obesity in these cells involved fatty acid metabolism, propanoate metabolism, and PPAR signaling among others, with the latter observation consistent with a prior report implicating PPAR-delta in the effects of HFD on Lgr5+-ISCs (Beyaz et al. 2016).
A definitive explanation for some discordant results between our model and prior models is not entirely clear, but it is noteworthy that our study utilized a well-matched, purified and defined control companion diet for comparison, while many other studies have utilized standard rodent chow-based diets as a control-feeding regimen. While mice maintained on standard chow do remain leaner than their HFD counterparts, mouse chow also harbors a poorly-defined concentration of macro- and micronutrients, as well as elevated fiber and vitamin D, and the amount of these components can vary greatly among batches. Many of these constituents have important biologic activities, particularly in the gut, including effects on growth and differentiation pathways, the microbiome (Desai, et al. 2016) and tumorigenesis (Augenlicht 2014). Thus, the inherent contribution of obesity in reports using chow as a control, particularly in the gut, should be interpreted with caution, given the stark differences in dietary composition between these formulas.
Given the evidence that Pten and Apc can synergize in the intestinal epithelium to promote tumorigenesis, we next performed a gene dosage experiment in Lgr5+-ISCs by combining Pten deficiency with either Apc heterozygous or homozygous deletion. We observed a dose-dependent, synergistic rise in tumors along with accelerated mortality in double knock out mice. Indeed, while significant pathology and lethality was noted in combined Apc heterozygosity and Pten loss, observed effects on intestinal pathology and survival were far more extensive when combined with complete Apc inactivation in Lgr5+-ISCs. These findings are somewhat in agreement with other models which have found that inactivation of Apc or Pten throughout the intestinal epithelium augments Wnt/β-catenin driven tumor formation (He et al. 2007), though our results suggest far greater dysregulation when both genes are completely inactivated. The rapidity of disease onset and death in mice lacking Pten and Apc only in Lgr5+-ISCs was comparable to those reported by combined deficiency throughout the gut epithelium (Marsh et al. 2008), suggesting that Lgr5+-ISCs are a key site of tumor initiation by combined dysregulation of Wnt/β-catenin and PI3K signaling. Likewise, the necessity for combined Pten and Apc loss to augment Akt activation was also consistent with prior observations in the intestine (Marsh et al. 2008). Collectively, these data confirm that Pten alone is dispensable as a tumor suppressor in Lgr5+-ISCs when Apc is present, while Pten plays a tumor-suppressive role when Apc is lost in Lgr5+-ISCs.
In summary, we show that Pten loss per se in Lgr5-ISCs is not required either as a tumor suppressor or for maintaining intestinal homeostasis when Apc is functional, even when combined with obesity. Further, obesity leads to modest alterations in the Lgr5+-ISC transcriptome, and augments fatty acid-related pathways in Lgr5+-ISCs, but does not alter Akt signaling related genes in these cells. In contrast, Pten loss per se in Lgr5+-ISCs, but not diet, explained alterations to intestinal proliferation and Akt signaling. While Apc inactivation was required to induce tumorigenesis in the intestine, disease severity and mortality were synergistically increased when this was further combined with Pten deficiency in Lgr5+-ISCs. Thus, these data demonstrate that Lgr5+-ISCs are an important site of Pten and Apc deficiency and establish the importance of Pten in the control of PI3K/Akt signaling in these cells to prevent accelerated disease progression by canonical pathways involved in intestinal tumorigenesis.
Supplementary Material
(A) Using Rosa (B) MAPK or (C) Wnt associated KEGG pathways between high fat- and low fat-fed mice.
(A) Using Rosa tomato red reporter mice (Rosa26RFP) crossed with Lgr5 tm1(cre/ERT2)Cle/J mice, appearance of red-labeled cells three days after TAM injection (1mg i.p. on two consecutive days) in jejunum and colon confirms efficiency of recombination arise from Lgr5+ stem cells (green) which express Cre. Also note the mosaic expression of the Lgr5 transgene in the gut. (B) Additional images showing appearance of progeny (red cells) in various segments of the gut three days after TAM.
Increased Akt substrate staining which only modestly stained in Control animals, but strong and widespread staining was present in Apc Het–Pten KO and Apc KO–Pten KO mice (n=3 per group), which was confirmatory of observed pAkt immunostaining in these mice.
Acknowledgments
This work was supported by the NIA (R00AG037574, R56AG052981), the Prevent Cancer Foundation, the American Institute for Cancer Research (AICR), the American Federation for Aging Research (AFAR) and Einstein Startup Funds to D.M.H. The authors would also like to acknowledge that experiments in the Einstein Analytical Imaging Core were supported by an NIH SIG award (#1S10OD019961-01). We would also like to acknowledge Ms. Jinghang Zhang in the Einstein Flow Cytometry Core Facility for technical assistance, the Einstein Computational Genomic Core for its support, and the NCI supported Einstein Cancer Center which provides partial support for the Flow Cytometry Core (P30CA013330). The authors have no conflict of interest to disclose that could be perceived as prejudicing the impartiality of the research reported.
References
- Augenlicht L. Hidden effects of mouse chow. Science. 2014;346:710. doi: 10.1126/science.346.6210.710-a. [DOI] [PubMed] [Google Scholar]
- Bardou M, Barkun AN, Martel M. Obesity and colorectal cancer. Gut. 2013;62:933–947. doi: 10.1136/gutjnl-2013-304701. [DOI] [PubMed] [Google Scholar]
- Barker N, Ridgway RA, van Es JH, van de Wetering M, Begthel H, van den Born M, Danenberg E, Clarke AR, Sansom OJ, Clevers H. Crypt stem cells as the cells-of-origin of intestinal cancer. Nature. 2009;457:608–611. doi: 10.1038/nature07602. [DOI] [PubMed] [Google Scholar]
- Beyaz S, Mana MD, Roper J, Kedrin D, Saadatpour A, Hong SJ, Bauer-Rowe KE, Xifaras ME, Akkad A, Arias E, et al. High-fat diet enhances stemness and tumorigenicity of intestinal progenitors. Nature. 2016;531:53–58. doi: 10.1038/nature17173. [DOI] [PMC free article] [PubMed] [Google Scholar]
- Boivin GP, Washington K, Yang K, Ward JM, Pretlow TP, Russell R, Besselsen DG, Godfrey VL, Doetschman T, Dove WF, et al. Pathology of mouse models of intestinal cancer: consensus report and recommendations. Gastroenterology. 2003;124:762–777. doi: 10.1053/gast.2003.50094. [DOI] [PubMed] [Google Scholar]
- Byun DS, Ahmed N, Nasser S, Shin J, Al-Obaidi S, Goel S, Corner GA, Wilson AJ, Flanagan DJ, Williams DS, et al. Intestinal epithelial-specific PTEN inactivation results in tumor formation. Am J Physiol Gastrointest Liver Physiol. 2011;301:G856–864. doi: 10.1152/ajpgi.00178.2011. [DOI] [PMC free article] [PubMed] [Google Scholar]
- Calle EE, Rodriguez C, Walker-Thurmond K, Thun MJ. Overweight, obesity, and mortality from cancer in a prospectively studied cohort of U.S. adults. N Engl J Med. 2003;348:1625–1638. doi: 10.1056/NEJMoa021423. [DOI] [PubMed] [Google Scholar]
- Cani PD, Bibiloni R, Knauf C, Waget A, Neyrinck AM, Delzenne NM, Burcelin R. Changes in gut microbiota control metabolic endotoxemia-induced inflammation in high-fat diet-induced obesity and diabetes in mice. Diabetes. 2008;57:1470–1481. doi: 10.2337/db07-1403. [DOI] [PubMed] [Google Scholar]
- Cheskin LJ, Prosser BJ. Obesity and the risk of colon polyps. J Clin Gastroenterol. 2007;41:229–230. doi: 10.1097/01.mcg.0000248020.54256.b0. [DOI] [PubMed] [Google Scholar]
- Day SD, Enos RT, McClellan JL, Steiner JL, Velazquez KT, Murphy EA. Linking inflammation to tumorigenesis in a mouse model of high-fat-diet-enhanced colon cancer. Cytokine. 2013;64:454–462. doi: 10.1016/j.cyto.2013.04.031. [DOI] [PMC free article] [PubMed] [Google Scholar]
- Deming DA, Leystra AA, Nettekoven L, Sievers C, Miller D, Middlebrooks M, Clipson L, Albrecht D, Bacher J, Washington MK, et al. PIK3CA and APC mutations are synergistic in the development of intestinal cancers. Oncogene. 2014;33:2245–2254. doi: 10.1038/onc.2013.167. [DOI] [PMC free article] [PubMed] [Google Scholar]
- Desai MS, Seekatz AM, Koropatkin NM, Kamada N, Hickey CA, Wolter M, Pudlo NA, Kitamoto S, Terrapon N, Muller A, et al. A Dietary Fiber-Deprived Gut Microbiota Degrades the Colonic Mucus Barrier and Enhances Pathogen Susceptibility. Cell. 2016;167:1339–1353. e1321. doi: 10.1016/j.cell.2016.10.043. [DOI] [PMC free article] [PubMed] [Google Scholar]
- Di Cristofano A, Pesce B, Cordon-Cardo C, Pandolfi PP. Pten is essential for embryonic development and tumour suppression. Nat Genet. 1998;19:348–355. doi: 10.1038/1235. [DOI] [PubMed] [Google Scholar]
- Dobin A, Davis CA, Schlesinger F, Drenkow J, Zaleski C, Jha S, Batut P, Chaisson M, Gingeras TR. STAR: ultrafast universal RNA-seq aligner. Bioinformatics. 2013;29:15–21. doi: 10.1093/bioinformatics/bts635. [DOI] [PMC free article] [PubMed] [Google Scholar]
- Einstein FH, Huffman DM, Fishman S, Jerschow E, Heo HJ, Atzmon G, Schechter C, Barzilai N, Muzumdar RH. Aging per se increases the susceptibility to free fatty acid-induced insulin resistance. J Gerontol A Biol Sci Med Sci. 2010;65:800–808. doi: 10.1093/gerona/glq078. [DOI] [PMC free article] [PubMed] [Google Scholar]
- Feng Y, Bommer GT, Zhao J, Green M, Sands E, Zhai Y, Brown K, Burberry A, Cho KR, Fearon ER. Mutant KRAS promotes hyperplasia and alters differentiation in the colon epithelium but does not expand the presumptive stem cell pool. Gastroenterology. 2011;141:1003–1013. e1001–1010. doi: 10.1053/j.gastro.2011.05.007. [DOI] [PMC free article] [PubMed] [Google Scholar]
- Geeleher P, Hartnett L, Egan LJ, Golden A, Raja Ali RA, Seoighe C. Gene-set analysis is severely biased when applied to genome-wide methylation data. Bioinformatics. 2013;29:1851–1857. doi: 10.1093/bioinformatics/btt311. [DOI] [PubMed] [Google Scholar]
- Giovannucci E, Michaud D. The role of obesity and related metabolic disturbances in cancers of the colon, prostate, and pancreas. Gastroenterology. 2007;132:2208–2225. doi: 10.1053/j.gastro.2007.03.050. [DOI] [PubMed] [Google Scholar]
- Gravaghi C, Bo J, Laperle KM, Quimby F, Kucherlapati R, Edelmann W, Lamprecht SA. Obesity enhances gastrointestinal tumorigenesis in Apc-mutant mice. Int J Obes (Lond) 2008;32:1716–1719. doi: 10.1038/ijo.2008.149. [DOI] [PubMed] [Google Scholar]
- Hata K, Kubota M, Shimizu M, Moriwaki H, Kuno T, Tanaka T, Hara A, Hirose Y. C57BL/KsJ-db/db-Apc mice exhibit an increased incidence of intestinal neoplasms. Int J Mol Sci. 2011;12:8133–8145. doi: 10.3390/ijms12118133. [DOI] [PMC free article] [PubMed] [Google Scholar]
- He XC, Yin T, Grindley JC, Tian Q, Sato T, Tao WA, Dirisina R, Porter-Westpfahl KS, Hembree M, Johnson T, et al. PTEN-deficient intestinal stem cells initiate intestinal polyposis. Nat Genet. 2007;39:189–198. doi: 10.1038/ng1928. [DOI] [PMC free article] [PubMed] [Google Scholar]
- Holik AZ, Young M, Krzystyniak J, Williams GT, Metzger D, Shorning BY, Clarke AR. Brg1 loss attenuates aberrant wnt-signalling and prevents wnt-dependent tumourigenesis in the murine small intestine. PLoS Genet. 2014;10:e1004453. doi: 10.1371/journal.pgen.1004453. [DOI] [PMC free article] [PubMed] [Google Scholar]
- Huang XF, Chen JZ. Obesity, the PI3K/Akt signal pathway and colon cancer. Obes Rev. 2009;10:610–616. doi: 10.1111/j.1467-789X.2009.00607.x. [DOI] [PubMed] [Google Scholar]
- Huels DJ, Sansom OJ. Stem vs non-stem cell origin of colorectal cancer. Br J Cancer. 2015;113:1–5. doi: 10.1038/bjc.2015.214. [DOI] [PMC free article] [PubMed] [Google Scholar]
- Huffman DM, Augenlicht LH, Zhang X, Lofrese JJ, Atzmon G, Chamberland JP, Mantzoros CS. Abdominal obesity, independent from caloric intake, accounts for the development of intestinal tumors in Apc(1638N/+) female mice. Cancer Prev Res (Phila) 2013;6:177–187. doi: 10.1158/1940-6207.CAPR-12-0414. [DOI] [PMC free article] [PubMed] [Google Scholar]
- Huffman DM, Farias Quipildor G, Mao K, Zhang X, Wan J, Apontes P, Cohen P, Barzilai N. Central insulin-like growth factor-1 (IGF-1) restores whole-body insulin action in a model of age-related insulin resistance and IGF-1 decline. Aging Cell. 2016;15:181–186. doi: 10.1111/acel.12415. [DOI] [PMC free article] [PubMed] [Google Scholar]
- Huffman DM, Grizzle WE, Bamman MM, Kim JS, Eltoum IA, Elgavish A, Nagy TR. SIRT1 is significantly elevated in mouse and human prostate cancer. Cancer Res. 2007;67:6612–6618. doi: 10.1158/0008-5472.CAN-07-0085. [DOI] [PubMed] [Google Scholar]
- Huffman DM, Moellering DR, Grizzle WE, Stockard CR, Johnson MS, Nagy TR. Effect of exercise and calorie restriction on biomarkers of aging in mice. Am J Physiol Regul Integr Comp Physiol. 2008;294:R1618–1627. doi: 10.1152/ajpregu.00890.2007. [DOI] [PMC free article] [PubMed] [Google Scholar]
- Kim S, Baron JA, Mott LA, Burke CA, Church TR, McKeown-Eyssen GE, Cole BF, Haile RW, Sandler RS. Aspirin may be more effective in preventing colorectal adenomas in patients with higher BMI (United States) Cancer Causes Control. 2006;17:1299–1304. doi: 10.1007/s10552-006-0075-x. [DOI] [PubMed] [Google Scholar]
- Knobbe CB, Lapin V, Suzuki A, Mak TW. The roles of PTEN in development, physiology and tumorigenesis in mouse models: a tissue-by-tissue survey. Oncogene. 2008;27:5398–5415. doi: 10.1038/onc.2008.238. [DOI] [PubMed] [Google Scholar]
- Langlois MJ, Roy SA, Auclair BA, Jones C, Boudreau F, Carrier JC, Rivard N, Perreault N. Epithelial phosphatase and tensin homolog regulates intestinal architecture and secretory cell commitment and acts as a modifier gene in neoplasia. FASEB J. 2009;23:1835–1844. doi: 10.1096/fj.08-123125. [DOI] [PubMed] [Google Scholar]
- Leystra AA, Deming DA, Zahm CD, Farhoud M, Olson TJ, Hadac JN, Nettekoven LA, Albrecht DM, Clipson L, Sullivan R, et al. Mice expressing activated PI3K rapidly develop advanced colon cancer. Cancer Res. 2012;72:2931–2936. doi: 10.1158/0008-5472.CAN-11-4097. [DOI] [PMC free article] [PubMed] [Google Scholar]
- Li R, Grimm SA, Chrysovergis K, Kosak J, Wang X, Du Y, Burkholder A, Janardhan K, Mav D, Shah R, et al. Obesity, rather than diet, drives epigenomic alterations in colonic epithelium resembling cancer progression. Cell Metab. 2014;19:702–711. doi: 10.1016/j.cmet.2014.03.012. [DOI] [PMC free article] [PubMed] [Google Scholar]
- Liao X, Morikawa T, Lochhead P, Imamura Y, Kuchiba A, Yamauchi M, Nosho K, Qian ZR, Nishihara R, Meyerhardt JA, et al. Prognostic role of PIK3CA mutation in colorectal cancer: cohort study and literature review. Clin Cancer Res. 2012;18:2257–2268. doi: 10.1158/1078-0432.CCR-11-2410. [DOI] [PMC free article] [PubMed] [Google Scholar]
- Mao J, Hu X, Xiao Y, Yang C, Ding Y, Hou N, Wang J, Cheng H, Zhang X. Overnutrition stimulates intestinal epithelium proliferation through beta-catenin signaling in obese mice. Diabetes. 2013;62:3736–3746. doi: 10.2337/db13-0035. [DOI] [PMC free article] [PubMed] [Google Scholar]
- Marsh V, Winton DJ, Williams GT, Dubois N, Trumpp A, Sansom OJ, Clarke AR. Epithelial Pten is dispensable for intestinal homeostasis but suppresses adenoma development and progression after Apc mutation. Nat Genet. 2008;40:1436–1444. doi: 10.1038/ng.256. [DOI] [PubMed] [Google Scholar]
- Munoz J, Stange DE, Schepers AG, van de Wetering M, Koo BK, Itzkovitz S, Volckmann R, Kung KS, Koster J, Radulescu S, et al. The Lgr5 intestinal stem cell signature: robust expression of proposed quiescent ‘+4’ cell markers. EMBO J. 2012;31:3079–3091. doi: 10.1038/emboj.2012.166. [DOI] [PMC free article] [PubMed] [Google Scholar]
- Muzumdar RH, Huffman DM, Atzmon G, Buettner C, Cobb LJ, Fishman S, Budagov T, Cui L, Einstein FH, Poduval A, et al. Humanin: a novel central regulator of peripheral insulin action. PLoS One. 2009;4:e6334. doi: 10.1371/journal.pone.0006334. [DOI] [PMC free article] [PubMed] [Google Scholar]
- O’Callaghan NJ, Clifton PM, Noakes M, Fenech M. Weight loss in obese men is associated with increased telomere length and decreased abasic sites in rectal mucosa. Rejuvenation Res. 2009;12:169–176. doi: 10.1089/rej.2008.0819. [DOI] [PubMed] [Google Scholar]
- Ogino S, Lochhead P, Giovannucci E, Meyerhardt JA, Fuchs CS, Chan AT. Discovery of colorectal cancer PIK3CA mutation as potential predictive biomarker: power and promise of molecular pathological epidemiology. Oncogene. 2014;33:2949–2955. doi: 10.1038/onc.2013.244. [DOI] [PMC free article] [PubMed] [Google Scholar]
- Pendyala S, Neff LM, Suarez-Farinas M, Holt PR. Diet-induced weight loss reduces colorectal inflammation: implications for colorectal carcinogenesis. Am J Clin Nutr. 2011;93:234–242. doi: 10.3945/ajcn.110.002683. [DOI] [PMC free article] [PubMed] [Google Scholar]
- Peregrina K, Houston M, Daroqui C, Dhima E, Sellers RS, Augenlicht LH. Vitamin D is a determinant of mouse intestinal Lgr5 stem cell functions. Carcinogenesis. 2015;36:25–31. doi: 10.1093/carcin/bgu221. [DOI] [PMC free article] [PubMed] [Google Scholar]
- Pettan-Brewer C, Morton J, Mangalindan R, Ladiges W. Curcumin suppresses intestinal polyps in APC Min mice fed a high fat diet. Pathobiol Aging Age Relat Dis. 2011:1. doi: 10.3402/pba.v1i0.7013. [DOI] [PMC free article] [PubMed] [Google Scholar]
- Pfalzer AC, Kamanu FK, Parnell LD, Tai AK, Liu Z, Mason JB, Crott JW. Interactions between the colonic transcriptome, metabolome, and microbiome in mouse models of obesity-induced intestinal cancer. Physiol Genomics. 2016;48:545–553. doi: 10.1152/physiolgenomics.00034.2016. [DOI] [PubMed] [Google Scholar]
- Pischon T, Lahmann PH, Boeing H, Friedenreich C, Norat T, Tjonneland A, Halkjaer J, Overvad K, Clavel-Chapelon F, Boutron-Ruault MC, et al. Body size and risk of colon and rectal cancer in the European Prospective Investigation Into Cancer and Nutrition (EPIC) J Natl Cancer Inst. 2006;98:920–931. doi: 10.1093/jnci/djj246. [DOI] [PubMed] [Google Scholar]
- Powell AE, Vlacich G, Zhao ZY, McKinley ET, Washington MK, Manning HC, Coffey RJ. Inducible loss of one Apc allele in Lrig1-expressing progenitor cells results in multiple distal colonic tumors with features of familial adenomatous polyposis. Am J Physiol Gastrointest Liver Physiol. 2014;307:G16–23. doi: 10.1152/ajpgi.00358.2013. [DOI] [PMC free article] [PubMed] [Google Scholar]
- Sangiorgi E, Capecchi MR. Bmi1 is expressed in vivo in intestinal stem cells. Nat Genet. 2008;40:915–920. doi: 10.1038/ng.165. [DOI] [PMC free article] [PubMed] [Google Scholar]
- Schlesinger S, Lieb W, Koch M, Fedirko V, Dahm CC, Pischon T, Nothlings U, Boeing H, Aleksandrova K. Body weight gain and risk of colorectal cancer: a systematic review and meta-analysis of observational studies. Obes Rev. 2015;16:607–619. doi: 10.1111/obr.12286. [DOI] [PubMed] [Google Scholar]
- Shao J, Washington MK, Saxena R, Sheng H. Heterozygous disruption of the PTEN promotes intestinal neoplasia in APCmin/+ mouse: roles of osteopontin. Carcinogenesis. 2007;28:2476–2483. doi: 10.1093/carcin/bgm186. [DOI] [PubMed] [Google Scholar]
- Storey JD, Tibshirani R. Statistical significance for genomewide studies. Proc Natl Acad Sci U S A. 2003;100:9440–9445. doi: 10.1073/pnas.1530509100. [DOI] [PMC free article] [PubMed] [Google Scholar]
- Taketo MM, Edelmann W. Mouse models of colon cancer. Gastroenterology. 2009;136:780–798. doi: 10.1053/j.gastro.2008.12.049. [DOI] [PubMed] [Google Scholar]
- Vucenik I, Stains JP. Obesity and cancer risk: evidence, mechanisms, and recommendations. Ann N Y Acad Sci. 2012;1271:37–43. doi: 10.1111/j.1749-6632.2012.06750.x. [DOI] [PMC free article] [PubMed] [Google Scholar]
- Wang L, Wang S, Li W. RSeQC: quality control of RNA-seq experiments. Bioinformatics. 2012;28:2184–2185. doi: 10.1093/bioinformatics/bts356. [DOI] [PubMed] [Google Scholar]
- Yilmaz OH, Katajisto P, Lamming DW, Gultekin Y, Bauer-Rowe KE, Sengupta S, Birsoy K, Dursun A, Yilmaz VO, Selig M, et al. mTORC1 in the Paneth cell niche couples intestinal stem-cell function to calorie intake. Nature. 2012;486:490–495. doi: 10.1038/nature11163. [DOI] [PMC free article] [PubMed] [Google Scholar]
- Young MD, Wakefield MJ, Smyth GK, Oshlack A. Gene ontology analysis for RNA-seq: accounting for selection bias. Genome Biol. 2010;11:R14. doi: 10.1186/gb-2010-11-2-r14. [DOI] [PMC free article] [PubMed] [Google Scholar]
- Yu M, Trobridge P, Wang Y, Kanngurn S, Morris SM, Knoblaugh S, Grady WM. Inactivation of TGF-beta signaling and loss of PTEN cooperate to induce colon cancer in vivo. Oncogene. 2014;33:1538–1547. doi: 10.1038/onc.2013.102. [DOI] [PMC free article] [PubMed] [Google Scholar]
Associated Data
This section collects any data citations, data availability statements, or supplementary materials included in this article.
Supplementary Materials
(A) Using Rosa (B) MAPK or (C) Wnt associated KEGG pathways between high fat- and low fat-fed mice.
(A) Using Rosa tomato red reporter mice (Rosa26RFP) crossed with Lgr5 tm1(cre/ERT2)Cle/J mice, appearance of red-labeled cells three days after TAM injection (1mg i.p. on two consecutive days) in jejunum and colon confirms efficiency of recombination arise from Lgr5+ stem cells (green) which express Cre. Also note the mosaic expression of the Lgr5 transgene in the gut. (B) Additional images showing appearance of progeny (red cells) in various segments of the gut three days after TAM.
Increased Akt substrate staining which only modestly stained in Control animals, but strong and widespread staining was present in Apc Het–Pten KO and Apc KO–Pten KO mice (n=3 per group), which was confirmatory of observed pAkt immunostaining in these mice.