Abstract
We introduce a new approach to detect individual microparticles that contain NIR fluorescent dye by multispectral optoacoustic tomography in the context of the hemoglobin-rich environment within murine liver. We encapsulated a near infrared (NIR) fluorescent dye within polystyrene microspheres, then injected them into the ileocolic vein, which drains to the liver. NIR absorption was determined using multispectral optoacoustic tomography. To quantitate the minimum diameter of microspheres, we used both colorimetric and spatial information to segment the regions in which the microspheres appear. Regional diameter was estimated by doubling the maximum regional distance. We found that the minimum microsphere size threshold for detection by multispectral optoacoustic tomography images is 78.9 µm.
Keywords: imaging, liver, microsphere, multispectral optoacoustic tomography, near infrared dye, resolution
Advances in molecular imaging have created new opportunities for cancer diagnostics and therapeutics. Efforts to identify metastases < 1 cm in size or biodistribution of nanotherapies, however, have been largely ineffective. This is because of a lack of reliable, non-invasive methods for monitoring either of these parameters with high spatial resolution over an extended time in vivo. Currently, positron emission tomography (PET), with or without computed tomography (CT), and magnetic resonance imaging (MRI) are the most popular clinical imaging modalities. These methods are sub-optimal for detecting metastatic foci and nanoparticle distribution, because PET suffers from poor spatial resolution, CT lacks functional imaging ability and MRI requires substantial signal concentration. Although light-based imaging modalities, such as near infrared (NIR) fluorescent and bioluminescent imaging, enable detection of labeled tumor cells or therapeutic agents in two dimensions, light scattering limits the depth to which the origin of optical signals can be resolved accurately, which limits its usefulness for detecting hepatic, adrenal and deep nodal metastases. A method that would enable three-dimensional monitoring of metastases as well as nanoparticle biodistribution in vivo would be a significant advance in tumor imaging; such a method would require a resolution of < 200 µm to serve this purpose adequately.
Optoacoustic imaging recently has emerged as a viable imaging modality in vivo (Kimbrough et al. 2015, Zeiderman et al. 2016, Brochu et al. 2016, Ermilov et al. 2009). Optoacoustic imaging has been used to analyze tissue hypoxia, to identify tumors and to determine biodistribution of nanoparticles at sub-millimeter resolution in murine models (Kimbrough et al. 2015, Zeiderman et al. 2016, Cao et al. 2016, Herzog et al. 2012). The promise of this technique is its unique ability to detect the conversion of light absorbance to a sound wave that produces a favorable signal-to-noise ratio, resolution, and penetration depth (McNally et al. 2016). Unlike nuclear or optical imaging, optoacoustic imaging detects endogenous contrast, hemoglobin and absorbing exogenous contrast agents, such as NIR dyes or gold nanoparticles. The theoretical capabilities of optoacoustic imaging, however, are under-utilized; optoacoustic imaging traditionally has been used to detect biological features at the surface, e.g., subcutaneous tumors. We investigated the limits of multispectral optoacoustic tomography (MSOT) detection of NIR fluorescent dyes in the mouse liver in vivo.
We detected microspheres containing NIR dye in the mouse liver using MSOT and used an adaptive matched filter (AMF) described earlier (Tzoumas et al. 2014) to distinguish further microspheres that contain NIR dye in liver vasculature.
MSOT imaging has been used to address the challenge of identifying abdominal tumors, e.g., pancreatic and colon cancer, which are difficult to detect owing to depth and poor uptake of exogenous contrast agents.
Material and methods
We investigated the minimum diameter of microspheres that contain NIR fluorescent dye that is detectable by MSOT in the mouse liver in vivo. To do this, we developed the following framework (Fig. 1): 1) dye incorporation in polystyrene microspheres, 2) scanning electron microscopy, 3) NIR fluorescence of microspheres, 4) ileocolic injection of microspheres, 5) detection of hepatic seeding of NIR fluorescent microspheres by MSOT and 6) ex vivo conformation of hepatic seeding by microspheres. We describe the details for each step below.
Fig. 1.
The proposed approach was utilized to estimate the minimum size microsphere that contains NIR dye that can be detected by MSOT in the liver, a hemoglobin-rich background.
Dye incorporation in polystyrene microspheres
IR-780 iodide dye was incorporated into beads as follows (Lee et al. 2011). Polystyrene microspheres (106−125 µm, Polysciences, Inc., Warrington, PA), 0.0017 g, was added to 800 µl ultrapure water (Millipore, Billerica, MA) and 20 µl 2.7 mM IR-780 iodide dye (Sigma Aldrich, St. Louis, MO) and mixed for 6 h at 25° C to produce microspheres that encapsulate IR-780 dye. The microspheres with dye then were centrifuged at 4,500 × g for 15 min at 25° C with 10 mM sodium phosphate buffer, pH 7.4, to remove unbound dye. Finally, microspheres containing dye were placed in dialysis tubing (2,000 molecular weight cut-off and dialyzed against 10 mM phosphate buffer, pH 7.4, containing 0.5 % NaCl for 24 h; the phosphate buffer was changed every 4 h.
The concentration of dye in the microspheres was determined as follows: 0.0010 g of microspheres with dye was dried for 1 h using a Savant RVT 100 Refrigerated Vapor Trap (Thermofisher, Grand Island, New York). Then 0.0010 g of microspheres with dye were dried, mixed with 0.1 ml N, N-dimethylformamide (DMF), incubated for 24 h at room temperature and centrifuged at 4,500 × g for 20 min. The absorbance of the supernatant was measured using a NanoDrop 2000c/2000 UV-vis spectrophotometer (Thermo scientific, Wilmington, DE) at 780 nm. The concentration of dye within the microspheres was determined using a calibration curve using a series of known concentrations of IR-780 dye and based on the absorbance of dye. The concentration of encapsulated IR-780 dye within the microsphere was 2 µM/0.0010 g microsphere.
Scanning electron microscopy
Polystyrene microspheres with or without dyes were placed on a carbon grid (Ted Pella, Redding, CA) and sprayed with gold for 10 min using a Balzers MED-010 (Bal-Tec AG, Balzers, Liechtenstein) deposition system. The size and morphology of the microspheres then were assessed in 25 particles/treatment using scanning electron microscopy (VEGA-II Kohoutovice, Tescan, Brno, Czech Republic) (Fig. 2 A, B; Table 1). Image J software was used to determine the diameter of microspheres with and without dye.
Fig. 2.
Identification of microsphere size and conformation of IR-780 dye encapsulation. SEM image of microspheres without dye (A) and with IR-780 dye (B). Encapsulation of IR-780 dye did not alter the size of the microsphere substantially. (C) Presence of IR-780 dye within the microspheres was confirmed using NIR fluorescent imaging.
Table 1.
Size of microspheres determined from SEM images
| Size (µm) | SD | |
|---|---|---|
| Particle only | 135.8974 | 8.9439 |
| 780 particle | 137.0256 | 12.271 |
The diameter of 25 microspheres (sample particle only or IR-780 particle) was determined from SEM images using Image J software.
NIR fluorescence of microspheres
Microspheres that contained IR-780 dye or no dye were placed in 1.5 ml tubes and NIR fluorescence was evaluated using an Odyssey infrared imaging system (LiCOR Biosciences, Lincoln, NE) (Fig. 2C) as described earlier (Zeiderman et al. 2016).
Ileocolic injection of microspheres
We adhered strictly to the Institutional Animal Care and Use Committee (IACUC) approved protocol for the care and use of animals. Female 8 week-old athymic mice were maintained on a diet of 2920X alfalfa-free feed (Harlan Laboratories, Indianapolis, IN) as in previous studies (Kimbrough et al. 2015; Zeiderman et al 2016, Inoue et al. 2008). Mice were anesthetized using 1.5% inhaled isoflurane. A midline incision was made and the ileocolic vein was exposed. One hundred microliters of NIR-labeled 137 µm microspheres, five microspheres/µl, were injected into the vein using a 28-gauge needle and 1 ml tuberculin syringe (Goldrosen et al. 1986, 1990). A cotton-tipped applicator was placed over the injection site for 1 min to achieve hemostasis. After the cecum was returned to its proper position, the peritoneal membrane was closed using 5-O chromic suture and the body wall closed with 5-O nylon (Ethicon, Cincinnati, OH).
MSOT imaging
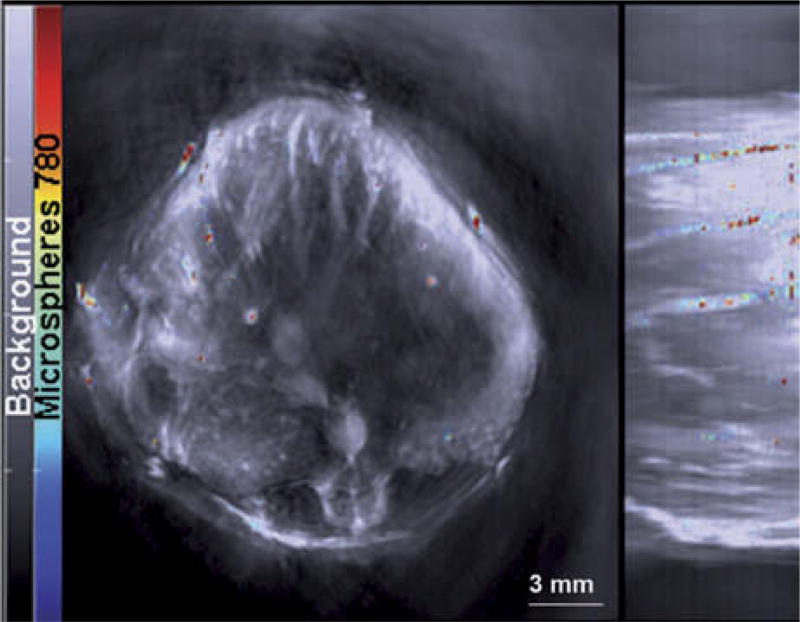
We imaged the mice using an inVision 256-TF MSOT (iThera Medical, Munich, Germany) and methods similar to those reported earlier (Kimbrough et al. 2015, Zeiderman et al. 2016). Mice were placed ventral side up in an animal holder and positioned in a nose cone for delivery of anesthesia. Anesthesia was maintained with 1.5% isoflurane in 0.8 l medical air and 0.1 l O2 during image acquisition. Imaging was performed using axial 0.1 mm slices through the liver region at wavelengths of 700, 715, 750, 770, 775, 780, 790, 800, 850 and 900 nm for each position (Fig. 3). Although individual frames were not affected by animal motion because the acquisition time/frame is less than one millisecond, 25 frames at each wavelength were acquired and averaged to compensate for animal breathing motion. Respiration rate and signs of distress were monitored through all stages of the imaging procedure. Images were reconstructed using back projection and evaluated using an AMF-based algorithm, where a common background model was derived from all data sets before the injection of the particles, and the measured absorption spectrum of IR-780 dye was used as a standard to identify locations of IR-780 signal within the MSOT images. The resulting images were analyzed using ImageJ software.
Fig. 3.
Microspheres containing IR-780 dye were detected using MSOT. The gray scale image represents the single wavelength at 850 nm with a jet overlay of spectrally resolved IR-780 signal within microspheres.
NIR fluorescent conformation of hepatic seeding of microspheres
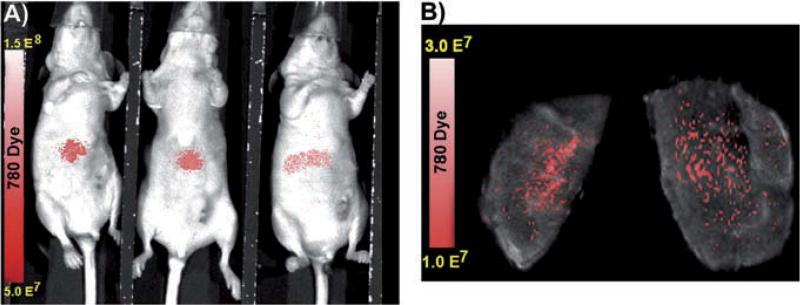
The mice were kept under anesthesia with 1.5% inhaled isoflurane following ileocolic injection of microspheres that contained IR-780 dye. While under anesthesia, NIR fluorescence was determined using an Advanced Molecular Imager 1000-X (AMI 1000-X; Spectral Imaging Instruments, Tucson, AZ). The mice were imaged for 1 sec using 750 excitation and 790 emission filters. After MSOT imaging, the livers were excised and evaluated for confirmation of microsphere distribution within the liver based upon IR-780 dye signal acquired by the AMI-1000-X (Fig. 4).
Fig. 4.
Confirmation of IR-780 microsphere distribution within the mouse liver. NIR fluorescent images confirm successful seeding of mouse liver by ileocolic vein injection in vivo (A) and ex vivo (B).
Calculation of detectable microsphere diameter
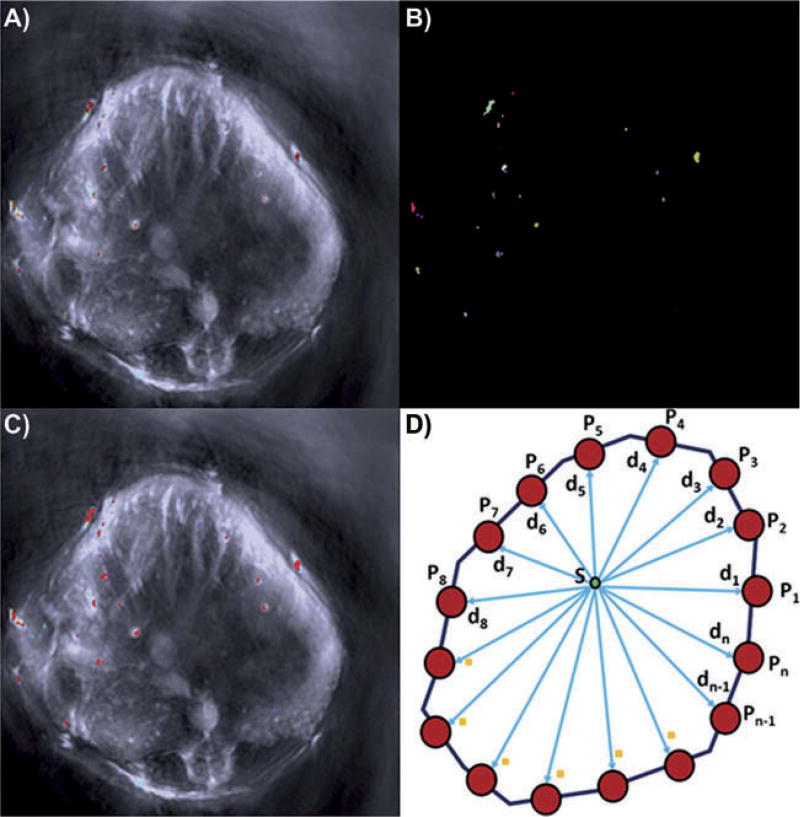
While the microspheres without encapsulated dye averaged 135.8974 µm in diameter with a standard deviation of 8.943 µm, the microspheres encapsulating IR-780 dye averaged 137.0256 µm in diameter with a standard deviation of 12.271 µm (Fig. 2; Table 1). Because the diameter of the spherical IR-780 dye containing microspheres was 137 µm (Fig. 2) and because an individual microsphere could appear partially in two adjacent slices, we used a segmentation approach developed by our group to determine the minimum diameter of microsphere (or partial microsphere) that was detectable by MSOT. Our method uses a linear combination of Gaussian distributions and a Markov-Gibbs random field to model colorimetric and interpixellar spatial relationships, respectively, in an MSOT image (El-Baz et al. 2005, 2006). A nonsegmented MSOT image is shown in Fig. 5a. Figure 5b illustrates a segmented image and Fig. 4c depicts the superposition of a segmented image on an unsegmented one. To determine the diameter for each region detected in the segmented image (Fig. 5b), we calculated the distance map within each region by selecting the minimum distance (min) between each point within the segmented region and all boundary points (Fig. 5d). For a given point, S, distance was calculated as follows:
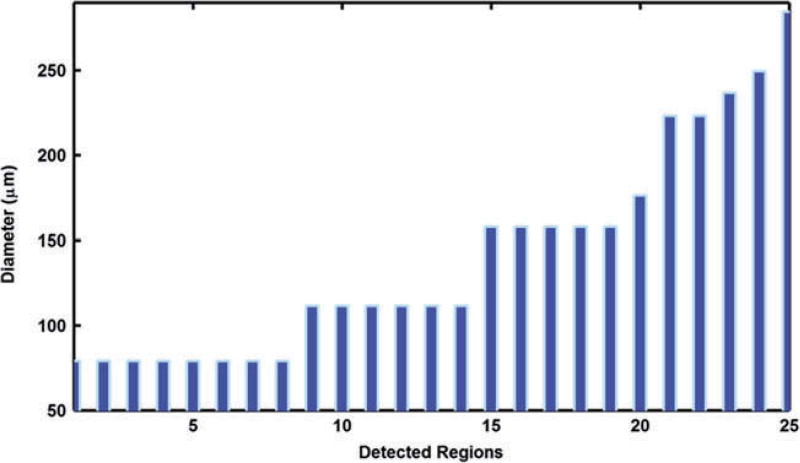
The diameter of each region was estimated by doubling the maximum distance within each region. Figure 6 shows the estimated diameters for the 25 detected regions shown in Fig. 5b. We found that the minimum diameter detected by our approach was 78.9 µm and the maximum diameter was 284.3 µm. The average diameter for all 25 regions was 139.3 ± 62.4 µm. These sizes are explained by the following: 1) the minimum diameter of 78.9 µm detected represents portions of a single microsphere that likely is partially in adjacent slices; 2) the maximum of 284.3 µm represents two adjacent microspheres within the same slice; 3) the average of 139.3 represents a single microsphere contained exclusively within a single slice.
Fig. 5.
Illustration of our quantitative results. A) typical MSOT image. B) Region of microspheres detected. C) region of microspheres detected superimposed on the original MSOT images. D) Illustration of distance map calculation. Note that we used the region growing algorithm to detect each microsphere in which each area containing IR-780 dye is represented by a different color to measure its radius. In (C), each region is given a uniform red color to permit measurement using the region growing algorithm.
Fig. 6.
Parameters calculated for the 25 detected regions from a single slice in Fig. 2B. The regions detected at 78.9 µm likely are partial microspheres located in adjacent slices. The regions detected at 139.3 µm represent a single microsphere in the plane. The regions detected that exceed 139.3 µm represent adjacent, multiple microspheres within the same blood vessel.
Using the novel approach of combining image segmentation with mathematical algorithms, we demonstrated the potential for detecting 78.9 µm sized structures in murine liver by MSOT in vivo. We have demonstrated that MSOT can be used to identify discrete NIR-dye based signals at resolutions of < 137 µm at a depth of 1 cm and within the context of a hemoglobin-rich murine liver. The minimum size of discrete microspheres detected, including those that appear in adjacent slices, was 78.9µm.
Acknowledgments
Our study was funded by NIH grants R01CA205941 and R01EB020125 to LRM.
Footnotes
Color versions of one or more of the figures in the article can be found online at www.tandfonline.com/ibih.
Declaration of interest NB and SM are employees of iThera Medical. The remaining authors declare no conflict of interest. The authors alone are responsible for the content and writing of this paper.
References
- Brochu FM, Brunker J, Joseph J, Tomaszewski MR, Morscher S, Bohndiek SE. Towards quantitative evaluation of tissue absorption coefficients using light fluence correction in optoacoustic tomography. IEEE Transactions Medical Imaging. 2016 doi: 10.1109/TMI.2016.2607199. [DOI] [PubMed] [Google Scholar]
- Cao J, Campbell J, Liu L, Mason RP, Lippert AR. In vivo chemiluminescent imaging agents for nitroreductase and tissue oxygenation. Anal. Chem. 2016;88:4995–5002. doi: 10.1021/acs.analchem.6b01096. [DOI] [PMC free article] [PubMed] [Google Scholar]
- El-Baz A, Farag A, Gimel’farb G. Iterative approximation of empirical grey-level distributions for precise segmentation of multimodal images. EURASIP J. Appl. Sign. Proc. 2005;2005:1969–1983. [Google Scholar]
- Ermilov SA, Conjusteau A, Leonard M, Lacewell R, Mehta K, Miller T, Alexander A, Oraevsky AA. Laser optoacoustic imaging system for detection of breast cancer. J. Biomed. Optics. 2009;14:024007. doi: 10.1117/1.3086616. [DOI] [PubMed] [Google Scholar]
- Farag A, El-Baz A, Gimel’farb G. Precise segmentation of multimodal images. IEEE Transac. Image. 2006;15:952–968. doi: 10.1109/tip.2005.863949. [DOI] [PubMed] [Google Scholar]
- Goldrosen MH, Biddle W, Pancook J, Bakshi S, Vanderheyden J, Fritzberg A, Morgan A, Foon K. Biodistribution, pharmacokinetic, and imaging studies with 186Re-labeled NR-LU-10 whole antibody in LS174T colonic tumor-bearing mice. Cancer Res. 1990;50:7973–7978. [PubMed] [Google Scholar]
- Goldrosen MH, Paolini N, Holyoke E. Description of a murine model of experimental hepatic metastases. J. Natl. Cancer Inst. 1986;77:823–828. doi: 10.1093/jnci/77.3.823. [DOI] [PubMed] [Google Scholar]
- Herzog E, Taruttis A, Beziere N, Lutich AA, Razansky D, Ntziachristos V. Optical imaging of cancer heterogeneity with multispectral optoacoustic tomography. Radiology. 2012;263:461–468. doi: 10.1148/radiol.11111646. [DOI] [PubMed] [Google Scholar]
- Inoue Y, Izawa K, Kiryu S, Tojo A, Ohtomo K. Diet and abdominal autofluorescence detected by in vivo fluorescence imaging of living mice. Molecular Imaging. 2008;7:21–27. [PubMed] [Google Scholar]
- Kimbrough CW, Khanal A, Zeiderman M, Khanal B, Burton NC, McMasters KM, Vickers SM, Grizzle WE, McNally LR. Targeting acidity in pancreatic adenocarcinoma: multispectral optoacoustic tomography detects pH-low insertion peptide probes in vivo. Clin. Cancer Res. 2015;21:4576–4585. doi: 10.1158/1078-0432.CCR-15-0314. [DOI] [PMC free article] [PubMed] [Google Scholar]
- Lee JH, Gomez I, Sitterle V, Meredith J. Dye-labeled polystyrene latex microspheres prepared via a combined swelling-diffusion technique. J. Coll. Interf. Sci. 2011;363:137–144. doi: 10.1016/j.jcis.2011.07.047. [DOI] [PubMed] [Google Scholar]
- McNally LR, Mezera M, Morgan D, Frederick P, Yang E, Eltoum I, Grizzle WE. Current and emerging clinical applications of multispectral optoacoustic tomography (MSOT) in oncology. Clin. Cancer Res. 2016;22:3432–3439. doi: 10.1158/1078-0432.CCR-16-0573. [DOI] [PMC free article] [PubMed] [Google Scholar]
- Tzoumas S, Deliolanis N, Morscher S, Ntziachristos V. Unmixing molecular agents from absorbing tissue in multispectral optoacoustic tomography. IEEE Transac. Med. Imaging. 2014;33:48–60. doi: 10.1109/TMI.2013.2279994. [DOI] [PubMed] [Google Scholar]
- Zeiderman MR, Morgan D, Christein J, Grizzle WE, McMasters K, McNally LR. Acidic pH-targeted chitosan-capped mesoporous silica coated gold nanorods facilitate detection of pancreatic tumors via multispectral optoacoustic tomography. ACS Biomat. Sci. Eng. 2016;2:1108–1120. doi: 10.1021/acsbiomaterials.6b00111. [DOI] [PMC free article] [PubMed] [Google Scholar]


